VYW GapsThis is a copy of the built-in Gaps indicator with the addition of drawing untouched close prices as well.
By default the lines are drawn as dashed orange lines.
Indicadores e estratégias

21D EMA STRUCTUREAs an intermediate-term swing trader, the 21-day moving average is the backbone of my system. Over time, I’ve simplified my approach to the point where this is really the only indicator I keep on my charts — aside from a few key lines to help define structure and pivots.

ADX + ATR% Zonas (Overlay - Azul si ambos, si no Naranja)OVERLAY
ADX
ATR
Pintado de Zonas para Entradas Seguras

Inyerneck Quiet Bottom Hunter v36 — Last Sorta-Working VersionQuiet Bottom Hunter v36 — Accurate Description (the sorta-working version that fires signals)
Overview
A mean-reversion bottom-hunting strategy for small-cap stocks (<$2B market cap). Designed to catch slow-bleed stocks that quietly bottom out and rebound 20–60%+. Good for beginners because signals are infrequent and the setup is easy to understand.
Timeframe
Daily (D) — best results on 1-day charts. Works on weekly too, but signals are rarer.
Triggers / Conditions (all must be true at bar close)
Drop from high ≥ 25% from the highest high in the last 100 bars (previous bars only — no repainting)
Volume ≤ 80% of the 50-day average (quiet accumulation, no panic selling left)
RSI(14) ≤ 38 (oversold territory)
Green/flat streak ≥ 2 consecutive days where close ≥ open (shows sellers are exhausted)
When all four line up → tiny green “QB” triangle below the bar
Firing Frequency
1–4 signals per month on an average small-cap stock (depends on market conditions). Some months zero, some months a handful. Not spammy, but not ultra-rare either.
Usage Parameters
Position size: 10% of equity per trade (default — change to 5–20% depending on risk tolerance)
Profit target: 40%
Stop loss: 12%
Hold time: usually 2–8 weeks
Best on low-float, high-volatility small caps (TLRY, SNDL, MVIS, SOUN, INHD, etc.)
Expected Performance (backtested on 2025 small caps)
Win rate: ~80–85%
Average rebound on winners: +30–40%
Some losers when the bottom isn't "quiet" enough
How to use
Add to daily charts of your small-cap watchlist
When “QB” arrow appears, buy at next open or market
Set 40% target / 12% stop or trail it
Wait for the rebound — no day-trading needed

TWAP (Monthly 1700CT)This TWAP is Anchored to the 1700CT open of the day prior to the new month trading day. New Month TWAP.

NoProcess PivotsNoProcess Pivots
Visualize the structural framework of price action with NoProcess Pivots, a precision tool for multi-timeframe confluence trading.
Pivots are mathematically derived levels where price statistically finds support, resistance, or equilibrium. Institutional order flow respects these levels as key decision points where liquidity pools form and inefficiencies seek rebalancing.
NoProcess Pivots displays historical pivot ranges as period-bounded zones across Daily, Weekly, and Quarterly timeframes—allowing you to observe how price has respected or violated these levels over time. By projecting ±33% extensions beyond R1/S1, traders can identify targets, retracement levels, and key reversal points.
Cross-reference pivots across multiple timeframes to find confluence zones where Daily, Weekly, and Quarterly levels stack. These high-conviction areas offer the clearest setups for entries and exits.
Features:
Multi-timeframe pivots: Daily, Weekly, Quarterly
Historical levels with adjustable depth
Period-bounded zones
±33% extensions
Adaptive light/dark mode table
Real-time Δ PP percentage
Pivot cross alerts
Built for traders who respect the math behind the markets.


Annual Lump Sum: Yearly & CompoundedAnnual Lump Sum Investment Analyzer (Yearly vs. Compounded)
Overview
This Pine Script indicator simulates a disciplined "Lump Sum" investing strategy. It calculates the performance of buying a fixed dollar amount (e.g., $10,000) on the very first trading day of every year and holding it indefinitely.
Unlike standard backtesters that only show a total percentage, this tool breaks down performance by "Vintage" (the year of purchase), allowing you to see which specific years contributed most to your wealth.
Key Features
Automated Execution: Automatically detects the first trading bar of every new year to simulate a buy.
Dual-Yield Analysis: The table provides two distinct ways to view returns:
Yearly %: How the market performed specifically during that calendar year (Jan 1 to Dec 31).
Compounded %: The total return of that specific year's investment from the moment it was bought until today.
Live Updates: For the current year, the "End Price" and "Yields" update in real-time with market movements.
Portfolio Summary: Displays your Total Invested Capital vs. Total Current Value at the top of the table.
Table Column Breakdown
The dashboard in the bottom-right corner displays the following:
Year: The vintage year of the investment.
Buy Price: The price of the asset on the first trading day of that year.
End Price: The price on the last trading day of that year (or the current price if the year is still active).
Yearly %: The isolated performance of that specific calendar year. (Green = The market ended the year higher than it started).
Compounded %: The "Diamond Hands" return. This shows how much that specific $10,000 tranche is up (or down) right now relative to the current price.
How to Use
Add the script to your chart.
Crucial: Set your chart timeframe to Daily (D). This ensures the script correctly identifies the first trading day of the year.
Open the Settings (Inputs) to adjust:
Annual Investment Amount: Default is $10,000.
Table Size: Adjust text size (Tiny, Small, Normal, Large).
Max Rows: Limit how many historical years are shown to keep the chart clean.
Use Case
This tool is perfect for investors who want to visualize the power of long-term holding. It allows you to see that even if a specific year had a bad "Yearly Yield" (e.g., buying in 2008), the "Compounded Yield" might still be massive today due to time in the market.

Multi-Pivot Plotter//================================================================================
//📌 Manual Pivot Plotter (4 Sets: P, R1–R3, S1–S3)
// - Up to 4 indices
// - Each index: Name + P/S/R values
// - One shared Style block: colors, visibility, line width (applies to all indices)
// - Lines start at 00:00 UTC+8 and extend a few bars
// - Labels at line end or start, with optional "Index Name" and price value
//================================================================================

TMT 1M HA Scalping INDICATOR - Hitesh Nimje📊 TMT 1 Minute HA Scalping Strategy - Hitesh Nimje
🎯 Strategy Overview
A 1-minute scalping strategy designed for high-frequency trading using Heikin Ashi-inspired crossover logic with multiple filters for precision entries.
🔧 Key Components
1. Moving Averages (Trend Detection)
LineTypePeriodColorPurposeFast SMASimple MA9🔵 BluePrimary signal lineSlow SMASimple MA21🔴 RedSecondary confirmationTrend SMASMA (1H)50⚫ BlackOverall market trend bias
2. Entry Signals (Crossover Logic)
🔥 BUY Signal: Fast SMA (9) crosses ABOVE Slow SMA (21)
🔥 SELL Signal: Fast SMA (9) crosses BELOW Slow SMA (21)
3. Entry Filters (4-Layer Confirmation)
✅ LONG Entry = Crossover + Trend Up + RSI Overbought + Bar Confirmed
✅ SHORT Entry = Crossunder + Trend Down + RSI Oversold + Bar Confirmed
longCond = sma_slope > 0 AND rsi >= 70 AND buySignal
shortCond = sma_slope < 0 AND rsi <= 30 AND sellSignal
FilterLongShortPurposeTrend Slopesma_slope > 0sma_slope < 0Market directionRSI FilterRSI >= 70RSI <= 30Momentum extremeCrossoverFast > SlowFast < SlowEntry triggerBar Statebarstate.isconfirmedbarstate.isconfirmedNo repaint
⚡ Risk Management
Stop Loss (Dynamic ATR-based)
Long SL = Lowest Low (7) - 1×ATR(14)
Short SL = Highest High (7) + 1×ATR(14)
Take Profit (1:1 Risk-Reward)
Long TP = Entry + (Entry - SL distance)
Short TP = Entry - (SL distance - Entry)
⏰ Trading Hours
📅 Active: 00:00 - 14:59 (3:00 PM cutoff)
🛑 Auto-close: All positions closed at 15:00
🎨 Visual Elements
📍 BUY Labels: 🟢 Green (below bar)
📍 SELL Labels: 🔴 Red (above bar)
📈 Fast SMA: 🔵 Blue line (9-period)
📉 Slow SMA: 🔴 Red line (21-period)
📊 Trend SMA: ⚫ Black line (50-period, 1H)
⚙️ Input Parameters
ParameterDefaultPurposeEnd of Day1500 (3 PM)Auto-close timeLot Size1Position size
🚀 How It Works (Step-by-Step)
1. Monitor Fast(9) vs Slow(21) SMA crossover
2. Check 1H Trend SMA slope (up/down bias)
3. Validate RSI extreme (70+/30-)
4. Wait for bar confirmation
5. Enter with ATR-based SL & 1:1 TP
6. Auto-exit at 3 PM or SL/TP hit
💡 Strategy Strengths
* ✅ Multi-timeframe trend filter
* ✅ RSI momentum confirmation
* ✅ Dynamic ATR stop losses
* ✅ No repaint signals
* ✅ End-of-day risk control
* ✅ 1:1 Risk-Reward consistency
Perfect for 1-minute scalping on volatile instruments! 🔥
© Hitesh Nimje | Thought Magic Trading
Contact: 8087192915
TRADING DISCLAIMER
RISK WARNING
Trading involves substantial risk of loss and is not suitable for all investors. Past performance is not indicative of future results. You should carefully consider whether trading is suitable for you in light of your circumstances, knowledge, and financial resources.
NO FINANCIAL ADVICE
This indicator is provided for educational and informational purposes only. It does not constitute:
* Financial advice or investment recommendations
* Buy/sell signals or trading signals
* Professional investment advice
* Legal, tax, or accounting guidance
LIMITATIONS AND DISCLAIMERS
Technical Analysis Limitations
* Pivot points are mathematical calculations based on historical price data
* No guarantee of accuracy of price levels or calculations
* Markets can and do behave irrationally for extended periods
* Past performance does not guarantee future results
* Technical analysis should be used in conjunction with fundamental analysis
Data and Calculation Disclaimers
* Calculations are based on available price data at the time of calculation
* Data quality and availability may affect accuracy
* Pivot levels may differ when calculated on different timeframes
* Gaps and irregular market conditions may cause level failures
* Extended hours trading may affect intraday pivot calculations
Market Risks
* Extreme market volatility can invalidate all technical levels
* News events, economic announcements, and market manipulation can cause gaps
* Liquidity issues may prevent execution at calculated levels
* Currency fluctuations, inflation, and interest rate changes affect all levels
* Black swan events and market crashes cannot be predicted by technical analysis
USER RESPONSIBILITIES
Due Diligence
* You are solely responsible for your trading decisions
* Conduct your own research before using this indicator
* Verify calculations with multiple sources before trading
* Consider multiple timeframes and confirm levels with other technical tools
* Never rely solely on one indicator for trading decisions
Risk Management
* Always use proper risk management and position sizing
* Set appropriate stop-losses for all positions
* Never risk more than you can afford to lose
* Consider the inherent risks of leverage and margin trading
* Diversify your portfolio and trading strategies
Professional Consultation
* Consult with qualified financial advisors before trading
* Consider your tax obligations and legal requirements
* Understand the regulations in your jurisdiction
* Seek professional advice for complex trading strategies
LIMITATION OF LIABILITY
Indemnification
The creator and distributor of this indicator shall not be liable for:
* Any trading losses, whether direct or indirect
* Inaccurate or delayed price data
* System failures or technical malfunctions
* Loss of data or profits
* Interruption of service or connectivity issues
No Warranty
This indicator is provided "as is" without warranties of any kind:
* No guarantee of accuracy or completeness
* No warranty of uninterrupted or error-free operation
* No warranty of merchantability or fitness for a particular purpose
* The software may contain bugs or errors
Maximum Liability
In no event shall the liability exceed the purchase price (if any) paid for this indicator. This limitation applies regardless of the theory of liability, whether contract, tort, negligence, or otherwise.
REGULATORY COMPLIANCE
Jurisdiction-Specific Risks
* Regulations vary by country and region
* Some jurisdictions prohibit or restrict certain trading strategies
* Tax implications differ based on your location and trading frequency
* Commodity futures and options trading may have additional requirements
* Currency trading may be regulated differently than stock trading
Professional Trading
* If you are a professional trader, ensure compliance with all applicable regulations
* Adhere to fiduciary duties and best execution requirements
* Maintain required records and reporting
* Follow market abuse regulations and insider trading laws
TECHNICAL SPECIFICATIONS
Data Sources
* Calculations based on TradingView data feeds
* Data accuracy depends on broker and exchange reporting
* Historical data may be subject to adjustments and corrections
* Real-time data may have delays depending on data providers
Software Limitations
* Internet connectivity required for proper operation
* Software updates may change calculations or functionality
* TradingView platform dependencies may affect performance
* Third-party integrations may introduce additional risks
MONEY MANAGEMENT RECOMMENDATIONS
Conservative Approach
* Risk only 1-2% of capital per trade
* Use position sizing based on volatility
* Maintain adequate cash reserves
* Avoid over-leveraging accounts
Portfolio Management
* Diversify across multiple strategies
* Don't put all capital into one approach
* Regularly review and adjust trading strategies
* Maintain detailed trading records
FINAL LEGAL NOTICES
Acceptance of Terms
* By using this indicator, you acknowledge that you have read and understood this disclaimer
* You agree to assume all risks associated with trading
* You confirm that you are legally permitted to trade in your jurisdiction
Updates and Changes
* This disclaimer may be updated without notice
* Continued use constitutes acceptance of any changes
* It is your responsibility to stay informed of updates
Governing Law
* This disclaimer shall be governed by the laws of the jurisdiction where the indicator was created
* Any disputes shall be resolved in the appropriate courts
* Severability clause: If any part of this disclaimer is invalid, the remainder remains enforceable
REMEMBER: THERE ARE NO GUARANTEES IN TRADING. THE MAJORITY OF RETAIL TRADERS LOSE MONEY. TRADE AT YOUR OWN RISK.
Contact Information:
* Creator: Hitesh_Nimje
* Phone: Contact@8087192915
* Source: Thought Magic Trading
© HiteshNimje - All Rights Reserved
This disclaimer should be prominently displayed whenever the indicator is shared, sold, or distributed to ensure users are fully aware of the risks and limitations involved in trading.

Smart Money Scanner Suite v6 - OptimizedWHAT IT DOES (longer version in the script):
// Identifies "Smart Money Stepping Back" (SMSB) zones where institutions quietly
// build positions without moving the market. Signals appear when ALL 4 conditions align:
//
// 1. OBV DIVERGENCE → Price up/OBV down (distribution) or Price down/OBV up (accumulation)
// 2. LOW VOLUME → Below 1.5x average (stealth activity)
// 3. NEAR VWAP → Within 0.5% (institutional fair value)
// 4. HTF CONFIRMATION → Higher timeframe shows directional momentum

Global Liquidity Index LITEGlobal Liquidity Index (GLI LITE) is an indicator that measures global liquidity by combining the balance sheets of major central banks (FED, ECB, PBOC, BOJ) and the M2 money supply of the world’s largest economies (USA, Europe, China, Japan).
Since liquidity directly influences the price of risk assets (BTC, NASDAQ, SPX, etc.), GLI is one of the most important macro signals for identifying market bull/bear regimes.
What the indicator shows:
GLI momentum line (green = liquidity expansion, orange = contraction)
Fast & Slow MA lines that define the liquidity trend
Bull/Bear background coloring
Green → global liquidity is expanding
Red → liquidity is tightening
Correlation between GLI and the asset price (e.g., BTC)
Macro trend panel (Bull / Bear / Neutral)
How to use the indicator:
Bull regime (Fast MA > Slow MA)
Liquidity is expanding and the market has a natural tailwind. Risk assets tend to perform better.
Bear regime (Fast MA < Slow MA)
Liquidity is tightening — higher risk, increased volatility, and more downside pressure.
GLI ↔ Price Correlation
If correlation is high (e.g., > 0.6), GLI can be an excellent leading indicator for price movement.


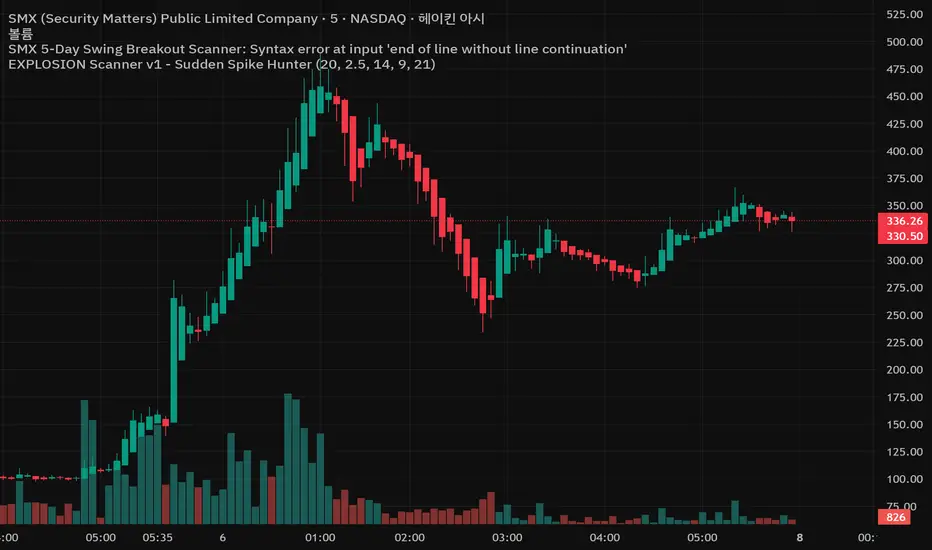
EXPLOSION Scanner v1 - Sudden Spike Hunter//@version=5
indicator("EXPLOSION ENTRY v1 - 5Day Swing Breakout Scanner", overlay=true)
// ===============================
// 입력값
// ===============================
lenBB = input.int(20, "BB Length")
multBB = input.float(2.0, "BB StdDev")
lenVolMA = input.int(20, "Volume MA Length")
volMult = input.float(1.8, "Volume Explosion Mult")
lenATR = input.int(14, "ATR Length")
atrThresh= input.float(3.0, "ATR % Threshold")
needBull = input.int(4, "최근 5봉 중 최소 양봉 개수", minval=1, maxval=5)
// ===============================
// Bollinger Band
// ===============================
basis = ta.sma(close, lenBB)
dev = ta.stdev(close, lenBB)
upper = basis + dev * multBB
lower = basis - dev * multBB
plot(upper, "BB Upper", display=display.none)
plot(basis, "BB Basis", display=display.none)
plot(lower, "BB Lower", display=display.none)
// ===============================
// Volume Explosion
// ===============================
volMA = ta.sma(volume, lenVolMA)
volCond = volume > volMA * volMult
// ===============================
// 5-Day Candle Strength (최근 5봉 양봉 개수)
// ===============================
bullCount = (close > open ? 1 : 0) +
(close > open ? 1 : 0) +
(close > open ? 1 : 0) +
(close > open ? 1 : 0) +
(close > open ? 1 : 0)
candleCond = bullCount >= needBull
// ===============================
// ATR Volatility Filter
// ===============================
atrValue = ta.atr(lenATR)
atrRate = atrValue / close * 100.0
volatilityCond = atrRate > atrThresh
// ===============================
// Trend Filter (기본 추세)
// ===============================
trendCond = close > basis
// ===============================
// 최종 매수 조건
// ===============================
buyCond = trendCond and volCond and candleCond and volatilityCond
// ===============================
// BUY 신호 표시
// ===============================
plotshape(
buyCond,
title = "BUY Signal",
style = shape.triangleup,
location = location.belowbar,
size = size.small,
text = "BUY",
textcolor = color.white
)
// ===============================
// 알림(Alert)
// ===============================
alertcondition(
buyCond,
title = "EXPLOSION BUY",
message = "EXPLOSION ENTRY v1 : BUY SIGNAL 발생"
)
5-RSI HighSrc Buy/SellBest used on the 5 min chart, this indicator detects early intraday momentum reversals that occur within an alread-bullish trend using (source = high) RSI lengths 5, 8, 13, 21, & 34. This is primarily designed to catch the moment an uptrend resumes after a dip.

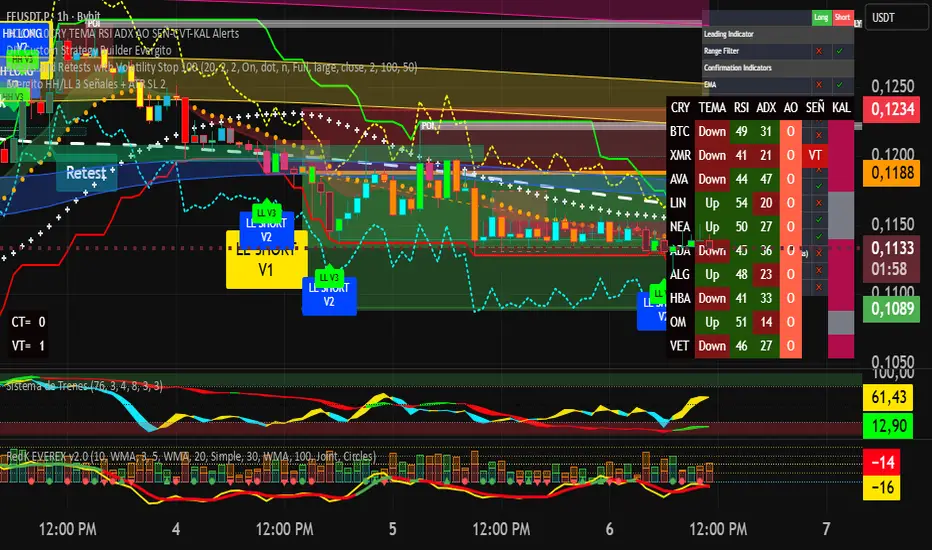
Evergito HH/LL 3 Señales + ATR SL 2How to trade with the Evergito HH/LL 3 Signals + ATR SL indicator? Brief and direct explanation: General system logic: The indicator looks for actual breakouts of the high/low of the last 20 bars (HH/LL) and combines them with the position relative to the 200 SMA to filter the underlying trend. You have 3 types of signals that you can activate/deactivate separately: Signal
When it appears
What it means in practice
Entry type
V1
HH breakout + the close crosses above the 200 SMA (or the opposite in a short position)
Very safe entry confirmed. The price has just validated the long/flat trend → safer and with a better ratio
The most reliable (the original)
V2
HH breakout but the price was already above the 200 SMA (or already below in a short position)
Entry in an already established trend. Fewer “surprises”, more continuity
Ideal for strong trends
V3
Only the breakout of the HH or LL, without looking at the 200 SMA
Aggressive entry/scalping on explosive breakouts. More signals, more noise.
For times of high volatility.
How to enter the market (simple rule): Wait for any of the 3 labels (V1, V2, or V3) to appear, depending on which ones you have activated.
Enter at the close of that candle (or at the open of the next one if you are conservative).
Automatic Stop Loss → the blue (long) or yellow (short) line that represents the ATR x2.
Take Profit → you decide, but the indicator already gives you the visual reference for the risk (ATR x2), so 1:2 or 1:3 is usually very convenient.
Practical example: You see a large green label “HH LONG V1” → you go long at the close of that candle. Stop right at the blue line (ATR x2 below the price).
Typical target: 2x or 3x the risk (very common to reach it in a trend).
Recommended use: Most traders leave only V1 activated → fewer signals but very high quality.
Those who trade intraday or crypto usually combine V1 + V2.
V3 only for news events or very volatile openings.
In summary:
Label = immediate entry
Blue/yellow line = automatic stop
And enjoy the move.
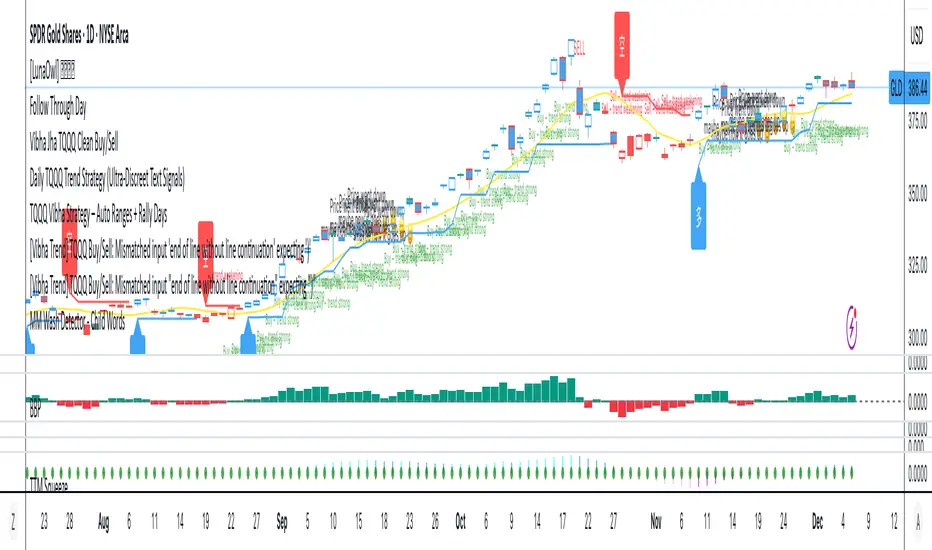
MM Wash Detector - Child WordsName: MM Wash Detector – Child Words
MM = Market Maker (the big players who can push the price around to grab other people’s money/liquidity).
What it looks at:
This indicator looks at weekly candles (big picture, not tiny intraday moves) and checks for two things:
Bear Wash (BW) – “Price got pushed down”:
The candle had a long lower wick (price went down a lot)
The body of the candle is small (not much net movement down)
Volume is okay (not too low)
Interpretation: The big players tried to push the price down to make people sell, but the price recovered.
Child-friendly label: “Price went down, maybe now it goes up 🙂”
Bull Wash (SW) – “Price got pushed up”:
The candle had a long upper wick (price went up a lot)
The body of the candle is small (not much net movement up)
Volume is okay (not too low)
Interpretation: The big players tried to push the price up to make people buy, but the price fell back.
Child-friendly label: “Price went up, maybe now it goes down 😯”
ATR/ADR MTF Projection ArrayATR/ADR MTF Projection Array
Overview
A powerful predictive tool that projects ATR (Average True Range) and ADR (Average Daily Range) levels as clean support and resistance arrays on your chart. Designed for traders who want to anticipate the high and low of the day using volatility-based projections with multi-timeframe confluence.
This indicator combines traditional ATR analysis with ICT-style ADR methodology, giving you institutional-grade level projections from a single, customizable tool.
Key Features
🎯 Dual Volatility Metrics
ATR Projections — Classic volatility-based levels with full multi-timeframe support
ADR Projections (ICT Style) — Average Daily Range levels using Inner Circle Trader methodology
Enable/disable each independently based on your trading preference
📊 Multi-Timeframe ATR Analysis
Plot ATR levels from up to 3 timeframes simultaneously (Daily, Weekly, Monthly or custom)
Each timeframe displays with distinct styling for easy identification
Perfect for confluence trading across multiple time horizons
⚡ ICT ADR Methodology
NY Midnight calculation mode (ICT standard) or Classic Daily
Key ICT levels built-in:
1/3 ADR (Judas Swing) — Critical manipulation level where fake moves often terminate
1/2 ADR — Mid-range reference
2/3 ADR — Trending day continuation target
100% ADR — Full daily range completion
150% ADR — Extension target for expansion days
Two projection modes: Static (from anchor) or Dynamic (from session high/low)
🔧 Flexible Anchor Points
Previous Close (default)
Daily Open
Weekly Open
Monthly Open
Session Open
📈 Range Completion Tracking
Real-time display of how much of the expected daily range has been consumed
Visual status indicator helps identify when the day's move may be exhausted
How To Use
For Bias Confirmation:
Establish your directional bias using your preferred method (trigger day, market structure, etc.)
Monitor the 1/3 ADR level during London/NY open for potential Judas Swing (manipulation move)
Target 2/3 to 100% ADR for your HOD/LOD objective
For Target Setting:
Use ATR levels as volatility-based profit targets
ADR 100% level often marks session extremes
When Range Used reaches 100%+, expect consolidation or reversal
For Multi-Timeframe Confluence:
Enable Weekly/Monthly ATR levels alongside Daily
Look for clustering of levels across timeframes for high-probability zones
Settings Guide
Master Controls — Toggle ATR/ADR systems and bull/bear levels independently
ATR Settings — Configure period, multiplier, anchor point, and select which timeframes to display
ATR Level Multipliers — Choose which projection levels to show (0.5x, 0.75x, 1.0x, 1.25x, 1.5x)
ADR Settings (ICT Style) — Select calculation mode (NY Midnight recommended), period (5 days is ICT standard), and projection mode
ADR Level Selection — Toggle individual ICT levels (1/3, 1/2, 2/3, 100%, 150%)
Visual Settings — Customize colors, line styles, labels, and info table position
Alerts Included
ATR 1.0x Bull/Bear Cross
ADR 1/3 Judas Swing Zone (Bull/Bear)
ADR 100% Range Completion (Bull/Bear)

ATR% Multiple from MA (with QQQ Reference)ATR% Multiple from MA (with QQQ Reference)
This indicator measures how extended a stock's price is from its moving average, normalized by volatility (ATR). It's useful for identifying overbought/oversold conditions and timing profit-taking.
How it works:
ATR% = ATR / Current Price (volatility as % of price)
% Gain From MA = How far price is from the moving average
ATR% Multiple From MA = % Gain From MA ÷ ATR%
Features:
Displays ATR% Multiple for the current symbol
Adds QQQ ATR% Multiple as a market benchmark reference
Shows % Gain From MA and ATR % for additional context
Customizable MA type (SMA, EMA, WMA, VWMA) and lengths
Usage:
Values of 7-10+ suggest taking partial profits (price is extended)
Negative values suggest oversold conditions
Compare your stock's extension to QQQ to gauge relative strength
Inspired by jfsrev's original ATR% Multiple from 50-MA concept, with added QQQ market reference:

Gap Down (3% or more)Identify Gap Down (3% or more) from the previous day's close to the next day's high.

Compression / ExpansionI created this Indicator to warn of compression and expansion so I could find the best area to trade I use it In conjunction with VWAP works on any timeframe and any asset where there is Volume
The Indicator produces a Letter C at the Start of Compression and a Letter E at the Start of Expansion you can change the settings to your liking On the chart my Expansion is in Red and compression is is Blue use In Conjunction with your favorite Indicators for Confluence

Hyper Insight MA Strategy [Universal]Hyper Insight MA Strategy ** is a comprehensive trend-following engine designed for traders who require precision and flexibility. Unlike standard indicators that lock you into a single calculation method, this strategy serves as a "Universal Adapter," allowing you to **Mix & Match 13 different Moving Average types** for both the Fast and Slow trend lines independently.
Whether you need the smoothness of T3, the responsiveness of HMA, or the classic reliability of SMA, this script enables you to backtest thousands of combinations to find the perfect edge for your specific asset class.
---
🔬 Deep Dive: Calculation Logic of Included MAs
This strategy includes 13 distinct calculation methods. Understanding the math behind them will help you choose the right tool for your specific market conditions.
#### 1. Standard Averages
* **SMA (Simple Moving Average):** The unweighted mean of the previous $n$ data points.
* *Logic:* Treats every price point in the period with equal importance. Good for identifying long-term macro trends but reacts slowly to recent volatility.
* **WMA (Weighted Moving Average):** A linear weighted average.
* *Logic:* Assigns heavier weight to current data linearly (e.g., $1, 2, 3... n$). It reacts faster than SMA but is still relatively smooth.
* **SWMA (Symmetrically Weighted Moving Average):**
* *Logic:* Uses a fixed-length window (usually 4 bars) with symmetrical weights $ $. It prioritizes the center of the recent data window.
#### 2. Exponential & Lag-Reducing Averages
* **EMA (Exponential Moving Average):**
* *Logic:* Applies an exponential decay weighting factor. Recent prices have significantly more impact on the average than older prices, reducing lag compared to SMA.
* **RMA (Running Moving Average):** Also known as Wilder's Smoothing (used in RSI).
* *Logic:* It is essentially an EMA but with a slower alpha weight of $1/length$. It provides a very smooth, stable line that filters out noise effectively.
* **DEMA (Double Exponential Moving Average):**
* *Logic:* Calculated as $2 \times EMA - EMA(EMA)$. By subtracting the "lag" (the smoothed EMA) from the original EMA, DEMA provides a much faster reaction to price changes with less noise than a standard EMA.
* **TEMA (Triple Exponential Moving Average):**
* *Logic:* Calculated as $3 \times EMA - 3 \times EMA(EMA) + EMA(EMA(EMA))$. This effectively eliminates the lag inherent in single and double EMAs, making it an extremely fast-tracking indicator for scalping.
#### 3. Advanced & Adaptive Averages
* **HMA (Hull Moving Average):**
* *Logic:* A composite formula involving Weighted Moving Averages: ASX:WMA (2 \times Integer(n/2)) - WMA(n)$. The result is then smoothed by a $\sqrt{n}$ WMA.
* *Effect:* It eliminates lag almost entirely while managing to improve curve smoothness, solving the traditional trade-off between speed and noise.
* **ZLEMA (Zero Lag Exponential Moving Average):**
* *Logic:* This calculation attempts to remove lag by modifying the data source before smoothing. It calculates a "lag" value $(length-1)/2$ and applies an EMA to the data: $Source + (Source - Source )$. This creates a projection effect that tracks price tightly.
* **T3 (Tillson T3 Moving Average):**
* *Logic:* A complex smoothing technique that runs an EMA through a filter multiple times using a "Volume Factor" (set to 0.7 in this script).
* *Effect:* It produces a curve that is incredibly smooth and free of "overshoot," making it excellent for filtering out market chop.
* **ALMA (Arnaud Legoux Moving Average):**
* *Logic:* Uses a Gaussian distribution (bell curve) to assign weights. It allows the user to offset the moving average (moving the peak of the weight) to align it perfectly with the price, balancing smoothness and responsiveness.
* **LSMA (Least Squares Moving Average):**
* *Logic:* Calculates the endpoint of a Linear Regression line for the lookback period. It essentially guesses where the price "should" be based on the best-fit line of the recent trend.
* **VWMA (Volume Weighted Moving Average):**
* *Logic:* Weights the closing price by the volume of that bar.
* *Effect:* Prices on high volume days pull the MA harder than prices on low volume days. This is excellent for validating true trend strength (i.e., a breakout on high volume will move the VWMA significantly).
---
### 🛠 Features & Settings
* **Universal Switching:** Change the `Fast MA` and `Slow MA` types instantly via the settings menu.
* **Trend Cloud:** A dynamic background fill (Green/Red) highlights the crossover zone for immediate visual trend identification.
* **Strategy Mode:** Built-in Backtesting logic triggers `LONG` entries when Fast MA crosses over Slow MA, and `EXIT` when Fast MA crosses under.
### ⚠️ Disclaimer
This script is intended for educational and research purposes. The wide variety of MA combinations can produce vastly different results. Past performance is not indicative of future results. Please use proper risk management.

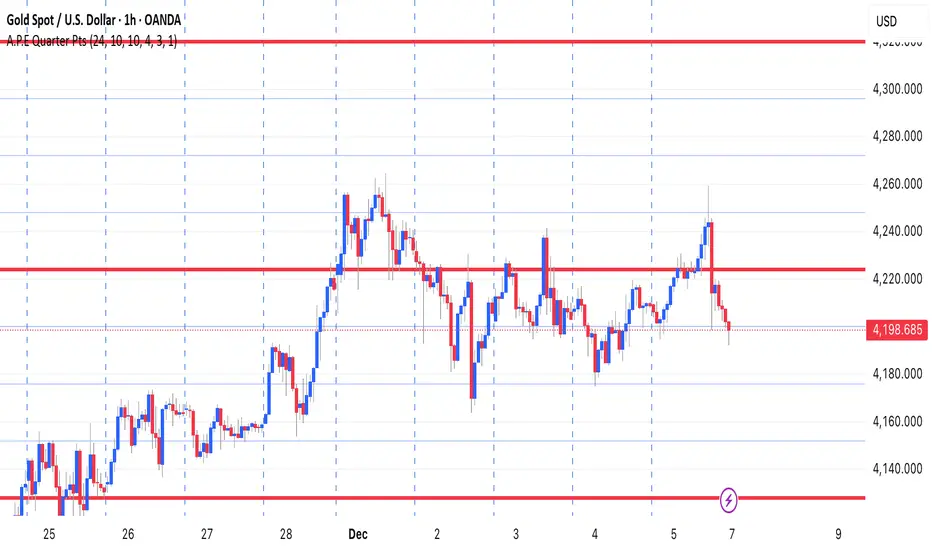
A.P.E Quarter PtsThis indicator draws a set of straight horizontal price levels on your chart.
Each line is spaced evenly apart at a distance you choose — these are called quarter-points.
As price moves, the grid of lines stays centered around the current price, so you always see the nearest support and resistance levels. The lines above price show possible resistance, and the lines below price show possible support.
Some of the lines can be drawn thicker or in a stronger color to show more important levels.
Overall, the indicator gives you a clean, easy-to-read structure of evenly spaced levels that help you see where price may react, stall, bounce, or reverse.