VB-MainLiteVB-MainLite – v1.0 Initial Release
Overview
VB-MainLite is a consolidated market-structure and execution framework designed to streamline decision-making into a single chart-level view. The script combines multi-timeframe trend, volatility, volume, and liquidity signals into one cohesive visual layer, reducing indicator clutter while preserving depth of information for active traders.
Core Architecture
Trend Backbone – EMA 200
Dedicated EMA 200 acts as the primary trend filter and higher-timeframe bias reference.
Serves as the “spine” of the system for contextualizing all secondary signals (swings, reversals, volume events, etc.).
Custom MA Suite (Envelope Ready)
Four configurable moving averages with flexible source, length, and smoothing.
Default configuration (preset idea: “8/89 Envelope”):
MA #1: EMA 8 on high
MA #2: EMA 8 on low
MA #3: EMA 89 on high
MA #4: EMA 89 on low
All four are disabled by default to keep the chart minimal. Users can toggle them on from the Custom MAs group for envelope or cloud-style configurations.
Nadaraya–Watson Smoother (Swing Framework)
Gaussian-kernel Nadaraya–Watson regression applied to price (hl2) to build a smooth synthetic curve.
Two layers of functionality:
Swing labels (▲ / ▼) at inflection points in the smoothed curve.
Optional curve line that visually tracks the turning structure over the last ~500 bars.
Designed to surface early swing potential before standard MAs react.
Hull Moving Average (Trend Overlay)
Optional Hull MA (HMA) for faster trend visualization.
Color-coded by slope (buy/sell bias).
Default: off to prevent overloading the chart; can be enabled under Hull MA settings.
Momentum, Exhaustion & Pattern Engine
CCI-Based Bar Coloring
CCI applied to close with configurable thresholds.
Overbought / oversold CCI zones map directly into candle coloring to visually highlight short-term momentum extremes.
RSI Top / Bottom Exhaustion Finder
RSI logic applied separately to high-driven (tops) and low-driven (bottoms) sequences.
Plots:
Top arrows where high-side RSI stretches into high-risk territory.
Bottom arrows where low-side RSI indicates exhaustion on the downside.
Useful as confluence around the Nadaraya swing turns and EMA 200 regime.
Engulfing + MA Trend Engine (“Fat Bull / Fat Bear”)
Detects bullish and bearish engulfing patterns, then combines them with MA trend cross logic.
Only when both pattern and MA regime align does the engine flag:
Fat Bull (Engulf + MA aligned long)
Fat Bear (Engulf + MA aligned short)
Candles are marked via conditional barcolor to highlight strong, structured shifts in control.
Fat Finger Detection (Wick Spikes / Stop Runs)
Identifies abnormal wick extensions relative to the prior bar’s body range with configurable tolerance.
Supports detection of potential liquidity grabs, stop runs, or “excess” that may precede reversals or mean-reversion behavior.
Volume & Liquidity Intelligence
Bull Snort (Aggressive Buy Spikes)
Flags events where:
Volume is significantly above the 50-period average, and
Price closes in the upper portion of the bar and above prior close.
Plots a labeled marker below the bar to indicate aggressive upside initiative by buyers.
Pocket Pivots (Accumulation Flags)
Compares current volume vs prior 10 sessions with a filter on prior “up” days.
Highlights pocket pivot days where current green candle volume outclasses recent down-day volumes, suggesting stealth accumulation.
Delta Volume Core (Directional Volume by Price)
Internal volume-by-price style engine over a user-defined lookback.
Splits volume into up-close and down-close buckets across dynamic price bins.
Feeds into S&R and ICT zone logic to quantify where buying vs selling pressure built up.
Structural Context: S&R and ICT Zones
S&R Power Channel
Computes local high/low band over a configurable lookback window.
Renders:
Upper and lower S&R channel lines.
Shaded support / resistance zones using boxes.
Adds Buy Power / Sell Power metrics based on the ratio of up vs down bars inside the window, displayed directly in the zone overlays.
Drops ◈ markers where price interacts dynamically with the top or bottom band, highlighting reaction points.
ICT-Style Premium / Discount & Macro Zones
Two tiered structures:
Local Premium / Discount zones over a shorter SR window.
Macro Premium / Discount zones over a longer macro window.
Each zone:
Uses underlying directional volume to annotate accumulation vs distribution bias.
Provides Delta Volume Bias shading in the mid-band region, visually encoding whether local power flows are net-buying or net-selling.
Enables traders to quickly see whether current trade location is in a local/macro discount or premium context while still respecting volume profile.
Positioning Intelligence: PCD (Stocks)
Position Cost Distribution (PCD) – Stocks Only
Available for stock symbols on intraday up to daily timeframe (≤ 1D).
Uses:
TOTAL_SHARES_OUTSTANDING fundamentals,
Daily OHLCV snapshot, and
A bucketed distribution engine
to approximate cost basis distribution across price.
Outputs:
Horizontal “PCD bars” to the right of current price, density-scaled by estimated share concentration.
Color-coding by profitability relative to current price (profitable vs unprofitable positions).
Labels for:
Current price
Average cost
Profit ratio (share % below current price)
90% cost range
70% cost range
Range overlap as a measure of clustering / concentration.
Multi-Timeframe Trend: Two-Pole Gaussian Dashboard
Two-Pole Gaussian Filter (Line + Cloud)
Smooths a user-selected source (default: close) using a two-pole Gaussian filter with tunable alpha.
Plots:
A thin Gaussian trend line, and
A thick Gaussian “cloud” line with transparency, colored by slope vs past (offsetG).
Functions as a responsive trend backbone that is more sensitive than EMA 200 but less noisy than raw price.
Multi-Timeframe Gaussian Dashboard
Evaluates Gaussian trend direction across up to six timeframes (e.g., 1H / 2H / 4H / Daily / Weekly).
Renders a compact bottom-right table:
Header: symbol + overall bias arrow (up / down) based on average trend alignment.
Row of colored cells per timeframe (green for uptrend, magenta for downtrend) with human-readable TF labels (e.g., “60M”, “4H”, “1D”).
Gives an immediate read on whether intraday, swing, and higher-timeframe flows are aligned or fragmented.
Default Configuration & Usage Guidance
Default state after adding the script:
Enabled by default:
EMA 200 trend backbone
Nadaraya–Watson swing labels and curve
CCI bar coloring
RSI top/bottom arrows
Fat Bull / Fat Bear engine
Bull Snort & Pocket Pivots
S&R Power Channel
ICT Local + Macro zones
Two-pole Gaussian line + cloud + dashboard
PCD engine for stocks (auto-active where data is available)
Disabled by default (opt-in):
Custom MA suite (4x MAs, preset as EMA 8/8/89/89)
Hull MA overlay
How traders can use VB-MainLite in practice:
Use EMA 200 + Gaussian dashboard to define top-down directional bias and avoid trading directly against multi-TF trend.
Use Nadaraya swing labels, RSI exhaustion arrows, and CCI bar colors to time entries within that higher-timeframe bias.
Use Fat Bull / Fat Bear events as structured confirmation that both pattern and MA regime have flipped in the same direction.
Use Bull Snort, Pocket Pivots, and S&R / ICT zones to align execution with liquidity, volume, and location (premium vs discount).
On stocks, use PCD as a positioning map to understand trapped supply, support zones near crowded cost basis, and where profit-taking is likely.
Indicadores e estratégias

BTC / XAU Calculator/Hesaplayıcı
USER GUIDE
BTC/XAU Calculator is a table-based indicator that displays Bitcoin price, Gold price (XAU/USD), and the BTC/XAU ratio simultaneously. It pulls real-time market data and calculates values based on your manual inputs.
⸻
Features
• Automatically fetches live BTCUSD and XAUUSD prices.
• Supports two-way manual calculations:
• BTC price → Ratio calculation
• Ratio → BTC price calculation
• Clear table layout showing Market vs Calculated values.
• Compatible with Binance, OANDA, and all brokers.
⸻
1. Settings
Gold Price (XAU/USD)
• When “Use live XAU price” is enabled, the indicator uses real-time XAU/USD.
• If disabled, you can enter your own gold price manually.
⸻
2. Calculation Modes
A) Calculate BTC from Ratio
BTC = Ratio × Gold price
Example:
XAU = 4200
Ratio = 19.08
→ BTC = 4200 × 19.08 = 80,136 USD
⸻
B) Calculate Ratio from BTC
Ratio = BTC price ÷ Gold price
Example:
BTC = 90,000
XAU = 4250
→ Ratio = 90,000 / 4,250 = 21.18
3. Suggested Uses
• Evaluate BTC as cheap/expensive relative to gold
• BTC target projections based on gold
• Macro hedge and correlation analysis
• BTC/XAU ratio-based scenario modeling
⸻
Notes
• This indicator does not generate trading signals.
• It is intended for numerical comparison and scenario building only.
Source: The design and calculation logic of this indicator were created in collaboration with OpenAI’s ChatGPT model.

Custom MTF VWAP 5x This is a combination of all VWAPs I use to find high probability trade setups and targets by only taking trades when different VWAPs align


MA Groups with ShiftsThis indicator plots up to five groups of moving averages of user-selectable types. Each group consists of a base moving average and its 5- and 10-period shifted values.
The purpose of this indicator is to gauge the strength of the trend.

Impulse Trend Suite (LITE) — v1.2🚀 Impulse Trend Suite (LITE) — v1.2
Smart trend visualization with precise flip arrows. A lightweight, momentum-filtered trend tool designed to stay clean, avoid repeated signals, and keep you focused only on real market direction.
✨ What’s New in v1.2
Minor upgrades mostly visual
Higher-contrast trend zones (green/red/neutral)
Larger BUY/SELL arrows + clearer labels
Clean, smoother ATR channel lines (improved)
Minor UI polishing to reduce chart noise
📌 Core Features
Trend flip arrows (no spam, 1 signal per turn)
Continuous background zones (gap-free trend shading)
Adaptive Baseline + ATR structure channel
RSI + MACD momentum filter (suppresses weak signals)
Trend Status Panel (UP, DOWN, NEUTRAL)
🔍 Quick Guide
BUY setup = green arrow + green background
SELL setup = red arrow + red background
Stay in the move while color doesn’t change
ATR channel helps avoid chasing overextended candles
🆚 LITE vs PRO
Feature LITE PRO
--------------------- -------- ------------------------------
Trend shading + arrows ✔ ✔ + confirmations
Neutral trend state ✔ ✔ enhanced
Alerts ✖ ✔ full suite
Reversal Zones ✖ ✔ predictive boxes
HTF Filter ✖ ✔ smarter trend bias
Included strategies ✖ ✔ + PDF training
========================================================
🔓 Upgrade to PRO
Reversal Zones • Alerts • HTF Filter • Trend Continuation Strategy
👉 fxsharerobots.com/impulse-trend-pro/
📈 Works on Forex, Stocks, Crypto, Indices, Metals
⌚ Scalping • Intraday • Swing • Long-term
==========================================================
⚠️ LITE - Educational tool. Backtest before trading live.
Visit us for Full Trading Tools Collection here:
www.fxsharerobots.com
Happy trading! — FxShareRobots Team

MTF Stoch RSI + RSI Signalsthis script will provide Buy and sell signals considering RSI and price action

GOD MODE HUNT v2.0 — SCREENER ULTIME 2025test screener pour détecter les crypto basée sur des règles strict

Daily High/Low/50%Daily High/Low/50% Levels Indicator
This Pine Script v6 indicator displays three horizontal lines from the previous daily candle:
High: The highest price of the last daily candle
Low: The lowest price of the last daily candle
50%: The midpoint between high and low
Key Features:
Lines extend from one daily candle to the next (Monday to Tuesday, Tuesday to Wednesday, etc.)
Fully customizable styling for each line independently:
Color selection
Line style (Solid, Dashed, Dotted)
Line width/thickness
Small labels ("H", "L", "50%") mark the start of each new day
Works on any timeframe (intraday charts show daily levels as reference)
Use Case:
Perfect for intraday traders who want to see the previous day's key levels as support/resistance zones. The 50% level often acts as a pivot point for price action.

Volume essential parameters overlayVolume EPO – Essential Volume Parameters Overlay
1. Motivation and design philosophy
Volume EPO is designed as a conceptual overlay rather than a self contained trading system. The main idea behind this script is to take complex, foundational market concepts out of heavy, menu driven strategies and express them as lightweight, independent layers that sit on top of any chart or indicator.
In many TradingView scripts, a single strategy tries to handle everything at once: signal logic, risk settings, visual cues, multi timeframe controls, and conceptual explanations. This usually leads to long input menus, performance issues, and difficult maintenance. The architectural approach behind Volume EPO is the opposite: keep the core strategy lean, and move the explanation and measurement of key concepts into dedicated overlays.
In this framework, Volume EPO is the base layer for the concept of volume. It does not decide anything about entries or exits. Instead, it exposes and clarifies how different definitions of volume behave candle by candle. Other layers or strategies can then build on top of this understanding.
2. What Volume EPO does
Volume EPO focuses on four essential volume parameters for each bar:
- Buy volume - Sell volume - Total volume - Delta volume (the difference between buy and sell volume)
The script presents these parameters in a compact heads up display (HUD) table that can be positioned anywhere on the chart. It is designed to be visually minimal, language aware, and usable on top of any other indicator or price action without cluttering the view.
The indicator does not output signals, alerts, arrows, or strategy entries. It is a descriptive and educational tool that shows how volume is distributed, not a prescriptive tool that tells the trader what to do.
3. Two definitions of volume
A central theme of this script is that there is more than one way to define and interpret “volume” inside a single candle. Volume EPO implements and clearly separates two different approaches:
- A geometric, candle based approximation that uses only OHLC and volume of the current bar. - An intrabar, data driven definition that uses lower timeframe up and down volume when it is available.
The user can switch between these modes via the calculation method input. The mode is prominently shown inside the on chart table so that the context is always explicit.
3.1 Geometry mode (Source File, approximate)
In Geometry mode, Volume EPO works only with the current bar’s OHLC values and total volume. No lower timeframe data is required.
The candle’s range is defined as high minus low. If the range is positive, the position of the close inside that range is used as a simple model for how volume might have been distributed between buyers and sellers:
- The closer the close is to the high, the more of the total volume is attributed to the buying side. - The closer the close is to the low, the more of the total volume is attributed to the selling side. - In a rare case where the bar has no price range (for example a flat or doji bar), total volume is split evenly between buy and sell volume.
From this model, the script derives:
- Buy volume (approximated) - Sell volume (approximated) - Total volume (as reported by the bar) - Delta volume as the difference between buy and sell volume
This approach is intentionally labeled as “Geometry (Approx)” in the HUD. It is a theoretical reconstruction based solely on the candle’s geometry and total volume, and it is always available on any market or timeframe that provides OHLCV data.
3.2 Intrabar mode (Precise)
In Intrabar mode, Volume EPO uses the TradingView built in library for up and down volume on a user selected lower timeframe. Instead of inferring volume from the shape of the candle, it reads the underlying lower timeframe data when that data is accessible.
The script requests up and down volume from a lower timeframe such as 15 seconds, using the official TA library functions. The results are then interpreted as follows:
- Buy volume is taken as the absolute value of the up volume. - Sell volume is taken as the absolute value of the down volume. - Total volume is the sum of buy and sell volume. - Delta volume is provided directly by the library as the difference between up and down volume.
If valid lower timeframe data exists for a bar, the bar is counted as covered by Intrabar data. If not, that bar is marked as invalid for this precise calculation and is excluded from the covered count.
This mode is labeled “Precise” in the HUD, together with the selected lower timeframe, because it is anchored in actual intrabar data rather than in a geometric model. It provides a closer view of how buying and selling pressure unfolded inside the bar, at the cost of requiring more data and being dependent on the availability of that data.
4. Coverage, lookback, and what the numbers mean
The top part of the HUD reports not only which volume definition is active, but also an additional line that describes the effective coverage of the data.
In Intrabar (Precise) mode, the script displays:
- “Scanned: N Bars”
Here, N counts how many bars since the indicator was loaded have successfully received valid lower timeframe delta data. It is a measure of how much of the visible history has been truly covered by intrabar information, not a lookback window in the sense of a rolling calculation.
In Geometry mode, the script displays:
- “Lookback: L Bars”
In this extracted layer, the lookback value L is purely descriptive. It does not change how the current bar’s volume is computed, and it is not used in any iterative or statistical calculation inside this script. It is meant as a conceptual label, for example to keep the volume layer consistent with a broader framework where lookback length is a structural parameter.
Summarizing these two fields:
- Scanned tells you how many bars have been processed using real intrabar data. - Lookback is a descriptive parameter in Geometry mode in this specific overlay, not a direct driver of the computations.
5. The HUD layout on the chart
The on chart table is intentionally compact and structured to be read quickly:
- Header: a title identifying the overlay as Volume EPO. - Mode line: explicitly states whether the script is in Precise or Geometry mode, and for Precise mode also shows the lower timeframe used. - Coverage line: - In Precise mode, it shows “Scanned: N Bars”. - In Geometry mode, it shows “Lookback: L Bars”. - Volume block: - A line for buy and sell volume, marked with clear directional symbols. - A line for total volume and the absolute delta, accompanied by the sign of the delta. - Numeric formatting uses human friendly suffixes (for example K, M, B) to keep the display readable. - Footer: the current symbol and a time stamp, adjusted by a user selectable timezone offset so that the HUD can be aligned with the trader’s local time reference.
The table can be positioned anywhere on the chart and resized via inputs, and it supports multiple color themes and languages in order to integrate cleanly into different chart layouts.
6. How to use Volume EPO in practice
Volume EPO is meant to be read together with price action and other tools, not in isolation. Typical uses include:
- Studying how often a strong directional candle is actually supported by dominant buy or sell volume. - Comparing the behavior of delta volume between Geometry and Intrabar definitions. - Building a personal intuition for how intrabar data refines or contradicts the simple candle based approximation. - Feeding these insights into separate, lean strategy scripts that do not need to carry the full explanatory logic of volume inside them.
Because it is an overlay layer, Volume EPO can be stacked with other custom indicators without adding new signals or complexity to their logic. It simply adds a clear and consistent view of volume behavior on top of whatever the trader is already watching.
7. Educational and non signalling nature
Finally, it is important to stress that Volume EPO is not a trading system, not a signal generator, and not financial advice. The script does not tell the user when to enter or exit. It only reports how different definitions of volume describe the current bar.
Deciding whether to trade, how to trade, and which risk parameters to use remains entirely with the user and with their own strategy. Volume EPO provides context and clarity around the concept of volume so that those decisions can be informed by a better understanding of how buying and selling pressure is structured inside each candle.
Note: Even on lower timeframes, every reconstruction of volume remains an approximation, except at the true single tick level. However, the closer the chosen lower timeframe is to a one tick stream, the more accurately it can reflect the underlying order flow and balance between buying and selling pressure.

MA Strength Indicator EnhancedThe "MA Strength" is an indicator that measures market trend strength or (in the case of forex pairs) the relative strength of individual currencies based on up to five different moving averages (MA). It offers multiple calculation methods, such as simple summation, normalized value, or measuring ATR/percentage distance from the price. The results are summarized in a clear table, and it provides customizable alerts for trend changes or shifts in currency strength. The high level of configurability (e.g., MA weighting, "all MA alignment" requirement) allows for fine-tuning the strategy.
💬 Interpreting the Table (Top Rows)
The top row of the table shows the final output of the indicator. This changes according to the set "Table Mode".
Trend Mode: The top row shows the final, aggregated trend status (e.g., "BULLISH", "NEUTRAL") and the corresponding "Trend Value". This is the value the indicator compares to its thresholds.
Forex Mode: (Only on 6-character pairs): The top two rows show the strength of the Base currency and the Quote currency separately.
Calculation of the top rows:
The indicator calculates the individual score of all active MAs (according to the chosen method).
Trend Value: This is the final value calculated from the scores.
If "Enable Averaging" is ON, this will be the average of the scores (e.g., MA1 score is 5.0, MA2 score is 7.0 -> Trend Value is 6.0).
If averaging is OFF, this will be the sum of the scores (e.g., 5.0 + 7.0 = 12.0).
Forex Calculation: "Forex Mode" uses this "Trend Value". If the Trend Value is +6.0 (on an EURUSD pair):
The Base currency (EUR) value will be +6.0.
The Quote currency (USD) value will be -6.0.
The indicator compares these values to the thresholds to determine the "STRONG" status for EUR and "WEAK" status for USD.
📊 Calculation Methods
The indicator can calculate trend strength using 5 methods. The final "Trend Value" is derived from the results of these calculations.
Sum:
Description: Simply adds up the individual scores of all enabled moving averages (MA).
Formula: If the price is above an MA, it gets the "Score Above" value (e.g., +2.0); if below, it gets the "Score Below" value (e.g., -2.0).
Example: Result = (MA1 score) + (MA2 score) + ...
Normalized:
Description: Takes the sum obtained by the "Sum" method and converts it to a scale between -100% (maximally bearish) and +100% (maximally bullish). It takes into account the maximum possible positive and negative scores.
Formula: Result = (Total Score / Max Possible Score) * 100
Percentage Distance:
Description: This method also considers distance. The further the price is from the MA in percentage terms, the higher the score.
Formula: MA Score = (|Close Price - MA| / MA * 100) * Weight (The "Weight" is the "Score Above/Below" value set in settings).
ATR Distance:
Description: Similar to percentage distance, but normalizes the distance using volatility via ATR (Average True Range).
Formula: MA Score = (|Close Price - MA| / ATR) * Weight
Candle Count:
Description: Counts how many consecutive candles have been above or below the MA. It multiplies this number by the set weight.
Formula: MA Score = (Number of consecutive candles) * Weight
⚙️ Settings Options
Moving Averages (MA 1-5)
For each moving average, you can set:
Enable MA: Turn the specific MA on or off.
Type: The type of moving average (SMA, EMA, WMA, etc.).
Period: The period of the MA (e.g., 50, 200).
Score Above / Below: The most important setting. This defines the "weight" of the MA in the calculation. In "Sum" mode, this is a fixed score; in distance-based modes, this is a multiplier (weight). It is advisable to write a positive number for "Score Above" and a negative number for "Score Below".
Calculation Settings
Enable Averaging: If this is on, the indicator shows the average of the active MA scores, not the total score.
Exception: This function is not available in "Normalized" mode.
Require All MA Alignment: This is a strict filter. If enabled, the indicator only gives a "BULLISH" (or "STRONG") signal if the price is above all enabled moving averages. Similarly, a "BEARISH" signal only occurs if the price is below all moving averages. If the price is on the opposite side of even just one MA (e.g., above 4, below 1), the status becomes "NEUTRAL", regardless of the scores.
Strength / Trend Thresholds
Enable Extra Levels: If active, statuses are expanded: "EXT. BULLISH" / "EXT. BEARISH" (Trend mode) or "EXT. STRONG" / "EXT. WEAK" (Forex mode). This indicates stronger, overbought/oversold conditions.
Threshold setting: The thresholds (e.g., "Strong Above - ATR") determine when the calculated value counts as a "STRONG" or "WEAK" status.
🔢 Setting Thresholds via Calculation
If "Enable Averaging" is OFF, the "Trend Value" shown in the table will be the sum of the individual MA scores. Therefore, we must define the threshold by adding up the minimum expected performance from each moving average. This allows us to set different expectations for short, medium, and long-term averages.
Step 1: Determine MA weights
In our example, we use 3 active MAs with the following weights (Score Above values):
MA1 (Short): Weight = +2
MA2 (Medium): Weight = +3
MA3 (Long): Weight = +4
Step 2: Determine the minimum expected distance
Define a minimum distance expected from each MA to trigger a "Strong" signal.
Step 3: Calculate target scores and the final threshold
Note: If "Enable Averaging" is ON, the resulting value (sum of target scores) must be
averaged to get the final threshold.
Example 1: ATR Distance
-Goal: I want a "Strong" signal if the price is...
...at least 1.0 ATR above MA1 (Short),
...at least 1.5 ATR above MA2 (Medium),
...and at least 2.0 ATR above MA3 (Long).
-Calculation (Expected Distance * Weight):
MA1 Target Score: 1.0 * 2 = 2.0
MA2 Target Score: 1.5 * 3 = 4.5
MA3 Target Score: 2.0 * 4 = 8.0
-Final Threshold (Sum of Target Scores): 2.0 + 4.5 + 8.0 = 14.5
-Setting: Set "Strong Above - ATR" threshold to 14.5.
If "Enable Averaging" is ON, the obtained value must be averaged, and the result will be the
threshold: 4.8 (14.5 / 3 = 4.83).
Example 2: Percentage Distance
-Goal: I want a "Strong" signal if the price is...
...at least 0.5% above MA1,
...at least 1.0% above MA2,
...and at least 1.5% above MA3.
-Calculation (Expected Distance * Weight):
MA1 Target Score: 0.5 * 2.0 = 1.0
MA2 Target Score: 1.0 * 3.0 = 3.0
MA3 Target Score: 1.5 * 4.0 = 6.0
-Final Threshold (Sum): 1.0 + 3.0 + 6.0 = 10.0
-Setting: Set "Strong Above - Percentage" threshold to 10.0.
If "Enable Averaging" is ON, the obtained value must be averaged, and the result will be the
threshold.
Example 3: Candle Count
-Goal: I want a "Strong" signal if...
...at least 3 consecutive candles are above MA1,
...at least 5 consecutive candles are above MA2,
...and at least 10 consecutive candles are above MA3.
-Calculation (Expected Candle Count * Weight):
MA1 Target Score: 3 * 2.0 = 6.0
MA2 Target Score: 5 * 3.0 = 15.0
MA3 Target Score: 10 * 4.0 = 40.0
-Final Threshold (Sum): 6.0 + 15.0 + 40.0 = 61.0
-Setting: Set "Strong Above - Candle" threshold to 61.0.
If "Enable Averaging" is ON, the obtained value must be averaged, and the result will be the
threshold.
Example 4: Sum
In this mode, distance does not matter, only whether the price is above or below the MA.
-Goal: "Strong" signal if the price is above the long-term averages, but can be below the short-term (MA1).
MA1 (Short): Can be below (Weight: -2.0)
MA2 (Medium): Must be above (Weight: +3.0)
MA3 (Long): Must be above (Weight: +4.0)
-Calculation: -2.0 + 3.0 + 4.0 = 5.0
-Setting: Set "Strong Above - Sum" threshold to 5.0.
If it must be above all three moving averages, the threshold would be 2.0 + 3.0 + 4.0 = 9.0.
If "Enable Averaging" is ON, the obtained value must be averaged, and the result will be the
threshold.
Example 5: Normalized
The basic logic is similar to the "Sum" method.
-Goal: "Strong" signal if price is above MA2 and MA3, but potentially below MA1.
-Calculation: Target Sum: 5.0. Max Possible Score (above all): 9.0.
-Threshold: (5.0 / 9.0) * 100 = 55.5
In this calculation method, averaging cannot be set.
The Usage of the "ATR %" Row
The "ATR %" row shows the percentage movement of an average candle.
How to use this with "Percentage Distance" mode:
This number gives a baseline. It helps decide if the "Percentage Distance" threshold is realistic.
Example: You see the "ATR %" value is hovering around 1.2%. This means a "normal" candle moves about 1.2%.
If you set the Percentage threshold to 0.5%, it is too low. The indicator will constantly give a "Strong" signal because even average movement (noise) exceeds the threshold.
Correct Usage: If "normal" movement is 1.2%, then a "strong" movement (trend) needs to be significantly larger. For example, set the threshold to double the ATR %: 2.4 (2 * 1.2). Thus, you only get a "Strong" signal if the movement is twice the average volatility.
Supplementary Information
Rounding Differences:
The numbers displayed in the table and the precision of calculations in the background differ.
Table Display: The indicator rounds numbers to two decimal places in the table. So, if the value is 0.996, the table shows 1.00 (rounded up).
Internal Calculation: The background calculation uses much higher precision. When determining status (STRONG vs NEUTRAL), the program compares the precise, unrounded value to the threshold.
Result: Due to rounding, it may happen that if the threshold is 1.00 and the table shows 1.00, the status flickers between Strong and Neutral. If this is bothersome, it is advisable to set a slightly lower threshold (e.g., 0.98).
🔔 Alert Settings
The indicator can send alerts when the status changes.
Alert Method:
Trend: Alerts when the main trend status changes (e.g., from "NEUTRAL" to "BULLISH"). You can specify which direction to alert for (e.g., only "BULLISH").
Forex: Works only on 6-character forex pairs. You can set separate alerts for the Base or Quote currency.
Forex Strength Level: You can specify at which status level to alert (e.g., "WEAK" or "EXT. STRONG").
📈 Trading Tips
Trend Confirmation: Use the "BULLISH" / "BEARISH" status to confirm your existing strategy (e.g., breakouts, bounces off support).
Forex Pairing: In Forex mode, look for pairs where the Base currency is "STRONG" and the Quote currency is "WEAK" (or "EXT. STRONG" / "EXT. WEAK") for a long position.
Short Position: Reverse the above (Base: WEAK, Quote: STRONG).

EMA Market Structure [BOSWaves]EMA Market Structure - Trend-Driven Structural Mapping with Adaptive Swing Detection
Overview
The EMA Market Structure indicator provides an advanced framework for visualizing market structure through dynamically filtered trend and swing analysis.
Unlike conventional EMA overlays, which merely indicate average price direction, this model integrates trend acceleration, swing highs/lows, and break-of-structure (BOS) logic into a unified, visually intuitive display.
Each element adapts in real time to price movement, offering traders a living map of support, resistance, and trend bias that reacts fluidly to market momentum.
The result is a comprehensive, trend-aware representation of price structure.
EMA slope and acceleration guide trend perception, while swing points identify key inflection zones.
Breaks of prior highs or lows are highlighted with visual BOS labels and stop-loss projections, giving traders actionable context for continuation or reversal setups.
Unlike static lines or simple moving averages, the EMA Market Structure indicator fuses dynamic trend analysis with structural awareness to provide a clear picture of market bias and potential turning points.
Theoretical Foundation
The EMA Market Structure builds on principles of momentum filtering and structural analysis.
Standard moving averages track average price but ignore acceleration and context; this indicator captures both the directional slope of the EMA and its rate of change, providing a proxy for trend strength.
Simultaneously, swing detection identifies statistically significant highs and lows, while BOS logic flags decisive breaks in structure, aligned with trend direction.
At its core are three interacting components:
EMA Trend & Acceleration : Smooths price data while highlighting acceleration changes, producing gradient-driven color cues for trend momentum.
Swing Detection Engine : Identifies swing highs and lows over configurable bar lengths, ensuring key turning points are captured with minimal clutter.
Break-of-Structure Logic : Detects price breaches of previous swings and aligns them with EMA trend for actionable BOS signals, including projected stop-loss levels for tactical decision-making.
By integrating these elements, the system scales effectively across timeframes and assets, maintaining structural clarity while visualizing trend dynamics in real time. Traders receive both macro and micro perspectives of market movement, with clear cues for trend continuation or reversal.
How It Works
The EMA Market Structure indicator operates through layered processing stages:
EMA Slope & Acceleration : Calculates the EMA and its rate of change, normalizing via ATR and a smoothing function to produce gradient color coding. This allows instant visual identification of bullish or bearish momentum.
Swing Identification : Swing highs and lows are computed using configurable left/right bar lengths, filtered through a cool-off mechanism to prevent redundant signals and maintain chart clarity.
Structural Lines & Zones : Swing points are connected with lines, and shaded zones are drawn between successive highs/lows to highlight key support and resistance regions.
Break-of-Structure Detection : BOS events occur when price breaches a prior swing in alignment with the EMA trend. Bullish and bearish BOS signals include enhanced label effects and projected stop-loss lines and zones, providing immediate tactical reference.
Dynamic Background Mapping : The chart background adapts to EMA trend direction, reinforcing trend context with subtle visual cues.
Through these processes, the indicator creates a living, adaptive map of market structure that reflects both trend strength and swing-based inflection points.
Interpretation
The EMA Market Structure reframes market reading from simple trend following to structured awareness of price behavior:
Uptrend Phases : EMA is rising with positive acceleration, swings confirm higher lows, and BOS events occur above prior highs, signaling trend continuation.
Downtrend Phases : EMA slope is negative, swings form lower highs, and BOS events occur below prior lows, confirming bearish bias.
Trend Reversals : Flat or decelerating EMA with BOS failures may indicate impending structural change.
Critical Zones : Swing-based lines and shaded zones highlight areas where price may pause, reverse, or accelerate, providing high-probability decision points.
Visually, EMA color gradients, structural lines, and BOS labels combine to provide both statistical trend confirmation and actionable structural cues.
Strategy Integration
EMA Market Structure integrates seamlessly into trend-following and swing-based trading systems:
Trend Alignment : Confirm higher-timeframe EMA slope before entering continuation trades.
BOS Entry Triggers : Use BOS events aligned with EMA trend for tactical entries and stop placement.
Support/Resistance Mapping : Swing lines and zones help define areas for scaling, exits, or reversals.
Volatility Context : ATR-based smoothing and stop-loss buffers accommodate varying market volatility, ensuring robustness across conditions.
Multi-Timeframe Coordination : Combine higher-timeframe EMA trend and swings with lower-timeframe structural events for precision entries.
Technical Implementation Details
Core Engine : EMA slope and ATR-normalized acceleration for gradient-driven trend visualization.
Swing Framework : Pivot-based high/low detection with configurable bar lengths and cool-off intervals.
Structural Visualization : Lines, zones, and labels for high-fidelity mapping of support/resistance and BOS events.
BOS Engine : Detects structural breaks aligned with EMA trend, automatically plotting stop-loss lines and visual cues.
Performance Profile : Lightweight, optimized for real-time responsiveness across multiple timeframes.
Optimal Application Parameters
Timeframe Guidance:
1 - 5 min : Ideal for intraday swing spotting and microstructure trend tracking.
15 - 60 min : Medium-range structural analysis and BOS-driven entries.
4H - Daily : Macro trend mapping and key swing-based support/resistance identification.
Suggested Configuration:
EMA Length : 50
Swing Length : 5
Swing Cooloff : 10 bars
BOS Cooloff : 15 bars
SL Buffer : 0.1%
These suggested parameters should be used as a baseline; their effectiveness depends on the asset volatility, liquidity, and preferred entry frequency, so fine-tuning is expected for optimal performance.
Performance Characteristics
High Effectiveness:
Trending markets with defined swings and structural consistency.
Markets where EMA slope and acceleration reliably indicate momentum changes.
Reduced Effectiveness:
Choppy or sideways markets with minimal swing definition.
Random walk assets lacking clear structural anchors.
Integration Guidelines
Confluence Framework : Combine with volume, momentum, or BOSWaves structural indicators
to validate entries.
Directional Control: Follow EMA slope and BOS alignment for high-conviction trades.
Risk Calibration: Use SL projections for disciplined exposure management.
Multi-Timeframe Synergy: Confirm higher-timeframe trend before executing lower-timeframe structural trades.
Disclaimer
The EMA Market Structure is a professional-grade trend and structure visualization tool. It is not predictive or guaranteed profitable; performance depends on parameter tuning, market regime, and disciplined execution. BOSWaves recommends using it as part of a comprehensive analytical stack integrating trend, liquidity, and structural context.

MM Wash Detector (Fool-Proof)MM Wash Detector (Stealth) is a market-structure tool designed to identify wash candles created during liquidity hunts.
These candles typically show unusually long wicks with tiny bodies, signalling where market makers have swept stop-losses before reversing price.
The indicator marks:
Bear Wash → Long bottom wick (stop-hunt down, reversal up)
Bull Wash → Long top wick (stop-hunt up, reversal down)
This helps traders spot manipulation areas, liquidity grabs, and potential reversal zones with simple, discreet chart labels.

V-CORE SMA Matrix LiteV-CORE SMA Matrix Lite
A clean, lightweight 5-SMA structure tool built using Pine Script v6.
This open-source Lite edition provides a simple visual framework for identifying market structure using the most commonly used moving averages:
21 SMA
50 SMA
80 SMA
100 SMA
200 SMA
Each line is individually adjustable and colour-coded for easy trend reading.
No signals, no alerts, no automation — purely a visual tool for traders who prefer clarity over complexity.
This Lite version exposes only basic, non-proprietary logic.
Advanced regime systems, multi-stage confirmation models, and automation features are available only in the full V-CORE Engine suite.
Part of the V-CORE Lite Series
Free open-source tools designed for education, research, and clean charting.
Follow our work:
TradingView: VectorCoresAI
X (Twitter): vectorcoresai
Telegram: vectorcoresai

BankNifty - 2x Nifty Differencedifference between Banknifty near month future - 2x nifty near month future

tgpFibonacciLib_v2Library "tgpFibonacciLib_v2"
getFib(tf, ratio)
Parameters:
tf (string)
ratio (float)
getGoldenPocket(tf)
Parameters:
tf (string)
getMonthlyFib(ratio)
Parameters:
ratio (float)
getWeeklyFib(ratio)
Parameters:
ratio (float)
getYestFib(ratio)
Parameters:
ratio (float)

new alertable spacemanhope these alerts work. open to fixes
slight modification to Key Levels SpacemanBTC IDWM script
credit: spacemanbtc
Humontre Signal Channel — Free EditionHumontre Signal Channel is a clean, high-clarity trend and volatility tool designed to help traders identify directional bias, momentum shifts, and breakout conditions with minimal noise.
The Free Edition provides the core engine behind the Humontre system: dynamic EMA bands, adaptive trend coloring, and precise LONG / SHORT signals.
Whether you trade Crypto, Forex, Indices or Stocks , the Signal Channel keeps you aligned with market structure in a simple and intuitive way.
🔍 How It Works
1. Dynamic EMA Channel
A fast-reacting EMA forms the core of the system. The channel boundaries can be calculated using:
ATR × Multiplier (recommended)
Percentage mode (alternative for low-volatility markets)
This creates a flexible volatility envelope that naturally highlights trend strength and momentum expansion.
2. Adaptive Trend Coloring
The EMA automatically shifts colors:
Green → bullish pressure
Red → bearish pressure
Clear, objective trend visualization without interpretation.
3. Long & Short Signals
Signals appear when price closes outside the band:
LONG → Close crosses above the upper band
SHORT → Close crosses below the lower band
Repeated signals in the same direction are filtered for cleaner momentum confirmation.
4. Multi-Market Ready
Works on all markets and timeframes:
Crypto
Forex
Indices
Stocks
Commodities
🆓 Free Edition Includes
Dynamic EMA Channel
ATR or % Band Mode
Adaptive Trend Colors
Clean LONG / SHORT Signals
Basic Alerts
Minimal, unobtrusive chart visuals
Ideal for learning the Humontre system and spotting breakout opportunities.
⭐ Upgrade to the Pro Edition (Invite-Only)
The Humontre Signal Channel — Pro Edition unlocks advanced professional features:
Automatic SL & TP levels
Dynamic Risk-to-Reward box
SL/TP labels & smart line system
Live trade tracking
Full trade history table
UI & theme customization
Alerts for SL/TP hits
Much more coming…
If you’d like access, feel free to contact me.
📌 Disclaimer
This indicator is for educational purposes only and does not constitute financial advice. Always use proper risk management.

TrendShift DetectorReversal detector identifying no-wick candles after trend shifts. Scans for first candle without opening-side wick following bullish/bearish sequences. Visual triangle signals (▼ SHORT / ▲ LONG). Customizable parameters: sequence length, body size, wick tolerance, lookback period.

Forex indicator By petran Elevate your market analysis with this powerful, all-in-one visual toolkit designed for discretionary traders across Forex, indices, and commodities (metals).
Core Features:
Trading Sessions Overlay: Clear visual bands highlighting the Asian, London, and New York trading sessions directly on your chart. Never miss a market open or a session overlap again.
Smart Daily Levels: Automatically plots the most essential reference points from the previous day:
PDH / PDL (Previous Day High/Low) – Key support and resistance.
PWH / PWL (Previous Week High/Low) – Higher timeframe context.
DO (Day Open) – A crucial intraday pivot level.
Motivational Watermark: A unique and customizable text overlay at the top of your screen. Display your favorite trading quote, rule, or reminder to maintain the right mindset during the trading day.
Clean & Customizable: Designed for clarity. Adjust colors, session times, and watermark text to fit your personal trading style and chart aesthetics.
Why Traders Choose This Indicator:
Saves Time: No more manually drawing sessions or calculating yesterday's levels.
Improves Discipline: The visual sessions and watermark help you trade only during your planned times and follow your rules.
Universal Application: Works seamlessly on any liquid market where session activity and daily ranges matter.
Perfect for traders who rely on price action, session-based strategies, and need a clean, informative chart environment.

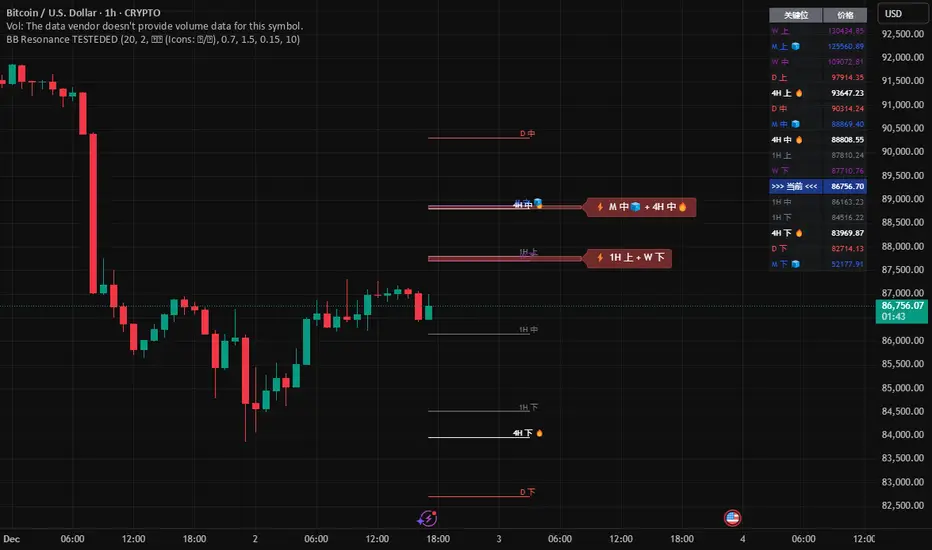
Global BB Resonance [by TESTEDED]📈 Global BB Resonance Hunter
1. Design Philosophy: Dimensional Reduction
In modern trading, "Information Overload" is the enemy. Traders often clutter their charts with 15+ Bollinger Band lines across 1H, 4H, Daily, and Weekly timeframes, resulting in a "spaghetti chart" that is impossible to read quickly.
The core logic of this indicator is "Dimensional Reduction." Instead of drawing every single line, this script runs a background algorithm to detect "Confluence" (Resonance).
The Thesis: A single Bollinger line (e.g., 1H Upper) is easily broken. However, when multiple dimensions overlap (e.g., 1H Upper + Daily Mid + Weekly Low) at the exact same price level, a "Market Consensus" is formed. These are the critical "Walls" of the market.
The Solution: We sort all data by Price, not Time. If lines cluster together within a specific threshold (e.g., 0.15%), the script draws a single Resonance Box instead of multiple confusing lines.
2. Key Features
🛡️ Multi-Timeframe Monitoring: Simultaneously monitors 1H, 4H, Daily, Weekly, and Monthly Bollinger Bands in the background, regardless of your chart's current timeframe.
⚡ Smart Resonance Detection: Automatically groups overlapping levels into "Resonance Boxes."
⚡ (2-Line Confluence): Watch closely.
⚡⚡ (3-Line Confluence): Strong Support/Resistance.
⚡⚡⚡ (4+ Lines): "Iron Wall" Resonance.
📊 Volatility State Perception: Detects if the bands are Squeezing (accumulating energy) or Expanding (trending).
Style Options: Choose between Icons (🧊/🔥) or Geek Symbols (>.< / <^>).
🧘 Focus Mode (Sniper View): A unique feature that hides all individual lines, leaving only the Resonance Boxes and the Dashboard. This keeps your chart clean and distraction-free.
🔔 Smart Alerts: Get notified immediately when Price touches a Resonance Box or when a Squeeze occurs.
3. Visual Guide
A. The Symbols (State Indicators)
You can switch styles in the settings.
B. The Resonance Boxes
Red Box: Resistance Zone (Above Price).
Green Box: Support Zone (Below Price).
Label: E.g., ⚡⚡ 1H Up + D Mid. This tells you exactly which levels are overlapping.
4. Usage Strategy
The "Reversal" Setup: Look for a Green Resonance Box below price with High Confluence (⚡⚡). Ensure the state is NOT Expanding (<^> or 🔥).
The "Breakout" Setup: Look for the Squeeze Symbol (>.< or 🧊) on the dashboard. If price approaches a Resonance Box while Squeezing, expect a breakout.
The "Sniper" Method: Turn on Focus Mode. Set Alerts. Only look at the chart when price hits a "Wall."
How to use: youtu.be
📈 布林带多维共振捕猎者
1. 设计哲学:降维打击
在现代交易中,“信息过载”是最大的敌人。交易者经常在图表上叠加 1H、4H、日线、周线等 15 条以上的布林带线条,导致图表像“盘丝洞”一样难以阅读。
本指标的核心逻辑是“降维打击”与“数据可视化”。 我们不再画出每一条线,而是在后台运行算法来捕捉**“共振”(Confluence)**。
核心理念:单一周期的布林线(如 1H 上轨)很容易被刺破。但是,当多个维度的力量(如 1H 上轨 + 日线中轨 + 周线下轨)在同一个价格水平重叠时,就形成了**“市场合力”**。这些位置才是市场真正的“铜墙铁壁”。
解决方案:系统按价格而非时间对数据进行排序。如果多条线在特定阈值(如 0.15%)内聚集,脚本会画出一个**“共振框”**,而不是无数条混乱的线。
2. 核心功能
🛡️ 全维幽灵监控:无论当前图表周期如何,脚本都会在后台实时监控 1H, 4H, 日线, 周线, 月线 的数据。
⚡ 智能共振雷达:自动检测并合并重叠的关键位。
⚡ (2线共振):值得关注。
⚡⚡ (3线共振):强力支撑/阻力。
⚡⚡⚡ (4线以上):核弹级/铁壁共振。
📊 波动率状态感知:自动识别布林带是处于 挤压蓄势 还是 扩张爆发 阶段。
风格切换:支持 图标模式 (🧊/🔥) 或 极客符号模式 (>.< / <^>)。
🧘 专注模式 (Focus Mode):一键隐藏所有单线,只保留共振框和仪表盘。让您的图表瞬间清空,像狙击手一样只关注目标。
🔔 智能警报:当价格触及共振框,或出现极度压缩信号时,立即发送警报。
3. 视觉指南
A. 状态符号说明
您可以在设置中切换显示风格。
B. 共振框说明
红色方框:上方阻力区 (Resistance)。
绿色方框:下方支撑区 (Support)。
标签示例:⚡⚡ 1H Up + D Mid —— 明确告知您是哪几条线发生了共振。
4. 实战策略
“反转”交易:寻找价格下方的绿色共振框,且具有高星级 (⚡⚡)。前提是当前状态不是扩张状态 (<^> 或 🔥)。
“突破”交易:在仪表盘上看到 挤压符号 (>.< 或 🧊)。如果价格在挤压状态下逼近共振框,不要逆势阻挡,大概率会发生强力突破。
“狙击”模式:开启 专注模式。设置好警报。不要盯着 K 线波动,直到价格撞上“墙壁”触发警报时再介入。
使用说明: youtu.be
Candlewick Detector Heinken AshiTrend reversal detector based on no-wick candle analysis at the opening side. Identifies momentum shifts by marking the first reversal candle after a bullish or bearish sequence. The indicator scans up to 5 candles after a color change to detect the first candle without wick on the opening side (red candle with no upper wick or green candle with no lower wick). Clear visual signals with colored triangles. Fully customizable parameters including minimum sequence length, body size percentage, wick tolerance, and lookback period to adapt to all trading styles.
