Indicadores e estratégias

Copper_to_Gold_Ratio by Zeche Cu/Au Ratio – LINES + LABELS is a clean, macro-oriented indicator built around the Copper/Gold price ratio — a well-known gauge of economic strength, market sentiment, and shifts between risk-taking and risk-aversion.
The script calculates:
the 120-day SMA of the Copper/Gold ratio
the standard deviation over the same period
the ±1σ, ±1.5σ, and ±2σ deviation bands
automatic labels on the last bar for maximum clarity
The design is minimalistic and visually optimized so users can quickly understand where the current ratio sits relative to long-term norms. The deviation zones help highlight moments when the market transitions into RISK-ON or RISK-OFF behavior.
How to interpret the signals:
Above +2σ → RISK-OFF environment (defensive tone, macro stress)
Below −2σ → RISK-ON environment (increased risk appetite)
±1σ bands represent normal cyclical movements
The SMA acts as the long-term equilibrium level

Weekly PivotsTraditional weekly pivots based on the prior weeks OHLC, anchored from the 17:00CT reopen that starts the new trading week.

UM OBV with Signal (EMA/SMA/WMA/NWE)SUMMARY
A visual OBV trend tool that highlights bullish and bearish volume pressure using smart smoothing and intuitive color-coding.
⸻
WHY THIS INDICATOR?
There are only three variables you can adjust on a chart: price, volume, and time. I wanted a good volume indicator.
⸻
DESCRIPTION
This tool extends classic On-Balance Volume with selectable trend smoothing (EMA, SMA, WMA, or NWE) and visual directional coloring on both OBV and the Signal line. Green shows bullish volume flow, red shows bearish volume flow. Optional crossover markers help confirm shifts in buying pressure.
Nadaraya-Watson Regression (NWE) provides a smooth, non-MA alternative for filtering volume trend noise, and optional dual-NWE coloring helps reduce false flips in choppy markets.
⸻
THE CHART
The indicator is added twice at the bottom; once with a 21 EMA and again with a 55 SMA. The chart has text and illustrations to show where the OBV flipped colors. More red equals more selling pressure. More green equals more buying volume or pressure.
⸻
DEFAULTS
• OBV smoothing length = 3
• Signal = 21 EMA
• Crossover bubbles are hidden/off by default
⸻
SUGGESTED USES
• Combine with price structure, momentum, or volatility tools to confirm trend strength.
• Try switching between EMA and NWE on faster intraday charts to see volume trend earlier.
• Use crossover signals as secondary confirmation rather than standalone entries.
• Use this indicator with your other favorite indicators for confirmation.
• Select timeframes suitable to your style of trading.
• I use the 30-minute, 6-hour, and Daily timeframes.
• I question myself if I am buying something with this indicator being red.
• Experiment with various timeframes and settings.
⸻
AUTHOR OBSERVATIONS
OBV often turns before price—especially when volume surges ahead of breakout levels.
NWE tends to smooth choppy OBV much better than traditional moving averages in noisy markets.
Look for Signal color flips at key support/resistance or volatility inflection points.
⸻
ALERTS
Right-click the indicator and choose Add alert… – two presets are available:
• Bullish OBV Turning Up
• Bearish OBV Turning Down

RSI + MACD Day Trading Toolkit//@version=6
indicator("RSI + MACD Day Trading Toolkit", overlay = true)
//──────────────────────────────────────────────────────────────────────────────
// 1. INPUTS
//──────────────────────────────────────────────────────────────────────────────
// RSI settings
rsiLength = input.int(14, "RSI Length")
rsiOverbought = input.float(70, "RSI Overbought Level", minval = 50, maxval = 100)
rsiOversold = input.float(30, "RSI Oversold Level", minval = 0, maxval = 50)
// MACD settings (classic 12 / 26 / 9)
macdFastLength = input.int(12, "MACD Fast Length")
macdSlowLength = input.int(26, "MACD Slow Length")
macdSignalLength = input.int(9, "MACD Signal Length")
// Risk model selection
riskModel = input.string("ATR", "Risk Model", options = )
// ATR-based SL/TP
atrLength = input.int(14, "ATR Length")
atrSLMult = input.float(1.5, "SL ATR Multiplier", minval = 0.1, step = 0.1)
atrTPMult = input.float(2.5, "TP ATR Multiplier", minval = 0.1, step = 0.1)
// Percent-based SL/TP (for scalping on very tight spreads)
slPercent = input.float(0.5, "SL % (when Risk Model = Percent)", minval = 0.05, step = 0.05)
tpPercent = input.float(1.0, "TP % (when Risk Model = Percent)", minval = 0.05, step = 0.05)
// Visual / styling
showSLTPLines = input.bool(true, "Plot Stop Loss / Take Profit Lines")
//──────────────────────────────────────────────────────────────────────────────
// 2. CORE INDICATORS: RSI & MACD
//──────────────────────────────────────────────────────────────────────────────
rsiValue = ta.rsi(close, rsiLength)
// Manual MACD calculation (avoids tuple unpacking issues)
macdFastEMA = ta.ema(close, macdFastLength)
macdSlowEMA = ta.ema(close, macdSlowLength)
macdValue = macdFastEMA - macdSlowEMA
macdSignal = ta.ema(macdValue, macdSignalLength)
macdHist = macdValue - macdSignal
atrValue = ta.atr(atrLength)
// Hide internal plots from price scale (still accessible if you change display)
plot(rsiValue, "RSI", display = display.none)
plot(macdValue, "MACD", display = display.none)
plot(macdSignal, "MACD Sig", display = display.none)
plot(macdHist, "MACD Hist", display = display.none)
//──────────────────────────────────────────────────────────────────────────────
// 3. SIGNAL LOGIC (ENTRY CONDITIONS)
//──────────────────────────────────────────────────────────────────────────────
//
// Idea:
// - LONG bias: RSI emerges from oversold AND MACD crosses above signal below zero
// - SHORT bias: RSI falls from overbought AND MACD crosses below signal above zero
//
// Combines momentum (RSI) with trend confirmation (MACD).
//──────────────────────────────────────────────────────────────────────────────
// RSI events
rsiBullCross = ta.crossover(rsiValue, rsiOversold) // RSI crosses UP out of oversold
rsiBearCross = ta.crossunder(rsiValue, rsiOverbought) // RSI crosses DOWN from overbought
// MACD crossover with trend filter
macdBullCross = ta.crossover(macdValue, macdSignal) and macdValue < 0 // Bullish cross below zero-line
macdBearCross = ta.crossunder(macdValue, macdSignal) and macdValue > 0 // Bearish cross above zero-line
// Raw (ungated) entry signals
rawLongSignal = rsiBullCross and macdBullCross
rawShortSignal = rsiBearCross and macdBearCross
//──────────────────────────────────────────────────────────────────────────────
// 4. STATE MANAGEMENT (SIMULATED POSITION TRACKING)
//──────────────────────────────────────────────────────────────────────────────
//
// position: 1 = long
// -1 = short
// 0 = flat
//
// We track entry price and SL/TP levels as if this were a strategy.
// This is still an indicator – it just computes and plots the logic.
//──────────────────────────────────────────────────────────────────────────────
var int position = 0
var float longEntryPrice = na
var float shortEntryPrice = na
var float longSL = na
var float longTP = na
var float shortSL = na
var float shortTP = na
// Per-bar flags (for plotting / alerts)
var bool longEntrySignal = false
var bool shortEntrySignal = false
var bool longExitSignal = false
var bool shortExitSignal = false
// Reset per-bar flags each bar
longEntrySignal := false
shortEntrySignal := false
longExitSignal := false
shortExitSignal := false
//──────────────────────────────────────────────────────────────────────────────
// 5. EXIT LOGIC (STOP LOSS / TAKE PROFIT / OPPOSITE SIGNAL)
//──────────────────────────────────────────────────────────────────────────────
//
// Exits are evaluated BEFORE new entries on each bar.
//──────────────────────────────────────────────────────────────────────────────
// Stop-loss / take-profit hits for existing positions
longStopHit = position == 1 and not na(longSL) and low <= longSL
longTakeHit = position == 1 and not na(longTP) and high >= longTP
shortStopHit = position == -1 and not na(shortSL) and high >= shortSL
shortTakeHit = position == -1 and not na(shortTP) and low <= shortTP
// Opposite signals can also close positions
reverseToShort = position == 1 and rawShortSignal
reverseToLong = position == -1 and rawLongSignal
// Combine exit conditions
longExitNow = longStopHit or longTakeHit or reverseToShort
shortExitNow = shortStopHit or shortTakeHit or reverseToLong
// Register exits and flatten position
if longExitNow and position == 1
longExitSignal := true
position := 0
longEntryPrice := na
longSL := na
longTP := na
if shortExitNow and position == -1
shortExitSignal := true
position := 0
shortEntryPrice := na
shortSL := na
shortTP := na
//──────────────────────────────────────────────────────────────────────────────
// 6. ENTRY LOGIC WITH RISK MODEL (SL/TP CALCULATION)
//──────────────────────────────────────────────────────────────────────────────
//
// Only take a new trade when flat.
// SL/TP are calculated relative to entry price using either ATR or Percent.
//──────────────────────────────────────────────────────────────────────────────
if position == 0
// Long entry
if rawLongSignal
position := 1
longEntryPrice := close
if riskModel == "ATR"
longSL := longEntryPrice - atrValue * atrSLMult
longTP := longEntryPrice + atrValue * atrTPMult
else // Percent model
longSL := longEntryPrice * (1.0 - slPercent / 100.0)
longTP := longEntryPrice * (1.0 + tpPercent / 100.0)
longEntrySignal := true
// Short entry
else if rawShortSignal
position := -1
shortEntryPrice := close
if riskModel == "ATR"
shortSL := shortEntryPrice + atrValue * atrSLMult
shortTP := shortEntryPrice - atrValue * atrTPMult
else // Percent model
shortSL := shortEntryPrice * (1.0 + slPercent / 100.0)
shortTP := shortEntryPrice * (1.0 - tpPercent / 100.0)
shortEntrySignal := true
//──────────────────────────────────────────────────────────────────────────────
// 7. PLOTTING: ENTRIES, EXITS, STOPS & TARGETS
//──────────────────────────────────────────────────────────────────────────────
// Entry markers
plotshape(longEntrySignal, title = "Long Entry", style = shape.triangleup, location = location.belowbar, color = color.new(color.lime, 0), size = size.small, text = "LONG")
plotshape(shortEntrySignal, title = "Short Entry", style = shape.triangledown, location = location.abovebar, color = color.new(color.red, 0), size = size.small, text = "SHORT")
// Exit markers (generic exits: SL, TP or reversal)
plotshape(longExitSignal, title = "Long Exit", style = shape.xcross, location = location.abovebar, color = color.new(color.orange, 0), size = size.tiny, text = "LX")
plotshape(shortExitSignal, title = "Short Exit", style = shape.xcross, location = location.belowbar, color = color.new(color.orange, 0), size = size.tiny, text = "SX")
// Optional: show SL/TP levels on chart while in position
plot(showSLTPLines and position == 1 ? longSL : na, title = "Long Stop Loss", style = plot.style_linebr, color = color.new(color.red, 0), linewidth = 1)
plot(showSLTPLines and position == 1 ? longTP : na, title = "Long Take Profit", style = plot.style_linebr, color = color.new(color.lime, 0), linewidth = 1)
plot(showSLTPLines and position == -1 ? shortSL : na, title = "Short Stop Loss", style = plot.style_linebr, color = color.new(color.red, 0), linewidth = 1)
plot(showSLTPLines and position == -1 ? shortTP : na, title = "Short Take Profit", style = plot.style_linebr, color = color.new(color.lime, 0), linewidth = 1)
//──────────────────────────────────────────────────────────────────────────────
// 8. ALERT CONDITIONS
//──────────────────────────────────────────────────────────────────────────────
//
// Configure TradingView alerts using these conditions.
//──────────────────────────────────────────────────────────────────────────────
// Entry alerts
alertcondition(longEntrySignal, title = "Long Entry (RSI+MACD)", message = "RSI+MACD: Long entry signal")
alertcondition(shortEntrySignal, title = "Short Entry (RSI+MACD)", message = "RSI+MACD: Short entry signal")
// Exit alerts (by type: SL vs TP vs reversal)
alertcondition(longStopHit, title = "Long Stop Loss Hit", message = "RSI+MACD: Long STOP LOSS hit")
alertcondition(longTakeHit, title = "Long Take Profit Hit", message = "RSI+MACD: Long TAKE PROFIT hit")
alertcondition(shortStopHit, title = "Short Stop Loss Hit", message = "RSI+MACD: Short STOP LOSS hit")
alertcondition(shortTakeHit, title = "Short Take Profit Hit", message = "RSI+MACD: Short TAKE PROFIT hit")
alertcondition(reverseToShort, title = "Long Exit by Reverse Signal", message = "RSI+MACD: Long exit by SHORT reverse signal")
alertcondition(reverseToLong, title = "Short Exit by Reverse Signal", message = "RSI+MACD: Short exit by LONG reverse signal")
//──────────────────────────────────────────────────────────────────────────────
// 9. QUICK USAGE NOTES
//──────────────────────────────────────────────────────────────────────────────
//
// - Indicador, não estratégia: ele simula posição, SL/TP e sinais de saída.
// - Para backtest/auto, basta portar a mesma lógica para um script `strategy()`
// usando `strategy.entry` e `strategy.exit`.
// - Em day trade, teste ATR vs Percent e ajuste os multiplicadores ao ativo.
//──────────────────────────────────────────────────────────────────────────────

HH HL LH LL + BOS / CHoCHHH HL LH LL + BOS / CHoCH Structure Indicator (ATR Adaptive)
This indicator provides a complete market structure framework using swing-based pivots, real-time trend detection, BOS (Break of Structure), CHoCH (Change of Character), and optional ATR-adaptive swing sensitivity.
🔹 Core Features
1. Market Structure Labels
The script detects and labels:
HH – Higher High
LH – Lower High
HL – Higher Low
LL – Lower Low
These labels help visualize trend continuation or weakness in structure.
Each label type can be individually toggled ON/OFF in settings.
2. ATR-Based Adaptive Swing Length (Optional)
Swing pivots can be calculated using:
A fixed manual swing length, or
A dynamic ATR-based swing length that adjusts automatically to volatility.
Increasing volatility → longer swings
Decreasing volatility → tighter swings
This makes structure detection more stable and timeframe-adaptive.
3. Close-Based Break of Structure (BOS)
The indicator identifies a BOS when:
Price closes above the previous swing high (Bullish BOS↑)
Price closes below the previous swing low (Bearish BOS↓)
BOS labels can be turned ON/OFF without affecting internal calculations.
4. CHoCH (Change of Character)
CHoCH is triggered when a BOS occurs against the current trend, indicating a potential trend reversal:
CHoCH↑ – Bearish → Bullish reversal
CHoCH↓ – Bullish → Bearish reversal
CHoCH remains active even when BOS labels are turned off.
5. Alerts
The indicator provides alert conditions for:
CHoCH↑ (Bullish Trend Shift)
CHoCH↓ (Bearish Trend Shift)
This allows traders to automate notifications for significant trend changes.
6. Trend State Tracking
The script internally tracks the current structure-based trend:
Uptrend
Downtrend
Undefined
The trend updates dynamically based on real BOS events.
7. Fully Backwards Compatible
The indicator generates structure, BOS, and CHoCH even when scrolling back deep in chart history, thanks to extended max_bars_back handling.
Summary
This tool provides a complete, flexible, and non-repainting framework for market structure analysis, suitable for:
SMC/ICT traders
Swing & intraday traders
Trend traders
Price action analysts
With adaptive swing detection, clean structure labeling, BOS/CHoCH logic, and alert integration, the indicator helps traders understand market transitions with clarity and precision.

EMA/SMA Crossover Signals📊 EMA/SMA Crossover Signals
A professional trading indicator that identifies golden and death crosses between a customizable EMA and SMA with clear BUY/SELL labels displayed directly on your chart.
🎯 Key Features:
✅ Customizable Moving Averages - Adjust both EMA and SMA periods to match your trading strategy
✅ Clear Signal Labels - Large, color-coded "BUY" and "SELL" labels that are impossible to miss
✅ Adjustable Label Positioning - Control the vertical distance of signal labels from price action
✅ Professional Color Customization - Change colors for both moving averages and signals to match your theme
✅ Label Size Options - Choose from 4 different sizes (Tiny, Small, Normal, Large)
✅ Audio Alerts - Get notified instantly when crossovers occur
✅ Overlay Display - Signals appear directly on your price chart for better context
📈 How It Works:
🟢 BUY Signal: Triggered when the EMA crosses above the SMA (bullish crossover)
🔴 SELL Signal: Triggered when the EMA crosses below the SMA (bearish crossover)
⚙️ Customizable Settings:
Moving Averages:
- EMA Period (Default: 8)
- SMA Period (Default: 200)
Colors:
- EMA Color
- SMA Color
- Buy Signal Color
- Sell Signal Color
Signal Settings:
- Signal Vertical Offset
- Label Vertical Offset
- Label Size
💡 Best For:
- Day Trading (1-5 min timeframes)
- Swing Trading (4H-Daily)
- Trend Following Strategies
- Identifying momentum shifts
- Confirming market structure changes
🔔 Perfect for traders using ICT, Wyckoff, and institutional trading methodologies
Use this indicator as part of your complete trading system. Always combine with proper risk management and additional confluence factors.

Yesterday High LineYesterdays High Line Green Dotted Line. Just a line at the high point reached in yesterdays trading cycle

Liquidity Sweep Indicator (Signal-based SL + BE/TP)I created a more advanced version of my Liquidity Sweep Indicator. Open source, but I dont recommend to create a TV-strategy from the code because you should combine it with price action an chart analysis! Have fun :)

Sniper VFI: Institutional Breakout & HeatmapDescription:
Overview This is a professional-grade momentum indicator designed to track Institutional Smart Money flow while filtering for high-probability breakout setups. It combines volume analysis, trend filtration, and price action triggers into a single dashboard.
How It Works The indicator operates on a three-step validation process:
Trend Filter: Uses a 150 EMA to define the major trend. Long positions are only permitted above the 150 EMA, and Short positions only below it.
Institutional Volume (VFI): Analyzes the Volume Flow Indicator to ensure Smart Money is participating in the move.
Micro-Breakout Trigger: Signals are only generated if the price breaks the High (for Longs) or Low (for Shorts) of the last 3 candles, ensuring immediate momentum.
Visual Guide & Legend
The Histogram (Volume & Momentum):
Bright Lime: Strong Bullish Impulse. Institutional money is flowing in, and momentum is accelerating.
Dark Green: Stable Uptrend. The trend is healthy.
Bright Red: Strong Bearish Impulse. Institutional money is flowing out, and downside momentum is accelerating.
Maroon: Stable Downtrend.
The Heatmap Tips (RSI Temperature):
Orange Tips: Overbought Warning (RSI > 70). The asset is heating up; caution is advised for new long entries. The opacity increases as RSI approaches 100.
White Tips: Oversold Warning (RSI < 30). The asset is extended to the downside.
The Signals (L/S):
L (Long): Confirmed entry. Trend is Up + VFI Positive + Price broke the recent 3-candle High.
S (Short): Confirmed entry. Trend is Down + VFI Negative + Price broke the recent 3-candle Low.
Note: This tool includes an alternating signal filter to prevent repetitive signals during trends. A Long signal will not repeat until a Short signal or a trend reset occurs.

AI Kernel Regression StrategyHow to Use This Strategy
Paste the Code: Open the Pine Editor, paste the code, and click "Add to chart".
Look for Reversals:
BUY Signal: The price dipped below the green band (oversold) and snapped back up. The script identifies this as a high-probability bounce.
SELL Signal: The price spiked above the red band (overbought) and snapped back down.
Adjust the "Lookback Window":
In the settings (gear icon), if you change Lookback Window to a higher number (e.g., 15-20), the lines become smoother (better for trends).
If you lower it (e.g., 3-5), it becomes very reactive (better for scalping).
Important Note on "Repainting"
This script uses a technique called Regression. In live trading, it works perfectly (the signal appears when the candle closes). However, be aware that "AI" scripts like this are heavy on calculations. If you refresh your browser, the historical lines might shift slightly to fit the data better. Always wait for the candle to close before taking the trade to ensure the signal is locked in.


TWAP (Monthly 1700CT)This TWAP is Anchored to the 1700CT open of the day prior to the new month trading day. New Month TWAP.

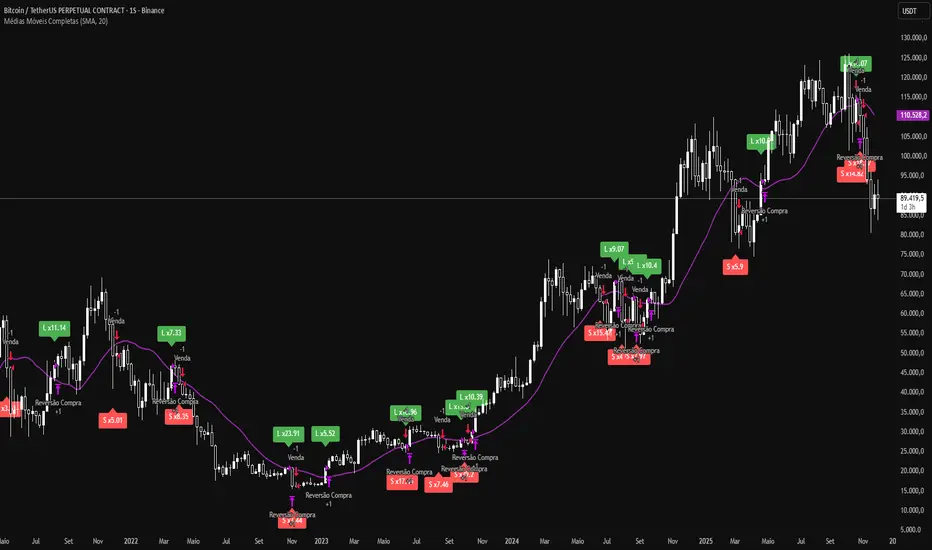
Moving Average + Candle LeverageWhat if you could extract more value from each trade based on your stop loss and entry, increasing your leverage safely? Could your winning trades be even more profitable?
This indicator uses a single selectable moving average (SMA, EMA, WMA, HMA, or VWMA) to calculate safe leverage per candle, allowing traders to maximize each trade within a defined stop loss. Actual profit remains variable depending on market movement and applied leverage.
How signals appear and how leverage is determined
L (green): signals that price crossed above the moving average (potential long entry).
S (red): signals that price crossed below the moving average (potential short entry).
Each crossover shows a label with “x”, indicating the theoretical safe leverage for that candle.
How safe leverage is calculated:
Long: close ÷ (close − candle low)
Short: close ÷ (candle high − close)
How leverage is applied:
Identify the signal candle and record close, high, and low.
Calculate the difference between the close price and the stop price (low for Long, high for Short).
The percentage difference between these prices is our safe leverage: the smaller the difference, the higher the leverage possible, always respecting the stop loss.
The “x” label shows this maximum leverage, protecting the position balance using the candle’s stop loss.
Actual profit will still depend on market movement, but the stop loss is already defined and secure.
Main benefits:
Maximize trade potential with known stop loss
Plan entries and position sizing safely
Clearly visualize safe leverage per candle
Simple, efficient, and educational
Disclaimer:
The indicator does not execute trades automatically and is not a full trading system. It is intended solely for educational purposes and safe leverage management.

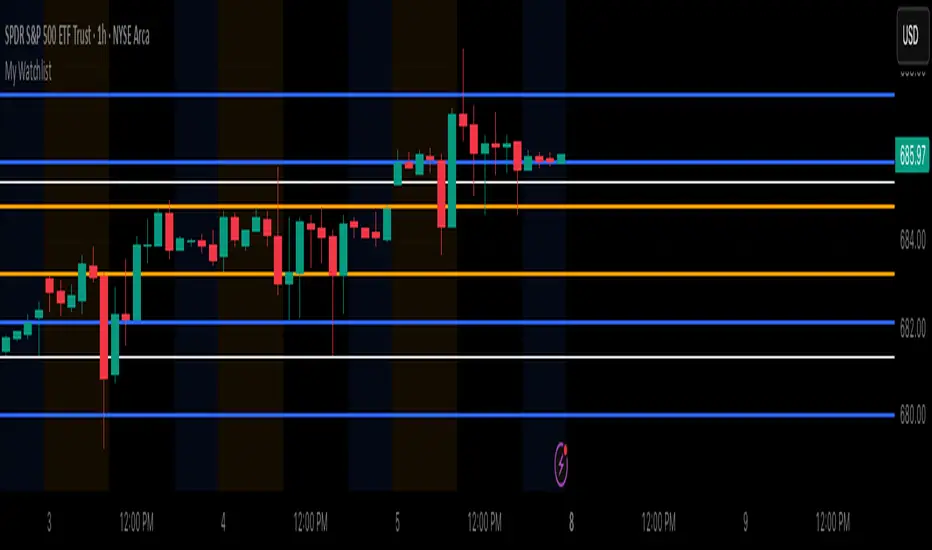
My WatchlistUse Case
Do you belong to a group of traders that post key levels based on their technical analysis to be utilized for trading opportunities? The goal of this indicator is to reduce your daily prep time by allowing you to paste in the actual level values instead of trying to manually create each of the horizontal lines.
How it works
Simply enter the values of the key levels for the tickers that you would like to plot horizontal lines for. If you don't want to plot a level just leave the value as zero and it will be ignored.
Settings
You can enable/disable any of the levels
You can change the colors of the levels
You can add Previous Day High and Previous Day Low levels to the chart
NeuroSwarm ETH — Crowd vs Experts Forecast TrackerEnglish:
NeuroSwarm — Crowd vs Experts Forecast Tracker (ETH)
This indicator visualizes monthly forecast data collected from two independent groups:
Crowd – a large sample of retail participants
Experts – a curated group of analysts and experienced market participants
For each month, the indicator plots the following values as horizontal levels on the price chart:
Median forecast (Crowd)
Average forecast (Crowd)
Median forecast (Experts)
Average forecast (Experts)
Shaded zones highlighting the difference between median and mean
All values are fixed for each month and stay unchanged historically.
This allows traders to analyze sentiment dynamics and compare how expectations from both groups align or diverge from actual price action.
Purpose:
This tool is intended for sentiment visualization and analytical insight — it does not generate trading signals.
Its main goal is to compare collective expectations of retail traders vs experts across time.
Data source:
All forecasts come from monthly surveys conducted within the NeuroSwarm project between the 1st and 5th day of each month.
Interface notice:
The script's UI may contain non-English labels for convenience, but a full English documentation is provided here in compliance with TradingView rules.
Русская версия:
NeuroSwarm — Мудрость Толпы vs Эксперты (ETH)
Индикатор отображает ежемесячные прогнозы двух групп:
Толпа: медиана и средняя прогнозов
Эксперты: медиана и средняя прогнозов
Значения фиксируются для каждого месяца и показываются горизонтальными уровнями.
Заливка отображает диапазон между медианой и средней, что упрощает визуальное сравнение настроений.
Это аналитический инструмент для визуализации настроений — не торговая стратегия.
Все данные берутся из ежемесячных опросов проекта NeuroSwarm.

Ichimoku Multi-Timeframe Heatmap 12/5/2025
Multi-Timeframe Ichimoku Heatmap - Scan Your Watchlist in Seconds
This indicator displays all 5 critical Ichimoku signals (Cloud Angle, Lagging Line, Price vs Cloud, Kijun Slope, and Tenkan/Kijun Cross) across 10 timeframes (15s, 1m, 3m, 5m, 15m, 30m, 1h, 4h, Daily, Weekly) in one compact heatmap table. Instantly spot multi-timeframe trend alignment with color-coded cells: green for bullish, red for bearish, and gray for neutral. Perfect for quickly scanning through your entire watchlist to identify the strongest setups with confluent signals across all timeframes.

Estrategia Trend Following: 52w/26w BreakoutThis is a classic long-term Trend Following strategy, heavily inspired by the Donchian Channel system and the legendary "Turtle Trading" rules. It is designed to capture major market moves (bull runs) while filtering out short-term market noise and volatility.
This script is ideal for investors and swing traders who prefer a "hands-off" approach, looking to catch large trends rather than day-trading small fluctuations.
How it Works:
1. Entry Condition (The Breakout):
52-Week High: The strategy enters a Long position when the price breaks above the highest high of the last 252 trading days (approx. 1 year).
SuperTrend Filter: An additional filter using the SuperTrend indicator ensures that the breakout is supported by positive momentum, helping to reduce false signals during choppy lateral markets.
2. Exit Condition (The Trailing Stop):
26-Week Low: The strategy ignores short-term corrections. It only closes the position if the price closes below the lowest low of the last 126 trading days (approx. 6 months).
This wide stop allows the trade to "breathe" and stay open during significant pullbacks, ensuring you stay in the trend for as long as possible.
Features & Settings:
Customizable Lookback Periods: You can adjust the Entry (default 252 days) and Exit (default 126 days) periods in the settings menu.
Visual Aids:
Blue Line: Represents the 1-Year High (Entry Threshold).
Red Line: Represents the 6-Month Low (Dynamic Stop Loss).
Channel Shading: Visualizes the trading range between the high and low.
Labels: Clearly marks "BUY" and "EXIT" points on the chart.
Recommended Usage:
Timeframe: Daily (1D). This logic is designed for daily candles.
Assets: Works best on assets with strong trending characteristics (e.g., Bitcoin/Crypto, Tech Stocks, Indices like SPX/NDX, and Commodities).
Patience Required: This strategy generates very few signals. It may stay quiet for months and then hold a position for over a year.

DXY Volatility Ranges TableThe Dollar Index (DXY) measures the US dollar's value against a basket of six major currencies, including the Euro, Japanese Yen, British Pound, Canadian Dollar, Swedish Krona, and Swiss Franc. Here are some key ranges for the DXY:
- Historical Highs and Lows:
- All-time high: 164.720 in February 1985
- All-time low: 70.698 on March 16, 2008
- Recent Trends:
- Current value: around 99.603 (as of December 5, 2025)
- 52-week high: 129.670 (November 8, 1985)
- 52-week low: 94.650 (projected target by some analysts)
- Volatility Ranges:
- Low volatility: DXY < 95
- Moderate volatility: DXY between 95-105
- High volatility: DXY > 105
- Support and Resistance Levels:
- Support: around 94.650 and 90.00
- Resistance: around 100.15/35 and 105.00

Daily & Monday Pro (Replay Fixed) the bestPhiên bản xịn nhất của Daily & Monday Key Levels trên Tradingview
Chúc các bạn vui vẻ.
:)

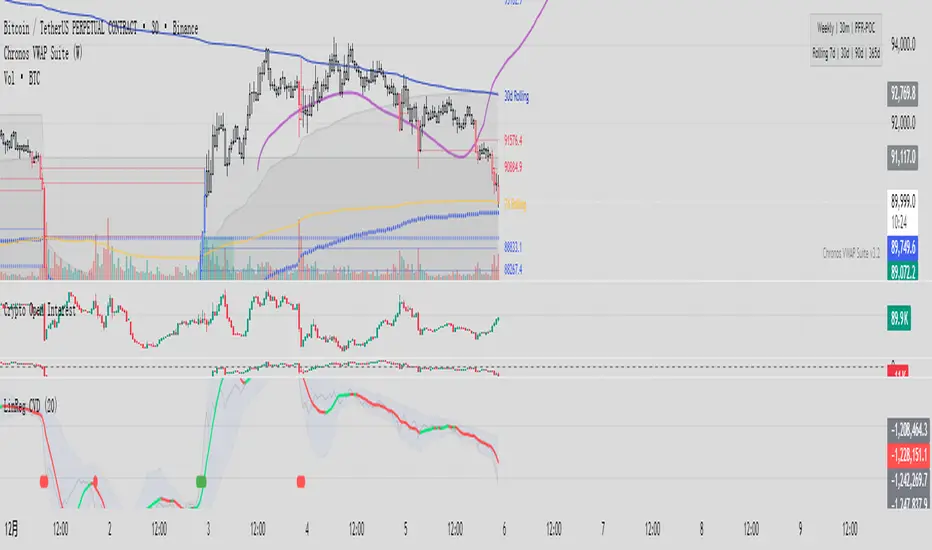
Linear Regression CVDHere is the complete user manual and introduction for the Linear Regression CVD indicator in English. You can save this as your documentation for your trading system.
📊 Linear Regression CVD – Trader’s Manual
1. Introduction
Core Concept:
Standard Cumulative Volume Delta (CVD) indicators are often noisy and jagged, making it difficult to decipher the true direction of capital flow. This indicator applies a Linear Regression algorithm to smooth out the CVD data and adds a Standard Deviation Channel. It is designed to answer two critical questions:
What is the "True Trend" of the money flow? (Filtering out noise)
Is the market sentiment currently overheated? (Using the channel to spot extremes)
Best Markets:
Crypto Perpetual Futures (e.g., BTCUSDT.P) — Highly Recommended.
Stocks & Forex (Must have volume data).
Timeframes:
Scalping: 1m, 5m, 15m (To catch rapid capital inflows/outflows).
Swing Trading: 1H, 4H (To identify the dominant direction of "Smart Money").
2. Visual Guide
When you load the indicator, you will see the following elements:
A. The Main Line (Linear Regression)
Appearance: A smooth, thick line.
Meaning: The average trend of capital flow.
Color Logic:
🟢 Green: Money flow is trending UP (Buyers are dominant).
🔴 Red: Money flow is trending DOWN (Sellers are dominant).
B. The Raw Line (Gray Hairline)
Appearance: A thin, jagged gray line fluctuating around the main line.
Meaning: The Raw, Real-time CVD. It calculates the volume delta (Close vs. Open) for every single candle without smoothing.
C. The Channel (Blue Background)
Appearance: A blue shaded area around the main line.
Meaning: The "Normal Volatility Range."
Calculated based on 2 Standard Deviations (2σ) from the Linear Regression.
If the Gray Line stays inside this channel, the market is stable/balanced.
D. The Signal Dots
🟢 Green Dot (Upside Extension): The Raw CVD has broken above the upper channel.
Meaning: Extreme Greed / Aggressive Buying / FOMO.
🔴 Red Dot (Downside Extension): The Raw CVD has broken below the lower channel.
Meaning: Extreme Fear / Panic Selling / Capitulation.
3. Trading Strategies
Strategy 1: Trend Confirmation
The basic "Follow the Money" approach.
Bullish Signal (Long):
Price is making Higher Highs.
CVD Main Line turns Green and slopes upward.
Action: Confirms that the price rise is backed by real volume. Hold or Add to Longs.
Bearish Signal (Short):
Price is making Lower Lows.
CVD Main Line turns Red and slopes downward.
Action: Confirms that sellers are in control. Hold Shorts.
Strategy 2: Divergence (High Win Rate)
Finding disagreements between "Price" and "Money Flow".
Bearish Divergence (Top Signal):
Price makes a Higher High.
CVD Main Line makes a Lower High (or fails to break out).
Meaning: Price is rising, but buying effort is fading (Exhaustion) or Limit Sellers are absorbing the buy orders (Absorption).
Action: Look for Short entries.
Bullish Divergence (Bottom Signal):
Price makes a Lower Low.
CVD Main Line makes a Higher Low.
Meaning: Price is dropping, but selling pressure is drying up, or Smart Money is absorbing sell orders via limit buy orders.
Action: Look for Long entries.
Strategy 3: Mean Reversion (Extreme Extensions)
Using the Red/Green dots to fade extremes.
Long Opportunity (Bounce):
Price crashes rapidly.
Cluster of Red Dots appears at the bottom.
Meaning: Panic selling has peaked (Capitulation). The market is oversold on a volume basis.
Action: Wait for a candle reversal pattern, then Long for a bounce.
Short Opportunity (Pullback):
Price pumps vertically.
Cluster of Green Dots appears at the bottom.
Meaning: Retail traders are chasing the pump (FOMO). Buying power is overextended.
Action: Wait for momentum to stall, then Short.
4. Important Limitations & Notes
Data Source Accuracy:
TradingView Standard Volume is an approximation (Close vs. Open logic).
It is not perfect "Tick Data" (like professional Orderflow software), but it is 90% accurate for trend analysis on 1H/4H charts.
Tip: Always use Perpetual Contract charts (e.g., BTCUSDT.P) for Crypto, not Spot charts, to get the correct volume data.
The "Extension" Trap:
Do not Short just because you see a Green Dot. In a strong parabolic bull run, you will see many Green Dots in a row while price keeps flying.
These dots indicate velocity, not necessarily a reversal. Always look for resistance levels or divergence before fading the move.
Settings:
Default Length: 20.
For faster signals: Try 10 or 14.
For smoother trends: Try 50.
5. Pre-Trade Checklist
Before entering a trade, check the Linear CVD:
Color: Is the CVD Line Green or Red? Does it match my trade direction?
Slope: Is the CVD accelerating or flattening out?
Divergence: Did price break a level, but CVD failed to follow? (Fakeout warning).
Extremes: Are there Red/Green dots appearing? If yes, am I chasing a trade too late?
这是一套完整的线性回归 CVD (Linear Regression CVD) 指标的使用说明书和简介。你可以把它保存下来,作为你的交易系统参考文档。
📊 线性回归 CVD (Linear Regression CVD) —— 交易员手册
1. 指标简介 (Introduction)
核心理念:
普通的 CVD(累积成交量差)往往噪音很大,线条锯齿状严重,导致交易者难以看清真正的资金流向趋势。本指标通过线性回归算法 (Linear Regression) 对 CVD 进行平滑处理,并结合标准差通道 (Standard Deviation Channel),试图解决两个核心问题:
资金流向的真实趋势是什么?(排除噪音)
当前的情绪是否过热?(通过通道判定)
适用市场:
加密货币合约 (BTC, ETH 等永续合约) —— 效果最佳
股票、外汇 (需有成交量数据)
适用周期:
日内短线:1分钟、5分钟、15分钟(捕捉快速的资金进出)。
趋势波段:1小时、4小时(判断主力资金的大方向)。
2. 视觉元素说明 (Visual Guide)
当你加载指标后,你会看到以下几个部分:
A. 彩色主线 (The LinReg Line)
形态:一条平滑的粗线。
含义:资金流向的**“平均趋势”**。
颜色:
🟢 绿色:资金流向趋势向上(买盘主导)。
🔴 红色:资金流向趋势向下(卖盘主导)。
B. 灰色背景细线 (Raw CVD)
形态:一条充满锯齿的灰色细线,在主线周围波动。
含义:原始的、实时的累积成交量。它反应了当下的每一根K线的实际买卖差额。
C. 蓝色背景通道 (The Channel)
形态:包裹在主线周围的深蓝色带状区域。
含义:“正常波动范围”。
基于线性回归的 2倍标准差计算。
如果灰色细线在通道内运行,说明市场情绪稳定,多空力量均衡。
D. 信号点 (The Dots)
🟢 绿点 (底部出现):原始 CVD 向上突破了通道上轨。代表极度贪婪 / 抢筹。
🔴 红点 (底部出现):原始 CVD 向下跌破了通道下轨。代表极度恐慌 / 抛售。
3. 实战交易策略 (Trading Strategies)
策略一:趋势确认 (Trend Following)
这是最基础的顺势用法。
做多信号:
价格处于上升趋势(如在均线之上)。
CVD 主线由红变绿,且持续向上倾斜。
操作:这确认了价格的上涨有真金白银的买盘支持,可以持有或加仓。
做空信号:
价格处于下降趋势。
CVD 主线由绿变红,且持续向下倾斜。
操作:确认卖盘主导,价格下跌是健康的。
策略二:背离交易 (Divergence) —— 胜率最高的用法
寻找“主力资金”与“价格”不一致的地方。
顶背离 (看跌):
价格创出了新高 (Higher High)。
CVD 主线却没有创新高,或者形成更低的高点 (Lower High)。
含义:价格在涨,但买入的资金在减少。这通常是主力在通过限价单悄悄出货,或者是买盘枯竭。
操作:准备做空,或多单止盈。
底背离 (看涨):
价格创出了新低 (Lower Low)。
CVD 主线却形成了更高的低点 (Higher Low)。
含义:价格在跌,但卖出的资金在减少,或者有大资金在底部通过挂单吸筹 (Absorption)。
操作:准备做多,或空单止盈。
策略三:极端情绪反转 (Mean Reversion)
利用红绿点判断短期的超买超卖。
做多机会 (反弹):
价格快速下跌,甚至暴跌。
指标底部出现密集的红点 (Downside Extension)。
含义:恐慌盘被杀出来了 (Capitulation),市场短期内无可再卖。
操作:等待K线出现反转形态(如长下影线)后尝试博反弹。
做空机会 (回调):
价格快速拉升(垂直上涨)。
指标底部出现密集的绿点 (Upside Extension)。
含义:大量的散户在追涨 (FOMO),透支了买盘动能。
操作:等待上涨停滞后尝试做空。
4. 关键注意事项 (Limitations)
数据源区别:
TradingView 的普通 Volume 是基于 K 线的近似计算(Close > Open 算买,Close < Open 算卖)。
这与专业的 Orderflow 软件(如 Exocharts)使用的逐笔 Tick 数据有一定误差,但在 1小时/4小时 级别上,趋势方向基本一致。
建议:如果你是做合约,请务必加载 合约图表(如 BTCUSDT.P),不要用现货图表看 CVD。
红绿点的陷阱:
不要一看到绿点就做空! 在超级大单边行情(比如牛市主升浪)中,绿点会连续出现,价格会一直涨。
红绿点必须配合 关键支撑/阻力位 使用。如果在“半空中”出现绿点,往往意味着趋势加速,而不是反转。
参数调整:
默认 LinReg Length = 20。
如果你觉得反应太慢,可以改为 10 或 14。
如果你觉得假信号太多,可以改为 50,但这会牺牲灵敏度。
5. 快速检查清单 (Checklist)
在开单前,看一眼 CVD:
颜色:CVD 是绿的还是红的?和我想做的方向一致吗?
斜率:CVD 是在加速上升/下降,还是开始变平了?
背离:价格破位了,CVD 跟着破位了吗?如果没跟,就是假突破。
极值:有没有出现红点/绿点?如果出现了,是不是应该等回调再进场?
The Quantum Leap: Renko + ML(Note: This indicator uses the BackQuant & SuperTrend which takes a 4-5 seconds to load)
This strategy uses the following indicators (please see source code)
Synthetic Renko: Ignores time and focuses purely on price movement to detect clear trend reversals (Red-to-Green).
ATR (Average True Range): Measures volatility to calculate the Renko brick sizes and SuperTrend sensitivity.
Adaptive SuperTrend: A trend filter that uses volatility clustering to confirm if the market is currently in a "Bearish" state.
RSI (Relative Strength Index): A momentum gauge ensuring the asset is "Oversold" (exhausted) before we consider a setup.
Monthly Pivots: Horizontal support lines based on last month's data acting as price "floors" (S1, S2, S3).
SMA (Simple Moving Average): A 100-bar average ensuring we are strictly buying below the long-term mean (deep value).
BackQuant (KNN): A Machine Learning engine that compares current data to historical patterns to predict immediate momentum.
This is a sophisticated, multi-stage strategy script. It combines "Old School" price action (Renko) with "New School" Machine Learning (KNN and Clustering).
Here is the high-level summary of how we will break this down:
Topic 1: The "Bottom Hunter" Setup. How the script uses Renko bricks and aggressive filtering (SuperTrend, SMA, RSI, Pivots) to find a potential market bottom.
Topic 2: The ML Engine (BackQuant & SuperTrend). How the script uses K-Nearest Neighbors (KNN) to predict momentum and Volatility Clustering to adjust the SuperTrend.
Topic 3: The "Leap" Execution. How the script synchronizes the Setup (Topic 1) with the ML Trigger (Topic 2) using a time window.
Topic 1: The "Bottom Hunter" Setup
This script is designed as a Mean Reversion strategy (often called "catching a falling knife" or "bottom fishing"). It is trying to find the exact moment a downtrend stops and reverses.
Most strategies buy when price is above the 200 SMA or above the SuperTrend. This script does the exact opposite.
The Logic:
Renko Bricks: It simulates Renko bricks internally (without changing your chart view). It waits for a specific pattern: A Red Brick followed immediately by a Green Brick (a reversal).
The "Bearish" Filters: To generate a "WATCH" signal, the following must be true:
Price < SuperTrend: The market must officially be in a downtrend.
Price < SMA: Long-term trend is down.
Price < Monthly Pivot: Price is deeply discounted.
RSI < Threshold: The asset is oversold (exhausted).
Recommended Settings for daily signals for Stocks :
Confirmation : 10. (How many bars after Renko Buy signal the AI has to identify a bullish move).
Percentage : 2 (This is the Renko bar size. This represents 2% move.)
SMA: 100 (Signal must be found below 100 SMA)
Price must be below: PIVOT (This is the monthly Pivot levels)
