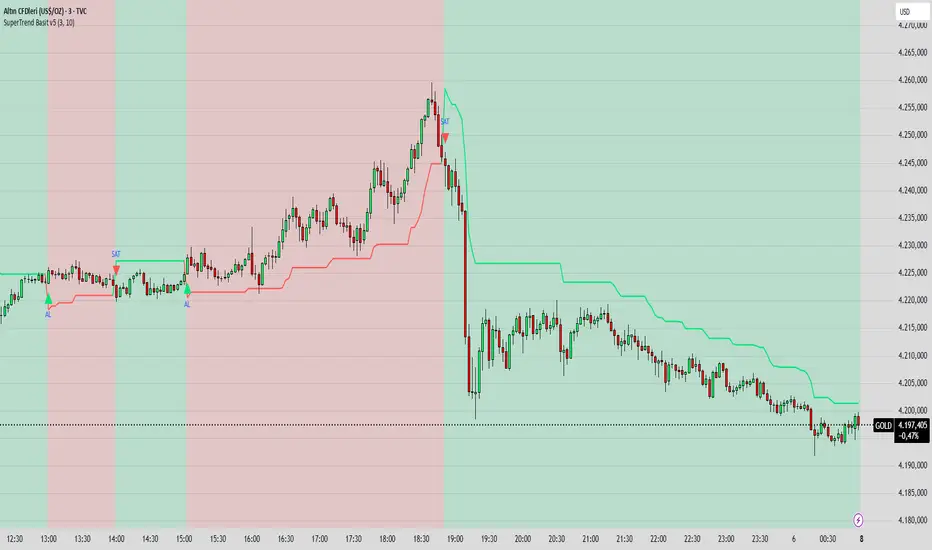
SuperTrend Basit BY İNCEBACAK//@version=5
indicator("SuperTrend Basit v5", overlay=true)
// === Girdi ayarları ===
factor = input.float(3.0, "ATR Katsayısı")
atrPeriod = input.int(10, "ATR Periyodu")
// === Hesaplamalar ===
= ta.supertrend(factor, atrPeriod)
// === Çizim ===
bodyColor = direction == 1 ? color.new(color.lime, 0) : color.new(color.red, 0)
bgcolor(direction == 1 ? color.new(color.lime, 85) : color.new(color.red, 85))
plot(supertrend, color=bodyColor, linewidth=2, title="SuperTrend Çizgisi")
// === Al/Sat sinyali ===
buySignal = ta.crossover(close, supertrend)
sellSignal = ta.crossunder(close, supertrend)
plotshape(buySignal, title="AL", location=location.belowbar, color=color.lime, style=shape.triangleup, size=size.small, text="AL")
plotshape(sellSignal, title="SAT", location=location.abovebar, color=color.red, style=shape.triangledown, size=size.small, text="SAT")
Indicadores e estratégias
VYW GapsThis is a copy of the built-in Gaps indicator with the addition of drawing untouched close prices as well.
By default the lines are drawn as dashed orange lines.

Narayan Candle Up/Down Indicator //@version=5
indicator("Candle Up/Down Indicator", overlay=true)
// Candle colors
candleColor = close > open ? color.green : close < open ? color.red : color.gray
// Plot candles as background
bgcolor(candleColor, transp=80)
// Optional: plot arrow on up/down
plotshape(close > open, title="Up Candle", location=location.belowbar, color=color.green, style=shape.triangleup, size=size.tiny)
plotshape(close < open, title="Down Candle", location=location.abovebar, color=color.red, style=shape.triangledown, size=size.tiny)

MirPapa_Lib_BoxLibrary "MirPapa_Lib_Box"
GetHTFrevised(_tf, _case)
GetHTFrevised
@description Retrieve a specific bar value from a Higher Time Frame (HTF) series.
Parameters:
_tf (string) : string The target HTF string (examples: "60", "1D").
_case (string) : string Case string determining which OHLC value to request.
@return float Returns the requested HTF value or na if _case does not match.
GetHTFrevised(_tf)
Parameters:
_tf (string)
GetHTFoffsetToLTFoffset(_offset, _chartTf, _htfTf)
GetHTFoffsetToLTFoffset
@description Adjust an HTF offset to an LTF offset by calculating the ratio of timeframes.
Parameters:
_offset (int) : int The HTF bar offset (0 means current HTF bar).
_chartTf (string) : string The current chart's timeframe (e.g., "5", "15", "1D").
_htfTf (string) : string The High Time Frame string (e.g., "60", "1D").
@return int The corresponding LTF bar index. Returns 0 if the result is negative.
GetHtfFromLabel(_label)
GetHtfFromLabel
@description Convert a Korean HTF label into a Pine Script timeframe string.
Parameters:
_label (string) : string The Korean label (e.g., "5분", "1시간").
@return string Returns the corresponding Pine Script timeframe (e.g., "5", "60").
IsChartTFcomparisonHTF(_chartTf, _htfTf)
IsChartTFcomparisonHTF
@description Determine whether a given HTF is greater than or equal to the current chart timeframe.
Parameters:
_chartTf (string) : string Current chart timeframe (e.g., "5", "15", "1D").
_htfTf (string) : string HTF timeframe (e.g., "60", "1D").
@return bool True if HTF ≥ chartTF, false otherwise.
IsCondition(_boxType, _isBull, _pricePrev, _priceNow)
IsCondition
@description FOB, FVG 조건 체크.\
_boxType: "fob"(Fair Order Block) 또는 "fvg"(Fair Value Gap).\
_isBull: true(상승 패턴), false(하락 패턴).\
상승 시 현재 가격이 이전 가격보다 높으면 true, 하락 시 이전 가격이 현재 가격보다 높으면 true 반환.
Parameters:
_boxType (string) : 박스 타입 ("fob", "fvg")
_isBull (bool) : 상승(true) 또는 하락(false)
_pricePrev (float) : 이전 가격
_priceNow (float) : 현재 가격
Returns: bool 조건 만족 여부
IsCondition(_boxType, _high2, _high1, _high0, _low2, _low1, _low0)
IsCondition
@description Sweep 조건 체크 (Swing High/Low 동시 발생).\
_boxType: "sweep" 또는 "breachBoth".\
조건: high2 < high1 > high0 (Swing High) AND low2 > low1 < low0 (Swing Low).\
중간 캔들이 양쪽보다 높고 낮은 지점을 동시에 형성할 때 true 반환.
Parameters:
_boxType (string) : 박스 타입 ("sweep", "breachBoth")
_high2 (float)
_high1 (float)
_high0 (float)
_low2 (float)
_low1 (float)
_low0 (float)
Returns: bool 조건 만족 여부
IsCondition(_boxType, _isBull, _open1, _close1, _high1, _low1, _open0, _close0, _low2, _low3, _high2, _high3)
IsCondition
@description RB (Rejection Block) 조건 체크.\
_boxType: "rb" (Rejection Block).\
상승 RB: candle1=음봉, candle0=양봉, low3>low1 AND low2>low1, close1*1.001>open0, open1close0.\
이전 캔들의 거부 후 현재 캔들이 반대 방향으로 전환될 때 true 반환.
Parameters:
_boxType (string) : 박스 타입 ("rb")
_isBull (bool) : 상승(true) 또는 하락(false)
_open1 (float)
_close1 (float)
_high1 (float)
_low1 (float)
_open0 (float)
_close0 (float)
_low2 (float)
_low3 (float)
_high2 (float)
_high3 (float)
Returns: bool 조건 만족 여부
IsCondition(_boxType, _isBull, _open2, _close1, _open1, _close0)
IsCondition
@description SOB (Strong Order Block) 조건 체크.\
_boxType: "sob" (Strong Order Block).\
상승 SOB: 양봉2 => 음봉1 => 양봉0, open2 > close1 AND open1 < close0.\
하락 SOB: 음봉2 => 양봉1 => 음봉0, open2 < close1 AND open1 > close0.\
3개 캔들 패턴으로 강한 주문 블록 형성 시 true 반환.
Parameters:
_boxType (string) : 박스 타입 ("sob")
_isBull (bool) : 상승(true) 또는 하락(false)
_open2 (float) : 2개 이전 캔들 open
_close1 (float) : 1개 이전 캔들 close
_open1 (float) : 1개 이전 캔들 open
_close0 (float) : 현재 캔들 close
Returns: bool 조건 만족 여부
CreateBox(_boxType, _tf, _isBull, _useLine, _colorBG, _colorBD, _colorText, _cache)
CreateBox
@description 박스 생성 (breachMode 자동 결정).\
_boxType: "fob", "rb", "custom" → directionalHighLow, 나머지 → both.\
_tf: 시간대 (timeframe.period 또는 HTF).\
_isBull: true(상승 박스), false(하락 박스).\
_cache: HTF 사용 시 필수, CurrentTF는 na.\
반환: .
Parameters:
_boxType (string) : 박스 타입
_tf (string) : 시간대
_isBull (bool) : 상승(true) 또는 하락(false)
_useLine (bool) : 중간선 표시 여부
_colorBG (color) : 박스 배경색
_colorBD (color) : 박스 테두리색
_colorText (color) : 텍스트 색상
_cache (HTFCache) : HTF 캐시 데이터
Returns: 성공 여부와 박스 데이터
CreateBox(_boxType, _tf, _isBull, _useLine, _colorBG, _colorBD, _colorText, _cache, _customText)
CreateBox
@description 박스 생성 (커스텀 텍스트 지원, breachMode 자동 결정).\
_boxType: "fob", "rb", "custom" → directionalHighLow, 나머지 → both.\
_customText: 박스에 표시할 텍스트 (비어있으면 "시간대 박스타입" 형식으로 자동 생성).\
_isBull: true(상승 박스), false(하락 박스).\
반환: .
Parameters:
_boxType (string) : 박스 타입
_tf (string) : 시간대
_isBull (bool) : 상승(true) 또는 하락(false)
_useLine (bool) : 중간선 표시 여부
_colorBG (color) : 박스 배경색
_colorBD (color) : 박스 테두리색
_colorText (color) : 텍스트 색상
_cache (HTFCache) : HTF 캐시 데이터
_customText (string) : 커스텀 텍스트
Returns: 성공 여부와 박스 데이터
CreateBox(_boxType, _breachMode, _tf, _isBull, _useLine, _colorBG, _colorBD, _colorText, _cache, _customText)
CreateBox
@description 박스 생성 (breachMode 명시적 지정).\
_breachMode: "both"(양쪽 모두 돌파), "directionalHighLow"(방향성 high/low 돌파), "directionalClose"(방향성 close 돌파).\
_isBull: true(상승 박스), false(하락 박스).\
_customText: 박스에 표시할 텍스트 (비어있으면 "시간대 박스타입" 형식으로 자동 생성).\
반환: .
Parameters:
_boxType (string) : 박스 타입 (fob, fvg, sweep, rb, custom 등)
_breachMode (string) : 돌파 처리 방식: "both" (양쪽 모두), "directionalHighLow" (방향성 high/low), "directionalClose" (방향성 close)
_tf (string) : 시간대
_isBull (bool) : 상승(true) 또는 하락(false) 방향
_useLine (bool) : 중간선 표시 여부
_colorBG (color) : 박스 배경색
_colorBD (color) : 박스 테두리색
_colorText (color) : 텍스트 색상
_cache (HTFCache) : HTF 캐시 데이터 (CurrentTF는 na)
_customText (string) : 커스텀 텍스트 (비어있으면 자동 생성)
Returns: 성공 여부와 박스 데이터
CreateCustomBox(_boxType, _breachMode, _isBull, _top, _bottom, _left, _right, _useLine, _colorBG, _colorBD, _colorText, _text)
CreateCustomBox
@description 완전히 유연한 커스텀 박스 생성.\
사용자가 박스 위치(top, bottom, left, right), breach mode, 모든 파라미터를 직접 지정.\
조건 체크는 사용자 스크립트에서 수행하고, 이 함수는 박스 생성만 담당.\
새로운 박스 타입 추가 시 라이브러리 수정 없이 사용 가능.
Parameters:
_boxType (string) : 박스 타입 (사용자 정의 문자열)
_breachMode (string) : 돌파 처리 방식: "both", "directionalHighLow", "directionalClose", "sobClose"
_isBull (bool) : 상승(true) 또는 하락(false) 방향
_top (float) : 박스 상단 가격
_bottom (float) : 박스 하단 가격
_left (int) : 박스 시작 시간 (xloc.bar_time 사용)
_right (int) : 박스 종료 시간 (xloc.bar_time 사용)
_useLine (bool) : 중간선 표시 여부
_colorBG (color) : 박스 배경색
_colorBD (color) : 박스 테두리색
_colorText (color) : 텍스트 색상
_text (string) : 박스에 표시할 텍스트
Returns: 성공 여부와 박스 데이터
ProcessBoxDatas(_openBoxes, _closedBoxes, _useMidLine, _closeCount, _colorClose, _currentBarIndex, _currentLow, _currentHigh, _currentTime)
ProcessBoxDatas
@description 박스 확장 및 돌파 처리.\
열린 박스들을 현재 bar까지 확장하고, 돌파 조건 체크.\
_closeCount: 돌파 횟수 (이 횟수만큼 돌파 시 박스 종료).\
breachMode에 따라 돌파 체크 방식 다름 (both/directionalHighLow/directionalClose).\
종료된 박스는 _closedBoxes로 이동하고 _colorClose 색상 적용.\
barstate.islast와 barstate.isconfirmed에서 호출 권장.
Parameters:
_openBoxes (array) : 열린 박스 배열
_closedBoxes (array) : 닫힌 박스 배열
_useMidLine (bool) : 중간선 표시 여부
_closeCount (int) : 돌파 카운트 (이 횟수만큼 돌파 시 종료)
_colorClose (color) : 종료된 박스 색상
_currentBarIndex (int) : 현재 bar_index
_currentLow (float) : 현재 low
_currentHigh (float) : 현재 high
_currentTime (int) : 현재 time
Returns: bool 항상 true
UpdateHTFCache(_cache, _tf)
UpdateHTFCache
@description HTF 데이터 캐싱 (성능 최적화).\
HTF의 OHLC 데이터를 캐싱하여 매 틱마다 request.security 호출 방지.\
_cache: 기존 캐시 (없으면 na, 첫 호출 시).\
_tf: 캐싱할 시간대 (예: "60", "1D").\
새 bar 또는 bar_index 변경 시에만 업데이트, 그 외에는 기존 캐시 반환.\
Parameters:
_cache (HTFCache) : 기존 캐시 데이터 (없으면 na)
_tf (string) : 시간대
Returns: HTFCache 업데이트된 캐시 데이터
GetTimeframeSettings(_currentTF, _midTF1m, _highTF1m, _midTF5m, _highTF5m, _midTF15m, _highTF15m, _midTF30m, _highTF30m, _midTF60m, _highTF60m, _midTF240m, _highTF240m, _midTF1D, _highTF1D, _midTF1W, _highTF1W, _midTF1M, _highTF1M)
GetTimeframeSettings
@description 현재 차트 시간대에 맞는 중위/상위 시간대 자동 선택.\
_currentTF: 현재 차트 시간대 (timeframe.period).\
1분~1월 차트별로 적절한 중위/상위 시간대 매핑.\
예: 5분 차트 → 중위 15분, 상위 60분.\
반환: .\
Parameters:
_currentTF (string) : 현재 차트 시간대
_midTF1m (string)
_highTF1m (string)
_midTF5m (string)
_highTF5m (string)
_midTF15m (string)
_highTF15m (string)
_midTF30m (string)
_highTF30m (string)
_midTF60m (string)
_highTF60m (string)
_midTF240m (string)
_highTF240m (string)
_midTF1D (string)
_highTF1D (string)
_midTF1W (string)
_highTF1W (string)
_midTF1M (string)
_highTF1M (string)
Returns:
BoxData
BoxData
Fields:
_type (series string) : 박스 타입 (fob, fvg, sweep, rb, custom 등)
_breachMode (series string) : 돌파 처리 방식
_isBull (series bool) : 상승(true) 또는 하락(false) 방향
_box (series box)
_line (series line)
_boxTop (series float)
_boxBot (series float)
_boxMid (series float)
_topBreached (series bool)
_bottomBreached (series bool)
_breakCount (series int)
_createdBar (series int)
HTFCache
Fields:
_timeframe (series string)
_lastBarIndex (series int)
_isNewBar (series bool)
_barIndex (series int)
_open (series float)
_high (series float)
_low (series float)
_close (series float)
_open1 (series float)
_close1 (series float)
_high1 (series float)
_low1 (series float)
_open2 (series float)
_close2 (series float)
_high2 (series float)
_low2 (series float)
_high3 (series float)
_low3 (series float)
_time1 (series int)
_time2 (series int)

Silver 30m HUD — Trend / Flow / PB / VWAP / TurboSilver 30m HUD is a streamlined Pine Script v5 indicator optimized exclusively for 30-minute silver futures (SIL) charts on TradingView. It displays a compact 2-column middle-right table analyzing trend, flow, momentum, pullback, VWAP, turbo, and final signals with safety stars and risk warnings. Enforces 30m timeframe usage via label alert on other periods.
Key Engines
Trend Fusion
Combines 30m (close vs SMA60) with 2H higher timeframe for UP/DOWN/FLAT consensus; MIXED on divergence. Serves as primary directional filter.
Flow Detection
Identifies volume surges (>2.2x 20-period SMA) as BULL/BEAR SURGE, else defaults to candle direction (UP/DOWN). Captures aggressive buying/selling pressure.
Momentum Composite
QQE/RSI/MFI blend: both >55 = UP, both <45 = DOWN, otherwise EXHAUST. Flags overextended moves.
Pullback Safety
Rates position vs SMA20/50: above both = OK, above 20 but below 50 = Weak, below both = Danger. Prevents chasing extended trends.
VWAP & Turbo
Price vs session VWAP (UP/DOWN); turbo flags >1% candle moves as UP/DOWN acceleration or EXHAUST.
Signals & Risk
Final Signal Logic
BUY requires UP trend + OK PB + UP VWAP + no DOWN mom; SELL needs DOWN trend + non-OK PB + DOWN VWAP; EXHAUST mom = CHOP; else WAIT.
Safety Ratings
BUY stars: 5🟩 (perfect confluence), 3🟩 (basic BUY); SELL: 4🟥 (full signal), 3🟥 (exhaustion).
Risk Alert
Triggers ⚠️ on BUY signals with 2H DOWN trend and <0.20 from resistance (distR), warning multi-timeframe conflict + overhead supply. Displays S/R levels and distances in mintick format.
HUD Layout
12-row table prioritizes scannability: metrics left (gray), statuses right (color-coded green/red/gray), bottom shows Dist to R/S, levels, and RISK. Ideal for quick 30m SIL scalping decisions balancing confluence and safety.

BuLLzEyE_MNQ FVG/IFVG SystemFVG Boxes
These are the main trading zones. The indicator automatically detects Fair Value Gaps and draws boxes on your chart:
• GREEN boxes = Bullish FVG (potential buy zone)
• RED boxes = Bearish FVG (potential sell zone)
• YELLOW boxes = IFVG (Inverse FVG - filled gaps that now act as support/resistance)
• GRAY boxes = Mitigated FVG (gap has been filled)
• WHITE dashed line = 50% level (optimal entry point within the FVG)
Session Boxes
Session boxes show you the high/low range of each major trading session. This helps identify where liquidity sits:
• PURPLE = Asia Session (6:00 PM - 3:00 AM ET)
• BLUE = London Session (3:00 AM - 12:00 PM ET)
• ORANGE = New York Session (9:30 AM - 4:00 PM ET)
• TEAL = Sydney Session (5:00 PM - 2:00 AM ET)
• LIME GREEN = Kill Zone / London-NY Overlap (8:00 AM - 11:00 AM ET) - BEST TRADING TIME
Entry Signals
• GREEN triangle pointing UP = Long entry signal at a Bullish FVG (not 100% reliable)
• RED triangle pointing DOWN = Short entry signal at a Bearish FVG (not 100% reliable)
Liquidity Sweeps
• RED X with 'SWEEP' = Previous Day High (PDH) was swept
• GREEN X with 'SWEEP' = Previous Day Low (PDL) was swept
• Dotted lines = PDH (red) and PDL (green) levels
Information Tables
HTF Bias Table (Top Right): Shows whether the higher timeframe (default 15m) is bullish or bearish, the number of active FVGs, and whether you're in the trading session.
Risk Calculator Table (Bottom Right): Shows your risk amount and calculates how many contracts you can trade for different stop loss sizes (5pt, 10pt, 15pt).
How It Works
What is a Fair Value Gap?
A Fair Value Gap (FVG) is a 3-candle pattern where aggressive buying or selling creates a price void. Specifically, it's when the wick of the first candle doesn't overlap with the wick of the third candle, leaving a gap in between. Price tends to return to these gaps to 'rebalance' before continuing in the original direction.
What is an Inverse FVG?
When an FVG gets filled (price returns and closes through the gap), it becomes an Inverse FVG (IFVG). These zones flip their polarity - a filled Bullish FVG becomes resistance, and a filled Bearish FVG becomes support. The indicator automatically converts mitigated FVGs to yellow IFVG boxes.
The 50% Entry Level
The dashed white line in each FVG represents the 50% level (also called Consequent Encroachment). This is considered the optimal entry point - it's the middle of the imbalance where price is most likely to react.
Suggested Trading Strategy
1. Check HTF Bias (top right table) - only trade in that direction
2. Wait for a liquidity sweep (SWEEP label appears)
3. Look for an FVG to form AFTER the sweep
4. Enter when price returns to the 50% level (dashed line)
5. Place stop loss below/above the FVG (add 2 ticks buffer)
6. Take profit at 1:2 or 1:3 risk-to-reward ratio
Settings Explained
FVG Settings
• Min FVG Size: Minimum gap size in points to be considered valid (default: 2.0)
• Max FVG Age: How many bars until an FVG is removed from chart (default: 50)
• Show 50% Entry Level: Toggle the dashed entry line on/off
Session Settings
• Show Session Boxes: Toggle all session boxes on/off
• Max Sessions to Show: How many historical sessions to display (default: 5)
• Individual Session Toggles: Turn each session (Asia/London/NY/Sydney/Kill Zone) on or off
Risk Calculator Settings
• Account Size: Your trading account balance
• Risk Per Trade: Percentage of account to risk per trade (default: 0.5%)
• Tick Value/Size: Contract specifications for MNQ ($0.50 per tick, 0.25 point tick size)
Tips for Best Results
1. Trade during the Kill Zone (8:00-11:00 AM ET) for best volatility and liquidity
2. Always align trades with HTF bias - don't fight the trend
3. Wait for liquidity sweeps before entering - this confirms smart money activity
4. Use the 50% level for entries - it offers the best risk-to-reward
5. Watch for IFVG zones as additional confluence for entries
6. Use the risk calculator to size positions properly - never risk more than you can afford
7. Session boxes help identify where stops are clustered - sweeps of these levels often precede reversals
Available Alerts
• New FVG Formed (Bullish or Bearish)
• Price Touching 50% Entry Level
• FVG Mitigated (gap filled)
• Long Entry Signal
• Short Entry Signal
• PDH/PDL Liquidity Sweep
─────────────────────────────────────
Created by BullyTrading
Designed for MNQ Prop Firm Trading

Gemini Hibrit Avcı (Supertrend + StochRSI)SupertrendOption 1: Natural & Conversational (Best Match for Original Tone)
This version captures the explanatory, "speaking to a friend" vibe of your Turkish text.
Supertrend: When you look at the chart, you'll see Green or Red clouds in the background. This basically tells you, "Should you only be thinking about buying right now, or selling?"
Stoch RSI: You know how the price sometimes makes a correction (drops slightly) even when the Supertrend is green? This indicator catches the exact moment that correction ends and the price starts heading back up (the K and D crossover).
EMA 200 Filter: This comes enabled by default in your settings. It means: "If the price is below the 200-day average, do not—under any circumstances—enter a trade, even if the Supertrend gives a BUY signal." This protects you from fake rallies (bull traps) during a bear market.

Chaos Volatility Breakout (ATR + Breakout)-VMThis indicator is a volatility-based breakout trading tool inspired by principles from Chaos Theory, where small changes in momentum during high-energy market conditions can lead to large price movements.
Instead of predicting the market, it focuses on identifying “high-probability expansion zones”—moments when the market is under stress (high volatility) and price is breaking out of a recent range.


ALEX - ATR Extensions + ADR + Table + Position SizingALEX - ATR Extensions + ADR + Table + Position Sizing

MTF S/R Array - Full CustomA clean, institutional-style multi-timeframe support and resistance indicator designed for precision trading decisions. Plots previous and current period levels with full customization for backtesting and live trading.
━━━━━━━━━━━━━━━━━━━━━━
WHAT IT PLOTS
━━━━━━━━━━━━━━━━━━━━━━
MONTHLY
- Previous Month High / Low / Close
- Previous Month Highest Closing Price
- Current Month High / Low / Highest Close
WEEKLY
- Previous Week High / Low / Close
- Current Week High / Low
DAILY
- Previous Day High / Low / Close
- Current Day High / Low
SESSIONS (Full Session - EST)
- Asian: 7pm - 4am
- London: 3am - 12pm
- New York: 8am - 5pm
OPENING RANGE
- Monday/Tuesday combined high and low
- Clean box visualization for weekly initial balance
━━━━━━━━━━━━━━━━━━━━━━
WHY THESE LEVELS MATTER
━━━━━━━━━━━━━━━━━━━━━━
Institutions and smart money reference these key levels for:
- Liquidity targets
- Stop hunts
- Reversal zones
- Trend continuation entries
Previous period levels act as magnets for price. Current levels show where the battle is happening now.
━━━━━━━━━━━━━━━━━━━━━━
FULL CUSTOMIZATION
━━━━━━━━━━━━━━━━━━━━━━
Every level type has independent controls:
- Show/Hide Previous and Current separately
- Extend Bars - control how far each level stretches
- Line Width - adjust thickness per level
- Transparency - fade previous levels for clarity
- Colors - separate colors for High/Low vs Close
Additional settings:
- Labels on/off with size and style options
- Info table with position and size controls
- Opening range box transparency and border width
━━━━━━━━━━━━━━━━━━━━━━
HOW TO USE
━━━━━━━━━━━━━━━━━━━━━━
1. Use on lower timeframes (1m, 5m, 15m) to see HTF levels
2. Watch for price reactions at previous period highs/lows
3. Look for session high/low sweeps followed by reversals
4. Use Monday/Tuesday opening range for weekly bias and targets
5. Previous levels extend further back for backtesting context
━━━━━━━━━━━━━━━━━━━━━━
TIPS
━━━━━━━━━━━━━━━━━━━━━━
- Increase "Prev Extend Bars" on monthly/weekly to see levels across more history
- Use higher transparency on previous levels to keep chart clean
- Turn off sessions you don't trade to reduce clutter
- The info table shows all values at a glance - position it where it doesn't block price action
━━━━━━━━━━━━━━━━━━━━━━
BEST FOR
━━━━━━━━━━━━━━━━━━━━━━
- ICT / Smart Money Concepts traders
- Session-based strategies
- Swing traders using HTF levels on LTF entries
- Anyone who wants clean, customizable S/R levels
Works on Forex, Crypto, Stocks, Futures, and Indices.

MC2 Daily Screener//@version=5
indicator("MC2 Daily Screener", overlay = false)
// 🔹 Inputs
relVolThresh = input.float(2.0, "RelVol Threshold")
rangeMult = input.float(2.0, "Range Multiplier")
lookback = input.int(20, "Lookback Bars")
// 🔹 Calculations
relVol = volume / ta.sma(volume, lookback)
rangeNow = high - low
rangeAvg = ta.sma(rangeNow, lookback)
// 🔥 MC² condition
mc2 = relVol > relVolThresh and rangeNow > rangeAvg * rangeMult
// 🔹 Convert to numeric (1 = signal, 0 = none)
mc2Value = mc2 ? 1.0 : 0.0
// This plot is what Pine Screener will use as a column/filter
plot(mc2Value, title = "MC2", style = plot.style_columns)
// Optional: alert so you can also use alertconditions in the Screener
alertcondition(mc2, title = "MC2 Signal", message = "MC2 signal on {{ticker}} ({{interval}})")

Mason Breakout Engine v1.0//@version=5
indicator("MC2 Pine Screener", overlay=false)
// Inputs
relVolThresh = input.float(2.0)
rangeMult = input.float(2.0)
lookback = input.int(20)
// Calculations
relVol = volume / ta.sma(volume, lookback)
rangeNow = high - low
rangeAvg = ta.sma(rangeNow, lookback)
// Signal
mc2 = relVol > relVolThresh and rangeNow > rangeAvg * rangeMult
// Screener export (1 or 0)
export = mc2

Next Day CPRnext day cpr for pivot, s1, s3, r1, s3 of the next day cpr. next day cpr for pivot, s1, s3, r1, s3 of the next day cpr.

T Minus 4 HoursSupport and Resistance is a large part of price structure. However many complicate it with increasing exotic (and often valueless) derivatives and permutations.
This is very simple, it plots the high and low of the first 4 hours of the day. Think of it as a frame of reference, if the day is mean reversion or neutral (about 70% of the time) price bounces around these levels quite frequently.
If price travels to the bottom of the box, and moves below, and then re-enters the box, hit the buy button. If price travels to the top of the box, and moves above, and then re-enters the box, hit the sell button.
If price travels down to the bottom of the box, and moves below, and then tests the box, if that test fails and price continues down - hit the sell button.
If price travels up to the top of the box, and move above, and then tests the box, if that test fails and price continues up - hit the buy button.

Daily High-Low-Open + LabelsSimple PDH/PDL/DO indicator. It is in horizontal line form and it includes labels. So you don't have to place them daily yourself. Updates on its own every single day.

Back to the FutureSupport and Resistance is a large part of price structure. However many complicate it with increasing exotic (and often valueless) derivatives and permutations.
This is very simple, it plots the high and low of yesterday. Think of it as a frame of reference, if the day is mean reversion or neutral (about 70% of the time) price bounces around these levels quite frequently.
If price travels to the bottom of the box, and moves below, and then re-enters the box, hit the buy button. If price travels to the top of the box, and moves above, and then re-enters the box, hit the sell button.
If price travels down to the bottom of the box, and moves below, and then tests the box, if that test fails and price continues down - hit the sell button.
If price travels up to the top of the box, and move above, and then tests the box, if that test fails and price continues up - hit the buy button.

P_NQ Futures Daily Bias & Structure ProOverview The Master Sniper is a professional-grade execution system designed for high-volatility assets like NQ (Nasdaq 100) and ES (S&P 500). Unlike standard indicators that generate blind signals, this script uses a Multi-Timeframe Logic Engine to first establish a daily bias and then hunt for specific intraday triggers.
It features a Hybrid Strategy that can automatically switch between Trend Following (Smart Money Concepts) and Mean Reversion (Gap Fades), giving you a complete toolkit for any market condition.
Key Features
1. Macro Bias Engine (The Filter) Before generating any signal, the script analyzes the Daily Chart in the background:
Structure: Checks for Higher Highs/Lows vs. Lower Highs/Lows.
Momentum: Uses RSI and the 200 EMA to ensure you aren't buying the top or selling the bottom.
Result: It generates a directional bias (Bullish/Bearish) that filters out low-probability trades.
2. Hybrid Entry Logic
Trend Mode (SMC): Identifies Fair Value Gaps (FVG) within "Discount" or "Premium" zones. It only triggers if the price pulls back into a value area aligned with the Daily Bias.
Reversal Mode (Elasticity): Detects when price is over-extended (2.0 Standard Deviations from VWAP) or when a "Liquidity Sweep" occurs, signaling a snap-back trade.
Gap Rejection (Morning Fade): A dedicated engine that monitors the Opening Gap. If the market gaps significantly but fails to hold, it triggers a "Fade" trade to target the gap fill.
3. Professional Trade Management Visualizes your trade plan instantly on the chart:
Split Targets: Draws targets for Contract 1 (Scalp) and Contract 2 (Runner).
Auto-Break Even: The moment TP1 is hit, the Stop Loss line visually moves to your Entry Price, signaling a "Risk-Free" trade.
Infinite Target Lines: Extends target lines to the right until the trade concludes, keeping your chart clean.
4. Risk Filters
Range Filter: Prevents buying in the Top 1/3 or selling in the Bottom 1/3 of the daily range.
Proximity Filter: Blocks trades that are squeezing too tight against the 100-candle High/Low.
How to Use
Timeframe: Optimized for the 5-Minute (5m) chart on Futures (NQ/ES) or Tech Stocks.
Dashboard: Check the bottom-right panel. Ensure "Status" says "SCANNING" and Filters show "Active."
Execution: Wait for the alert (e.g., "🟢 ENTER LONG"). Place your orders at the Blue Line with SL at the Red Line.

Session Candle Hunter 🎯🎯 Session Candle Hunter — Precision Session Mapping for Smart Traders
Session Candle Hunter 🎯 is a powerful tool designed to help traders identify and track the most important session candle of the trading day—commonly used for liquidity grabs, range mapping, volatility zones, and breakout anticipation.
Whether you trade NY session, London session, or custom time windows, this indicator automatically detects the candle at your chosen New York Time, extracts its high and low, and visually projects these levels into the current session.
🔍 What This Indicator Does
1️⃣ Detects the Key Session Candle
You select:
Hour of the candle (NY Time)
Candle timeframe (1H, 4H, 15m, etc.)
The script automatically:
Identifies the candle when it forms
Stores its High/Low
Prepares levels for visual projection
🎨 2️⃣ Highlights the Candle Zone
Optionally displays a colored zone (box) between the candle’s high and low:
Helps visualize the liquidity pocket
Useful for session traps, expansion moves, and fair value interpretation
You can choose:
Zone color
Whether to show it or not
Whether it should update only for the latest candle
📈 3️⃣ Draws High/Low Lines With Extensions
High and Low of the detected candle can be plotted as:
Standard lines
Or infinitely extended to the right
Great for identifying:
Breakouts
Retests
Range boundaries
Session expansion models
Optional labels display exact price levels.
🕐 4️⃣ Delayed Display Logic
The indicator only shows levels after a user-defined NY time.
For example:
Show lines only after 8:30 NY — perfect for traders who want pre-session levels hidden until relevant.
🔄 5️⃣ “Show Only Last” Mode
A clean, uncluttered mode that removes all historical drawings and only displays:
The latest zone
The latest high/low lines
Latest labels
Perfect for minimal-chart traders.
⚠️ 6️⃣ Alert System
Receive alerts the moment the targeted session candle forms:
“New Candle Detected”
🧾 7️⃣ Info Panel (Top-Left Corner)
Displays:
Target session hour
Display start time
Candle timeframe
Stored High/Low
Indicator name
Always visible and automatically updates.
⭐ Why Traders Love This Tool
✔ Helps visualize major liquidity zones
✔ Works on all markets & timeframes
✔ Perfect for ICT-style session concepts
✔ Helps anticipate session expansion
✔ Automates manual level drawing
✔ Clean visuals with optional minimal mode

One Point Global Net Liquidity The "Fuel" Behind the MarketMost traders look at price action, but price is often just a reflection of the money supply available in the system. This indicator tracks Global Net Liquidity—the actual amount of fiat currency available to flow into risk assets like Crypto and Equities.
Unlike standard "Money Supply" (M2) charts, this indicator focuses on Central Bank Balance Sheets, which is a more direct proxy for "Quantitative Easing" (QE) and "Quantitative Tightening" (QT).
How It Works (The Formula)
This script aggregates the balance sheets of the "Big 4" Central Banks, which represent ~90% of global liquidity. It automatically converts all values to USD Trillions for a standardized view.
{Global Liquidity} = {US Net Liquidity} + {ECB} + {PBoC} + {BoJ}
1. US Net Liquidity (The "Trader's" Formula) We do not just use the Fed's Total Assets. We subtract the money that is "stuck" outside the private economy:
(+) Fed Balance Sheet: Total Assets.
(-) TGA (Treasury General Account): The government's checking account. When this goes up, liquidity is drained from markets.
(-) RRP (Reverse Repo): Money parked by banks at the Fed overnight. When this goes up, liquidity is removed from the system.
2. Global Additions
ECB (Eurozone): Converted to USD.
PBoC (China): Converted to USD.
BoJ (Japan): Converted to USD.
How to Use This Indicator This indicator is designed as an Overlay on the main chart (using the Left Scale).
Correlation: Generally, when the Orange Line (Liquidity) trends up, Bitcoin and the S&P 500 trend up. When Central Banks tighten (line down), risk assets struggle.
The "Divergence" Signal (Alpha):
Bullish: If Price makes a Lower Low but Liquidity makes a Higher Low, it often signals seller exhaustion and a potential bottom.
Bearish: If Price makes a New High but Liquidity fails to follow (or drops), the rally may be unsupported and prone to a reversal.
Settings
Scale: This indicator is pinned to the Scale Left to allow it to overlay price action without distortion.
Data: Uses daily data from ECONOMICS and FRED feeds.

TWAP (Weekly 1700CTsun)This is a weekly TWAP anchored from the weekly futures open. This works well with the TWAP Oscillator, which is based on the daily TWAP, for entering at the larger weekly points.

Multi-Condition Alert System d//@version=5
indicator("Multi-Condition Alert System", shorttitle="MC Alert", overlay=false)
// Timeframe check - Set to 10 minutes
isCorrectTF = timeframe.isintraday and timeframe.multiplier == 10
// EMA Calculations
ema9 = ta.ema(close, 9)
ema21 = ta.ema(close, 21)
ema50 = ta.ema(close, 50)
// MACD Calculations
= ta.macd(close, 12, 26, 9)
// RSI Calculations
rsiValue = ta.rsi(close, 14)
// Define RSI levels (you can adjust these based on your violet/yellow lines)
// Assuming violet is above 50 and yellow is below 50
rsiVioletLevel = 50 // Adjust based on your actual levels
rsiYellowLevel = 50 // Adjust based on your actual levels
// Conditions
emaCondition = ema9 > ema21 and ema9 > ema50
macdCondition = macdLine > signalLine
rsiCondition = rsiValue > rsiVioletLevel and rsiValue > rsiYellowLevel
// All conditions must be true
buySignal = emaCondition and macdCondition and rsiCondition and isCorrectTF
// Plotting for visualization
plot(ema9, color=color.blue, title="EMA 9")
plot(ema21, color=color.orange, title="EMA 21")
plot(ema50, color=color.red, title="EMA 50")
plot(macdLine, color=color.blue, title="MACD Line", style=plot.style_line)
plot(signalLine, color=color.orange, title="Signal Line", style=plot.style_line)
hline(rsiVioletLevel, "RSI Violet Level", color=color.purple)
hline(rsiYellowLevel, "RSI Yellow Level", color=color.yellow)
plot(rsiValue, color=color.white, title="RSI")
// Plot buy signals
plotshape(buySignal ? 1 : na, title="Buy Signal", location=location.bottom,
color=color.green, style=shape.triangleup, size=size.small)
// Alert condition
if buySignal
alert("BUY SIGNAL: EMA 9 > EMA 21 & 50, MACD blue > orange, RSI above levels", alert.freq_once_per_bar)
// Table display
var table signalTable = table.new(position.top_right, 1, 5, bgcolor=color.black,
border_width=1)
if barstate.islast
table.cell(signalTable, 0, 0, "10min TF Check:",
text_color=isCorrectTF ? color.green : color.red)
table.cell(signalTable, 0, 1, "EMA 9 > 21 & 50:",
text_color=emaCondition ? color.green : color.red)
table.cell(signalTable, 0, 2, "MACD Blue > Orange:",
text_color=macdCondition ? color.green : color.red)
table.cell(signalTable, 0, 3, "RSI Condition:",
text_color=rsiCondition ? color.green : color.red)
table.cell(signalTable, 0, 4, "BUY SIGNAL:",
text_color=buySignal ? color.green : color.red)

Levels from NY Open and SettlementThis indicator draws a line from the high and low of the 30 second candle at 14:59:30CT, and extends the lines for 24 hours.
It draws another high low from the 8:30CT 30 second opening candle and extends them for the full 24 to the next NY open, plus another 6.5 hours until the next settlement time at 14:59:30CT.
This gives a very long liquidity box starting from the 30 second candle of the NY open, and a shorter liquidity box starting from the 30 second candle of settlement time.
