EMA + Sessions + RSI This is a simple on-demand indicator. It includes 3 customizable exponential moving averages, three customizable market sessions, and a table showing the status of the RSI
-3 Custom EMAs
-3 Custom Sessions
-1 RSI Table
Indicadores e estratégias

Équilibre du Sentiment – Multi-Périodes (v6)
English
A unique and advanced sentiment indicator based on the harmonic mean of highs and lows over nested rolling windows.
How it works:
The neutral sentiment point is reached when positive sentiment equals negative sentiment, which corresponds to the situation where the percentage between the price and the minimum is equal to the percentage between the maximum and the price.
For each chosen period N, the script calculates N different "neutral feeling" values:
- One using the last 1 bar
- One using the last 2 bars
- …
- One using the last N bars
It then extracts the exact median of these N values using a sorted insertion method (no approximation).
This produces an extremely smooth, non-repainting equilibrium line that represents the true "central sentiment" of the market over the selected lookback.
Features:
- Up to 3 independent periods (365, 52, 26 by default – fully customizable)
- Optional background coloring (green/red) when price is above/below the main curve
- Clean labels on the last bar showing the current value for each active period
- Zero repainting – fully compatible with strategies and alerts
- Highly responsive even with very long periods (up to 3500 bars)
Great for:
- Identifying long-term fair value / equilibrium zones
- Building mean-reversion or breakout systems
Pure Pine Script® v6 – no external libraries, no security calls, no repainting-free.


PVV StochRSI TrendAnother Price, Volume, Volatility Trend indicator. This one has an RSI factor to it.
Have fun and change what you want.
Adjusting the inputs to the timeframe traded on is encouraged.

ONLY FOR EUR/USD : EMA9/EMA20 + RSI + MACD + Fibonacci (v6) FOR PAIRS WHICH HAS A MOMENTUM , trade only using manually not algo , use proper RR.
good luck


MFI Volume Profile [Kodexius]The MFI Volume Profile indicator blends a classic volume profile with the Money Flow Index so you can see not only where volume traded, but also how strong the buying or selling pressure was at those prices. Instead of showing a simple horizontal histogram of volume, this tool adds a money flow dimension and turns the profile into a price volume momentum heat map.
The script scans a user controlled lookback window and builds a set of price levels between the lowest and highest price in that period. For every bar inside that window, its volume is distributed across the price levels that the bar actually touched, and that volume is combined with the bar’s MFI value. This creates a volume weighted average MFI for each price level, so every row of the profile knows both how much volume traded there and what the typical money flow condition was when that volume appeared.
On the chart, the indicator plots a stack of horizontal boxes to the right of current price. The length of each box represents the relative amount of volume at that price, while the color represents the average MFI there. Levels with stronger positive money flow will lean toward warmer shades, and levels with weaker or negative money flow will lean toward cooler or more neutral shades inside the configured MFI band. Each row is also labeled in the format Volume , so you can instantly read the exact volume and money flow value at that level instead of guessing.
This gives you a detailed map of where the market really cared about price, and whether that interest came with strong inflow or outflow. It can help you spot areas of accumulation, distribution, absorption, or exhaustion, and it does so in a compact visual that sits next to price without cluttering the candles themselves.
Features
Combined volume profile and MFI weighting
The indicator builds a volume profile over a user selected lookback and enriches each price row with a volume weighted average MFI. This lets you study both participation and money flow at the same price level.
Volume distributed across the bar price range
For every bar in the window, volume is not assigned to a single price. Instead, it is proportionally distributed across all price rows between the bar low and bar high. This creates a smoother and more realistic profile of where trading actually happened.
MFI based color gradient between 30 and 70
Each price row is colored according to its average MFI. The gradient is anchored between MFI values of 30 and 70, which covers typical oversold, neutral and overbought zones. This makes strong demand or distribution areas easier to spot visually.
Configurable structure resolution and depth
Main user inputs are the lookback length, the number of rows, the width of the profile in bars, and the label text size. You can quickly switch between coarse profiles for a big picture and higher resolution profiles for detailed structure.
Numeric labels with volume and MFI per row
Every box is labeled with the total volume at that level and the average MFI for that level, in the format Volume . This gives you exact values while still keeping the visual profile clean and compact.
Calculations
Money Flow Index calculation
currentMfi is calculated once using ta.mfi(hlc3, mfiLen) as usual,
Creation of the profileBins array
The script creates an array named profileBins that will hold one VPBin element per price row.
Each VPBin contains
volume which is the total volume accumulated at that price row
mfiProduct which is the sum of volume multiplied by MFI for that row
The loop;
for i = 0 to rowCount - 1 by 1
array.push(profileBins, VPBin.new(0.0, 0.0))
pre allocates a clean structure with zero values for all rows.
Finding highest and lowest price across the lookback
The script starts from the current bar high and low, then walks backward through the lookback window
for i = 0 to lookback - 1 by 1
highestPrice := math.max(highestPrice, high )
lowestPrice := math.min(lowestPrice, low )
After this loop, highestPrice and lowestPrice define the full price range covered by the chosen lookback.
Price range and step size for rows
The code computes
float rangePrice = highestPrice - lowestPrice
rangePrice := rangePrice == 0 ? syminfo.mintick : rangePrice
float step = rangePrice / rowCount
rangePrice is the total height of the profile in price terms. If the range is zero, the script replaces it with the minimum tick size for the symbol. Then step is the price height of each row. This step size is used to map any price into a row index.
Processing each bar in the lookback
For every bar index i inside the lookback, the script checks that currentMfi is not missing. If it is valid, it reads the bar high, low, volume and MFI
float barTop = high
float barBottom = low
float barVol = volume
float barMfi = currentMfi
Mapping bar prices to bin indices
The bar high and low are converted into row indices using the known lowestPrice and step
int indexTop = math.floor((barTop - lowestPrice) / step)
int indexBottom = math.floor((barBottom - lowestPrice) / step)
Then the indices are clamped into valid bounds so they stay between zero and rowCount - 1. This ensures that every bar contributes only inside the profile range
Splitting bar volume across all covered bins
Once the top and bottom indices are known, the script calculates how many rows the bar spans
int coveredBins = indexTop - indexBottom + 1
float volPerBin = barVol / coveredBins
float mfiPerBin = volPerBin * barMfi
Here the total bar volume is divided equally across all rows that the bar touches. For each of those rows, the same fraction of volume and volume times MFI is used.
Accumulating into each VPBin
Finally, a nested loop iterates from indexBottom to indexTop and updates the corresponding VPBin
for k = indexBottom to indexTop by 1
VPBin binData = array.get(profileBins, k)
binData.volume := binData.volume + volPerBin
binData.mfiProduct := binData.mfiProduct + mfiPerBin
Over all bars in the lookback window, each row builds up
total volume at that price range
total volume times MFI at that price range
Later, during the drawing stage, the script computes
avgMfi = bin.mfiProduct / bin.volume
for each row. This is the volume weighted average MFI used both for coloring the box and for the numeric MFI value shown in the label Volume .

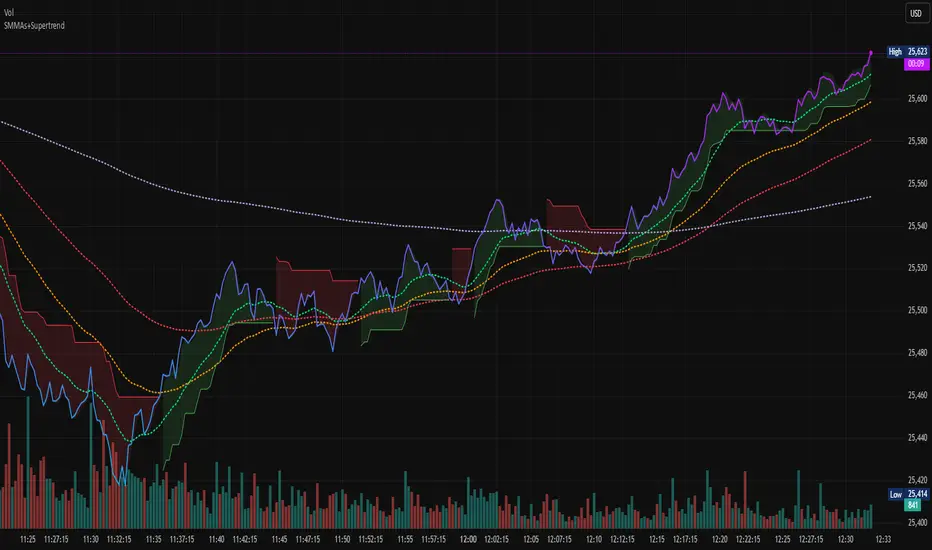
Hash SupertrendHash Supertrend is a visually enhanced Supertrend-based indicator designed by Hash Capital Research, tuned specifically for crypto trend trading on Solana (SOL) and Bitcoin (BTC). It combines institutional-style color coding, an optional session time filter, and production-ready alerts for systematic and discretionary traders alike.
What This Indicator Is
Hash Supertrend is a trend-following volatility band indicator built on TradingView’s native ta.supertrend() function.
It’s optimized and visually styled for:
High-volatility crypto pairs (especially SOL/USDT, SOL/USD, BTC/USDT, BTC/USD)
Timeframes typically used by crypto traders (from 5m scalping to 4H swing and 1D trend following)
The script is an indicator, not a strategy:
It does not place trades or show backtest results.
It provides clear trend states, flips, and alerts that you can plug into your own execution stack or manual trading.
Key Features
✅ Tuned for Crypto (Solana & Bitcoin)
Parameters are chosen to respond well to the volatility profile of SOL and BTC, reducing noise while still catching strong moves.
✅ Non-repainting Supertrend Core
Uses TradingView’s built-in ta.supertrend — values may move intrabar as the bar forms, but once a bar closes, the historical line and signals do not repaint.
✅ Fluorescent Trend Visualization
Bright green for bullish phases
Bright red for bearish phases
Adaptive color intensity based on user setting
✅ Glow Layer & Trend Zones
Glow effect around the Supertrend line for instant visual recognition
Optional filled zones between price and line for “trend cloud” style visualization
✅ Time Filter (Session Control)
Option to only mark signals during specific hours for those wanting to integrate with webhooks
Designed for traders who avoid certain sessions (e.g., low-liquidity hours)
✅ Signal Dots & Alerts
Tiny green dots for bullish flips
Tiny red dots for bearish flips
Professional, preconfigured alerts for:
Long Entry
Short Entry
Any Trend Change
Filtered signals outside trading hours (for monitoring only)
The core logic is built on:
ATR Length (ATR Length) Default: 16
Lower values (7–10): more sensitive, more signals, more noise
Higher values (12–20): smoother, fewer but stronger trend signals
Factor (Factor) Default: 3.11
Lower values (1.5–2.5): tighter bands, earlier entries, higher whipsaws
Higher values (3.0–4.0+): wider bands, later entries, stronger trend confirmation
The indicator reads direction from ta.supertrend and classifies:
Bullish Trend: direction < 0
Bearish Trend: direction > 0
A trend flip happens when direction changes sign:
longSignal: Supertrend flips from above price to below price (bearish → bullish)
shortSignal: Supertrend flips from below price to above price (bullish → bearish)

PVV Trend Line (Lower Study)Doing my best to create something is uses rate of change on the Price, volume, and volatility. I know it's not perfect, but it does it's job for me.
It's useful use it, if it's not then don't.
You will need to change settings for the time frame you want to trade on.
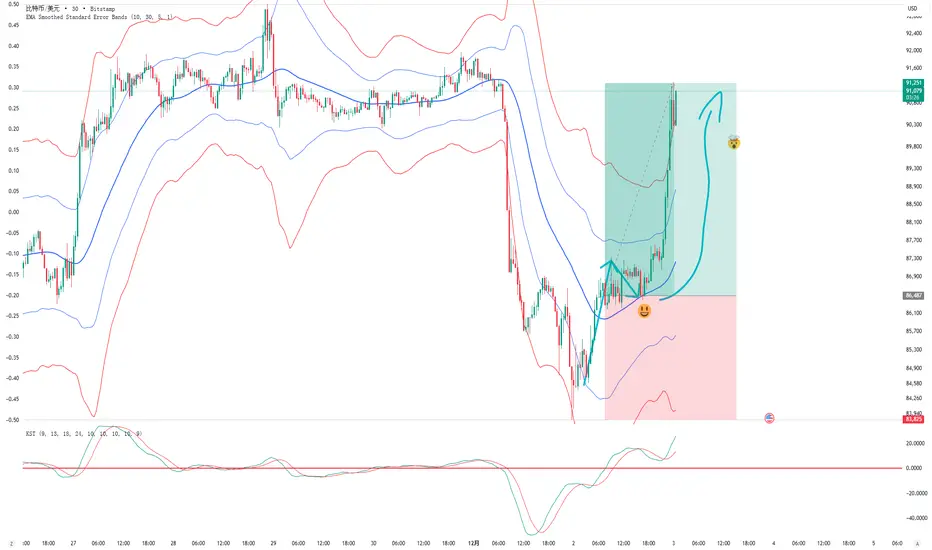
EMA Smoothed Standard Error Bands-zrbb-EMA Smoothed Standard Error Bands-zrbb-
The Standard Error Bands (SEM) indicator is primarily used in market analysis to measure price volatility, assess trend strength, and identify potential market reversals or consolidation zones. Similar to Bollinger Bands, it is typically based on linear regression lines rather than simple moving averages, providing traders with a visual range of price fluctuations around its average trend.
Specific functions include:
* Measuring Volatility: The width of the SEM directly reflects market volatility. When price trends are stable, the bandwidth typically contracts, indicating that data points are clustered around the mean; conversely, when market volatility increases, the bandwidth expands, indicating greater price dispersion.
* Assessing Trend Strength and Direction: This indicator can show the direction of the current trend and assess its strength by observing the price's position within the bands. If the price consistently touches or trades near the boundary on one side of the band, it usually indicates a strong trend in that direction.
* Identifying Overbought/Oversold Signals: While not a strictly overbought/oversold indicator, when the price touches or breaks through the upper or lower band, it may indicate that the market is in a state of extreme volatility in the short term, potentially leading to a price pullback or reversal.
Predicting Potential Trend Ends or Consolidation: When the standard error band begins to expand significantly, it can be a signal that the momentum of the current trend is weakening, and the market may be about to enter a consolidation phase or the trend may be about to reverse.
Assisting Decision Making and Risk Management: Traders use the boundary lines as potential support and resistance levels to help determine entry and exit points or set stop-loss levels, thereby managing trading risk.
In summary, the standard error band is a dynamic volatility tool that helps traders better understand market behavior by quantifying the degree to which prices deviate from their predicted trend, providing an important reference, especially in judging the continuation of trends and potential turning points.
标准误差带(Standard Error Bands)指标在市场分析中主要用于衡量价格波动性、判断趋势强度以及识别潜在的市场反转或盘整区域。它类似于布林带(Bollinger Bands),但通常基于线性回归线而不是简单的移动平均线,为交易者提供了价格围绕其平均趋势波动的视觉范围。
具体作用包括:
衡量波动性:标准误差带的宽度直接反映了市场的波动性。当价格趋势稳定时,带宽通常会收缩,表明数据点聚集在均值附近;相反,当市场波动加剧时,带宽会扩张,表明价格离散程度增大。
判断趋势强度和方向:该指标可以显示当前趋势的方向,并通过观察价格在带内的位置来评估趋势的强度。如果价格持续触及或运行在某一侧的边界附近,通常意味着该方向的趋势强劲。
识别超买/超卖信号:虽然不是严格意义上的超买/超卖指标,但当价格触及或突破上轨或下轨时,可能预示着市场短期内处于极端的波动状态,可能会出现价格回调或反转。
预测潜在的趋势结束或盘整:当标准误差带开始显著扩张时,这可能是一个信号,表明当前趋势的动能正在减弱,市场可能即将进入盘整期或趋势即将反转。
辅助决策和风险管理:交易者利用边界线作为潜在的支撑位和阻力位,帮助确定进场、出场点位或设置止损水平,从而管理交易风险。
总之,标准误差带是一个动态的波动率工具,它通过量化价格偏离其预测趋势的程度,帮助交易者更清晰地理解市场行为,尤其是在判断趋势的持续性和潜在转折点方面提供了重要参考。
YM Ultimate SNIPER v5# YM Ultimate SNIPER v5 - Documentation & Trading Guide
## 🎯 Unified GRA + DeepFlow | YM/MYM Optimized
**TARGET: 3-7 High-Confluence Trades per Day**
---
## ⚡ QUICK START
```
┌─────────────────────────────────────────────────────────────────┐
│ YM ULTIMATE SNIPER v5 │
├─────────────────────────────────────────────────────────────────┤
│ │
│ SIGNALS: │
│ S🎯 = S-Tier (50+ pts) → HOLD position │
│ A🎯 = A-Tier (25-49 pts) → SWING trade │
│ B🎯 = B-Tier (12-24 pts) → SCALP quick │
│ Z = Zone entry (price at FVG zone) │
│ │
│ SESSIONS (ET): │
│ LDN = 3:00-5:00 AM (London) │
│ NY = 9:30-11:30 AM (New York Open) │
│ PWR = 3:00-4:00 PM (Power Hour) │
│ │
│ COLORS: │
│ 🟩 Green zones = Bullish FVG (buy zone) │
│ 🟥 Red zones = Bearish FVG (sell zone) │
│ 🟣 Purple lines = Single prints (S/R levels) │
│ │
│ TABLE (Top Right): │
│ Pts = Candle point range │
│ Tier = S/A/B/X classification │
│ Vol = Volume ratio (green = good) │
│ Delta = Buy/Sell dominance │
│ Sess = Current session │
│ Zone = In FVG zone status │
│ Score = Confluence score /10 │
│ CVD = Cumulative delta direction │
│ R:R = Risk:Reward ratio │
│ │
└─────────────────────────────────────────────────────────────────┘
```
---
## 📋 VERSION 5 CHANGES
### What's New
- **Removed all imbalance code** - caused compilation errors
- **Simplified delta analysis** - uses candle structure instead of intrabar data
- **Cleaner confluence scoring** - 5 clear factors, max 10 points
- **Reliable table** - updates on last bar only, no flickering
- **Works on YM and MYM** - same logic applies to micro contracts
### Removed Features
- Candle-anchored imbalance markers
- Imbalance S/R zones
- Intrabar volume profile analysis
- POC visualization
### Kept & Improved
- Tier classification (S/A/B)
- FVG zone detection & visualization
- Single print detection
- Session windows with backgrounds
- Confluence scoring
- Stop/Target auto-calculation
- All alerts
---
## 🎯 SIGNAL TYPES
### Tier Signals (S🎯, A🎯, B🎯)
These are high-confluence signals that pass all filters:
| Tier | Points | Value/Contract | Action | Hold Time |
|------|--------|----------------|--------|-----------|
| **S** | 50+ | $250+ | HOLD | 2-5 min |
| **A** | 25-49 | $125-245 | SWING | 1-3 min |
| **B** | 12-24 | $60-120 | SCALP | 30-90 sec |
**Filters Required:**
1. Tier threshold met (points)
2. Volume ≥ 1.8x average
3. Delta dominance ≥ 62%
4. Body ratio ≥ 70%
5. Range ≥ 1.3x average
6. Proper wicks (no reversal wicks)
7. CVD confirmation (optional)
8. In trading session
### Zone Signals (Z)
Zone entries trigger when:
- Price is inside an FVG zone
- Delta shows dominance in zone direction
- Volume is above average
- In active session
- No tier signal already present
---
## 📊 CONFLUENCE SCORING
**Maximum Score: 10 points**
| Factor | Points | Condition |
|--------|--------|-----------|
| Tier | 1-3 | B=1, A=2, S=3 |
| In Zone | +2 | Price inside FVG zone |
| Strong Volume | +2 | Volume ≥ 2x average |
| Strong Delta | +2 | Delta ≥ 70% |
| CVD Momentum | +1 | CVD trending with signal |
**Score Interpretation:**
- **7-10**: Elite setup - full size
- **5-6**: Good setup - standard size
- **4**: Minimum threshold - reduced size
- **< 4**: No signal shown
---
## ⏰ SESSION WINDOWS
### London (3:00-5:00 AM ET)
- European institutional flow
- Character: Slow build-up, clean trends
- Expected trades: 1-2
- Best for: Zone entries, A/B tier
### NY Open (9:30-11:30 AM ET)
- Highest volume, most institutional activity
- Character: Initial balance, breakouts
- Expected trades: 2-3
- Best for: S/A tier, zone confluence
### Power Hour (3:00-4:00 PM ET)
- End-of-day rebalancing, MOC orders
- Character: Mean reversion or trend acceleration
- Expected trades: 1-2
- Best for: Zone entries, B tier scalps
---
## 🟩 FVG ZONES
### What Are FVG Zones?
Fair Value Gaps (FVGs) are price gaps between candles where price moved so fast that a gap was left. These gaps often act as support/resistance.
### Zone Requirements
- Gap size ≥ 25% of ATR
- Impulse candle has strong body (≥ 70%)
- Impulse candle is 1.5x average range
- Volume above average on impulse
- Created during active session
### Zone States
1. **Fresh** (bright color) - Just created, untested
2. **Tested** (gray) - Price touched zone midpoint
3. **Broken** (removed) - Price closed through zone
### Trading FVG Zones
| Zone | Approach From | Expected |
|------|--------------|----------|
| 🟩 Bull | Above (falling) | Support - look for bounce |
| 🟥 Bear | Below (rising) | Resistance - look for rejection |
---
## 🟣 SINGLE PRINTS
Single prints mark candles with:
- Range > 1.3x average
- Body > 70% of range
- Volume > 1.8x average
- Clear delta dominance
These become horizontal support/resistance lines extending into the future.
---
## 📊 TABLE REFERENCE
| Row | Label | Meaning |
|-----|-------|---------|
| 1 | Pts | Current candle point range |
| 2 | Tier | S/A/B/X classification |
| 3 | Vol | Volume ratio vs 20-bar average |
| 4 | Delta | Buy/Sell percentage dominance |
| 5 | Sess | Current session (LDN/NY/PWR/OFF) |
| 6 | Zone | In FVG zone (BULL/BEAR/---) |
| 7 | Score | Confluence score out of 10 |
| 8 | CVD | Delta momentum direction |
| 9 | R:R | Risk:Reward if signal active |
### Color Coding
- **Green/Lime**: Good, meets threshold
- **Yellow**: Caution, borderline
- **Red**: Bad, below threshold
- **Gray**: Inactive/neutral
---
## 🔧 SETTINGS GUIDE
### Tier Thresholds
| Setting | Default | Notes |
|---------|---------|-------|
| S-Tier | 50 pts | ~$250/contract |
| A-Tier | 25 pts | ~$125/contract |
| B-Tier | 12 pts | ~$60/contract |
### Sniper Filters
| Setting | Default | Notes |
|---------|---------|-------|
| Min Volume Ratio | 1.8x | Lower = more signals |
| Delta Dominance | 62% | Lower = more signals |
| Body Ratio | 70% | Higher = fewer, cleaner |
| Range Multiplier | 1.3x | Higher = fewer, bigger moves |
| CVD Confirm | On | Off = more signals |
### Recommended Configurations
**Conservative (3-4 trades/day):**
```
Min Confluence: 6
Volume Ratio: 2.0
Delta Threshold: 65%
Body Ratio: 75%
```
**Standard (5-7 trades/day):**
```
Min Confluence: 4
Volume Ratio: 1.8
Delta Threshold: 62%
Body Ratio: 70%
```
**Aggressive (7-10 trades/day):**
```
Min Confluence: 3
Volume Ratio: 1.5
Delta Threshold: 60%
Body Ratio: 65%
```
---
## ✓ ENTRY CHECKLIST
Before entering any trade:
1. ☐ Signal present (S🎯, A🎯, B🎯, or Z)
2. ☐ Session active (LDN, NY, or PWR)
3. ☐ Score ≥ 4 (preferably 6+)
4. ☐ Vol shows GREEN
5. ☐ Delta colored (not gray)
6. ☐ CVD arrow matches direction
7. ☐ Note stop/target lines
8. ☐ Execute at signal candle close
---
## ⛔ DO NOT TRADE
- Session shows "OFF"
- Score < 4
- Vol shows RED
- Delta gray (no dominance)
- Multiple conflicting signals
- Major news imminent (FOMC, NFP, CPI)
- Overnight session (11:30 PM - 3:00 AM ET)
---
## 🎯 POSITION SIZING
| Tier | Score | Size | Stop |
|------|-------|------|------|
| S (50+ pts) | 7+ | 100% | Below/above candle |
| A (25-49 pts) | 5-6 | 75% | Below/above candle |
| B (12-24 pts) | 4 | 50% | Below/above candle |
| Zone | Any | 50% | Beyond zone |
---
## 🚨 ALERTS
### Priority Alerts (Set These)
| Alert | Action |
|-------|--------|
| 🎯 S-TIER | Drop everything, check immediately |
| 🎯 A-TIER | Evaluate within 15 seconds |
| 🎯 B-TIER | Check if available |
| 🎯 ZONE | Good context entry |
### Info Alerts (Optional)
| Alert | Purpose |
|-------|---------|
| NEW BULL/BEAR FVG | Mark zones on mental map |
| SINGLE PRINT | Note for future S/R |
| SESSION OPEN | Prepare to trade |
---
## 📈 TRADE JOURNAL
```
DATE: ___________
SESSION: ☐ LDN ☐ NY ☐ PWR
TRADE:
├── Time: _______
├── Signal: S🎯 / A🎯 / B🎯 / Z
├── Direction: LONG / SHORT
├── Score: ___/10
├── Entry: _______
├── Stop: _______
├── Target: _______
├── In Zone: ☐ Yes ☐ No
├── Result: +/- ___ pts ($_____)
└── Notes: _______________________
DAILY:
├── Trades: ___
├── Wins: ___ | Losses: ___
├── Net P/L: $_____
└── Best setup: _______________________
```
---
## 🏆 GOLDEN RULES
> **"Wait for the session. Off-hours = noise."**
> **"Score 6+ is your edge. Anything less is gambling."**
> **"Zone + Tier = bread and butter combo."**
> **"One great trade beats five forced trades."**
> **"Leave every trade with money. YM gives you time."**
---
## 🔧 TROUBLESHOOTING
| Issue | Solution |
|-------|----------|
| No signals | Lower min score to 3-4 |
| Too many signals | Raise min score to 6+ |
| Zones cluttering | Reduce max zones to 8 |
| Missing sessions | Check timezone setting |
| Table not updating | Resize chart or refresh |
---
## 📝 TECHNICAL NOTES
- **Pine Script v6**
- **Works on**: YM, MYM, any Dow futures
- **Recommended TF**: 1-5 minute for day trading
- **Min TradingView Plan**: Free (no intrabar data required)
---
*© Alexandro Disla - YM Ultimate SNIPER v5*
*Clean Build | Proven Components Only*

67 2.0Major Market Trading Hours
New York Stock Exchange (NYSE)
Open: 9:30 AM (ET)
Close: 4:00 PM (ET)
Pre-Market: 4:00 AM – 9:30 AM (ET)
After Hours: 4:00 PM – 8:00 PM (ET)
Nasdaq
Open: 9:30 AM (ET)
Close: 4:00 PM (ET)
Pre-Market: 4:00 AM – 9:30 AM (ET)
After Hours: 4:00 PM – 8:00 PM (ET)
London Stock Exchange (LSE)
Open: 8:00 AM (GMT)
Close: 4:30 PM (GMT)
Tokyo Stock Exchange (TSE)
Open: 9:00 AM (JST)
Lunch Break: 11:30 AM – 12:30 PM (JST)
Close: 3:00 PM (JST)
Hong Kong Stock Exchange (HKEX)
Open: 9:30 AM (HKT)
Lunch Break: 12:00 PM – 1:00 PM (HKT)
Close: 4:00 PM (HKT)

Buffett Quality Filter (TTM)//@version=6
indicator("Buffett Quality Filter (TTM)", overlay = true, max_labels_count = 500)
// 1. Get financial data (TTM / FY / FQ)
// EPS (TTM) for P/E
eps = request.financial(syminfo.tickerid, "EARNINGS_PER_SHARE_BASIC", "TTM")
// Profitability & moat (annual stats)
roe = request.financial(syminfo.tickerid, "RETURN_ON_EQUITY", "FY")
roic = request.financial(syminfo.tickerid, "RETURN_ON_INVESTED_CAPITAL", "FY")
// Margins (TTM – rolling 12 months)
grossMargin = request.financial(syminfo.tickerid, "GROSS_MARGIN", "TTM")
netMargin = request.financial(syminfo.tickerid, "NET_MARGIN", "TTM")
// Balance sheet safety (quarterly)
deRatio = request.financial(syminfo.tickerid, "DEBT_TO_EQUITY", "FQ")
currentRat = request.financial(syminfo.tickerid, "CURRENT_RATIO", "FQ")
// Growth (1-year change, TTM)
epsGrowth1Y = request.financial(syminfo.tickerid, "EARNINGS_PER_SHARE_BASIC_ONE_YEAR_GROWTH", "TTM")
revGrowth1Y = request.financial(syminfo.tickerid, "REVENUE_ONE_YEAR_GROWTH", "TTM")
// Free cash flow (TTM) and shares to build FCF per share for P/FCF
fcf = request.financial(syminfo.tickerid, "FREE_CASH_FLOW", "TTM")
sharesOut = request.financial(syminfo.tickerid, "TOTAL_SHARES_OUTSTANDING", "FQ")
fcfPerShare = (not na(fcf) and not na(sharesOut) and sharesOut != 0) ? fcf / sharesOut : na
// 2. Valuation ratios from price
pe = (not na(eps) and eps != 0) ? close / eps : na
pFcf = (not na(fcfPerShare) and fcfPerShare > 0) ? close / fcfPerShare : na
// 3. Thresholds (Buffett-style, adjustable)
minROE = input.float(15.0, "Min ROE %")
minROIC = input.float(12.0, "Min ROIC %")
minGM = input.float(30.0, "Min Gross Margin %")
minNM = input.float(8.0, "Min Net Margin %")
maxDE = input.float(0.7, "Max Debt / Equity")
minCurr = input.float(1.3, "Min Current Ratio")
minEPSG = input.float(8.0, "Min EPS Growth 1Y %")
minREVG = input.float(5.0, "Min Revenue Growth 1Y %")
maxPE = input.float(20.0, "Max P/E")
maxPFCF = input.float(20.0, "Max P/FCF")
// 4. Individual conditions
cROE = not na(roe) and roe > minROE
cROIC = not na(roic) and roic > minROIC
cGM = not na(grossMargin) and grossMargin > minGM
cNM = not na(netMargin) and netMargin > minNM
cDE = not na(deRatio) and deRatio < maxDE
cCurr = not na(currentRat) and currentRat > minCurr
cEPSG = not na(epsGrowth1Y) and epsGrowth1Y > minEPSG
cREVG = not na(revGrowth1Y) and revGrowth1Y > minREVG
cPE = not na(pe) and pe < maxPE
cPFCF = not na(pFcf) and pFcf < maxPFCF
// 5. Composite “Buffett Score” (0–10) – keep it on ONE line to avoid line-continuation errors
score = (cROE ? 1 : 0) + (cROIC ? 1 : 0) + (cGM ? 1 : 0) + (cNM ? 1 : 0) + (cDE ? 1 : 0) + (cCurr ? 1 : 0) + (cEPSG ? 1 : 0) + (cREVG ? 1 : 0) + (cPE ? 1 : 0) + (cPFCF ? 1 : 0)
// Strictness
minScoreForPass = input.int(7, "Min score to pass (0–10)", minval = 1, maxval = 10)
passes = score >= minScoreForPass
// 6. Visuals
bgcolor(passes ? color.new(color.green, 80) : na)
plot(score, "Buffett Score (0–10)", color = color.new(color.blue, 0))
// Info label on last bar
var label infoLabel = na
if barstate.islast
if not na(infoLabel)
label.delete(infoLabel)
infoText = str.format(
"Buffett score: {0} ROE: {1,number,#.0}% | ROIC: {2,number,#.0}% GM: {3,number,#.0}% | NM: {4,number,#.0}% P/E: {5,number,#.0} | P/FCF: {6,number,#.0} D/E: {7,number,#.00} | Curr: {8,number,#.00}",
score, roe, roic, grossMargin, netMargin, pe, pFcf, deRatio, currentRat)
infoLabel := label.new(bar_index, high, infoText,
style = label.style_label_right,
color = color.new(color.black, 0),
textcolor = color.white,
size = size.small)

Camarilla Pivots with Pre-Market (Labeled)This Script for day trading , including pre market level
Enjoy
Charbillionaire

High-Res VP + Macro Auto Fib DJVolume profiling plus Fibonacci for the descrationary trader.
Volume profile: The most important tool that I know.
Fib: Gives you an idea of the moves.

Bitcoin Buy Signal D/WThis is a Bitcoin buy-signal indicator, very simple to use:
It only works on daily and weekly timeframes.
When the Tulu line is above the Hani line, and the price moves back into the Tulu–Hani range, it’s a good buying opportunity.
When the Tulu line is below the Hani line, it’s better to wait for the price to return to Tromsø before buying.
Whenever the price is below Tromsø , it’s always a good time to buy.
Candles that meet these conditions are highlighted in bright yellow to make them easy to spot.
To the moon! 🚀

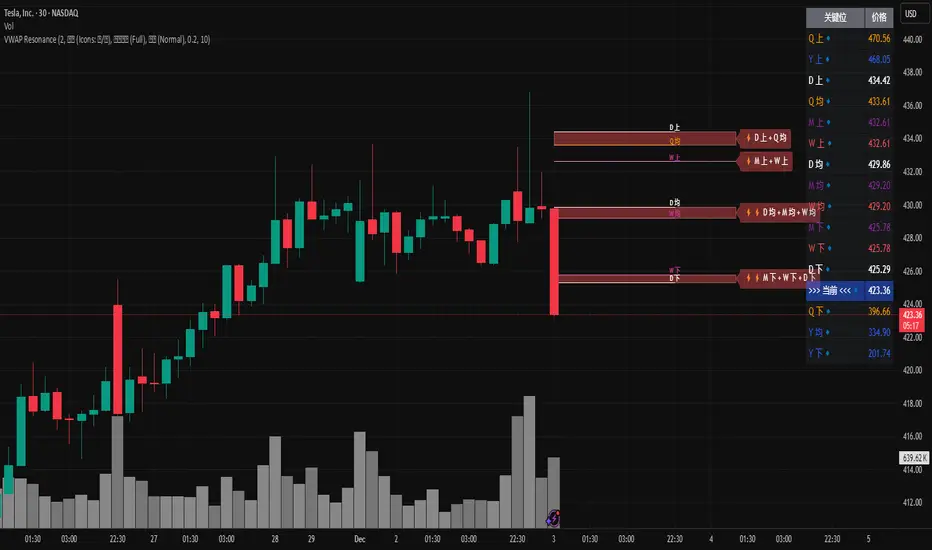
MTF VWAP Resonance [By Testeded]📈 MTF VWAP Resonance Hunter
(多级别 VWAP 共振捕猎者 - 终极版)
🇬🇧 English Description
1. Design Philosophy: The Institutional Edge
While typical indicators measure simple price action, VWAP (Volume Weighted Average Price) measures Value and Institutional Cost.
Professional traders and algorithms anchor their decisions to time-based benchmarks: Daily, Weekly, Monthly, and Quarterly. When prices return to these levels, they are testing the average cost basis of the market participants from that period.
The Logic of "Multi-Level Resonance" (MTF): A single VWAP line can be broken. However, when the Daily VWAP, Weekly Upper Band, and Quarterly Basis all overlap at the exact same price level, a "Market Consensus" is formed. This tool uses a background algorithm to detect these overlaps across 6 Timeframes (4H to Year) and visualizes them as "Resonance Boxes" instead of cluttering your chart with lines.
2. Key Features
⚓ Anchored VWAP Engine: Calculates VWAP + Standard Deviation Bands for 4H, Daily, Weekly, Monthly, Quarterly, and Yearly cycles simultaneously.
⚡ Smart Resonance Radar: Automatically detects when levels from different timeframes cluster together.
2-Line Confluence: ⚡ (Watch)
3-Line Confluence: ⚡⚡ (Strong)
4+ Line Confluence: ⚡⚡⚡ (Iron Wall)
🧘 Visual Modes (Zen / Focus):
Full Mode: Shows lines, dashboard, and resonance boxes.
Focus Mode: Hides lines, keeps dashboard and boxes.
Zen Mode: Hides EVERYTHING except the Resonance Boxes. Pure price action.
🏢 The Quarterly Line: Specifically designed to track the Quarterly VWAP, a critical level for institutional rebalancing and earnings cycles.
🎨 Customizable UI: Adjustable table text size (Small to Huge) and display styles.
3. How to Trade
Identify the Wall: Look for Red Boxes (Resistance) or Green Boxes (Support) with high star ratings (⚡⚡).
Read the Dashboard: Check the label (e.g., Q VWAP + W Lower). This tells you exactly who is defending this level (e.g., "Quarterly Buyers defending cost").
Sniper Entry: Wait for price to touch the Resonance Box. These levels often trigger sharp reversals or major breakouts.
🇨🇳 中文说明 (Chinese Description)
1. 设计哲学:多级别的全局视角
布林带反映的是波动率,而 VWAP(成交量加权平均价) 反映的是**“真金白银的持仓成本”**。
机构交易者和算法通常会锚定特定的时间周期进行交易:日内、周线、月线以及季度线。 “多级别共振”的逻辑: 单一周期的 VWAP 很容易失效。但是,当 日线 VWAP、周线上轨 和 季度线成本 在同一个价格位置重叠时,意味着短线、中线和长线资金在此处达成了**“价值共识”。 本指标通过后台算法,同时监控 6个时间周期 (4H - 年线),将这些重叠的价位转化为可视化的“共振框”**,提供一个多级别的全局视角。
2. 核心功能
⚓ 全周期锚定 VWAP:后台实时计算 4H, 日线, 周线, 月线, 季度线, 年线 的 VWAP 及其标准差轨道。
⚡ 智能共振雷达:自动检测不同周期的关键位重叠。
2线共振:⚡ (关注)
3线共振:⚡⚡ (强力支撑/阻力)
4线以上:⚡⚡⚡ (核弹级/铁壁共振)
🧘 显示模式 (Zen / Focus):
全面模式:显示所有线条 + 表格 + 共振框。
专注模式:隐藏线条,保留表格 + 共振框。
极简模式 (Zen):隐藏一切干扰,只显示共振框。像狙击手一样只看目标。
🏢 季度线增强:特别加入了 Quarterly VWAP (季度线),这是机构季末调仓和财报周期的重要防守线。
🎨 高度客制化:支持调整表格文字大小(从“小”到“巨大”),适配各种分辨率屏幕。
3. 实战用法
寻找“墙壁”:关注图表上的 红色共振框 (阻力) 或 绿色共振框 (支撑),尤其是带有 ⚡⚡ 标志的区域。
解读筹码:看一眼右上角的仪表盘标签(例如 Q VWAP + W Lower)。这意味着“季度级别的平均成本”与“周线级别的超卖线”重合,支撑力度极强。
警报交易:开启警报功能。不需要盯着屏幕,当价格撞上共振框时,指标会自动通知你。
Dual TF Bearish Divergence (Working)//@version=6
indicator("Dual TF Bearish Divergence (Working)", overlay=true)
// ----------------- SIMPLE BEARISH DIVERGENCE FUNCTION -------------------
bearDiv(src, rsiLen, lookbackMin, lookbackMax) =>
r = ta.rsi(src, rsiLen)
ph = ta.pivothigh(src, lookbackMin, lookbackMin)
ph_rsi = ta.pivothigh(r, lookbackMin, lookbackMin)
ph2 = ph
ph2_rsi = ph_rsi
priceHH = not na(ph) and not na(ph2) and ph > ph2
rsiLH = not na(ph_rsi) and not na(ph2_rsi) and ph_rsi < ph2_rsi
barsOk = lookbackMin >= lookbackMin and lookbackMin <= lookbackMax
priceHH and rsiLH and barsOk
// ----------------- TF CALLS -------------------
b60 = request.security(syminfo.tickerid, "60", bearDiv(close, 14, 10, 15))
b240 = request.security(syminfo.tickerid, "240", bearDiv(close, 14, 10, 15))
dual = b60 and b240
// ----------------- PLOT -------------------
plotshape(dual, title="Dual Bear Div", style=shape.labeldown,
color=color.red, size=size.small, text="🔻BearDiv")
// ----------------- ALERT -------------------
alertcondition(dual, "Dual Bearish Div 60+240",
"Bearish Divergence on both 60m & 240m")

SMC Statistical Liquidity Walls [PhenLabs]📊 SMC Statistical Liquidity Walls
Version: PineScript™ v6
📌 Description
The SMC Statistical Liquidity Walls indicator is designed to visualize market volatility and potential reversal zones using advanced statistical modeling. Unlike traditional Bollinger Bands that use simple lines, this script utilizes an “Inverted Sigmoid” opacity function to create a “fog of war” effect. This visualizes the density of liquidity: the further price moves from the equilibrium (mean), the “harder” the liquidity wall becomes.
This tool solves the problem of over-trading in low-probability areas. By automatically mapping “Premium” (Resistance) and “Discount” (Support) zones based on Standard Deviation (SD), traders can instantly see when price is overextended. The result is a clean, intuitive overlay that helps you identify high-probability mean reversion setups without cluttering your chart with manual drawings.
🚀 Points of Innovation
Inverted Sigmoid Logic: A custom mathematical function maps Standard Deviation to opacity, creating a realistic “wall” density effect rather than linear gradients.
Dynamic “Solidity”: The indicator is transparent at the center (Equilibrium) and becomes visually solid at the edges, mimicking physical resistance.
Separated Directional Bias: distinct Red (Premium) and Green (Discount) coding helps SMC traders instantly recognize expensive vs. cheap pricing.
Smart “Safe” Deviation: Includes fallback logic to handle calculation errors if deviation hits zero, ensuring the indicator never crashes during data gaps.
🔧 Core Components
Basis Calculation: Uses a Simple Moving Average (SMA) to determine the market’s equilibrium point.
Standard Deviation Zones: Calculates 1SD, 2SD, and 3SD levels to define the statistical extremes of price action.
Sigmoid Alpha Calculation: Converts the SD distance into a transparency value (0-100) to drive the visual gradient.
🔥 Key Features
Automated Premium/Discount Zones: Red zones indicate overbought (Premium) areas; Green zones indicate oversold (Discount) areas.
Customizable Density: Users can adjust the “Steepness” and “Midpoint” of the sigmoid curve to control how fast the walls become solid.
Integrated Alerts: Built-in alert conditions trigger when price hits the “Solid” wall (2SD or higher), perfect for automated trading or notifications.
Visual Clarity: The center of the chart remains clear (high transparency) to keep focus on price action where it matters most.
🎨 Visualization
Equilibrium Line: A gray line representing the mean price.
Gradient Fills: The space between bands fills with color that increases in opacity as it moves outward.
Premium Wall: Upper zones fade from transparent red to solid red.
Discount Wall: Lower zones fade from transparent green to solid green.
📖 Usage Guidelines
Range Period: Default 20. Controls the lookback period for the SMA and Standard Deviation calculation.
Source: Default Close. The price data used for calculations.
Center Transparency: Default 100 (Clear). Controls how transparent the middle of the chart is.
Edge Transparency: Default 45 (Solid). Controls the opacity of the outermost liquidity wall.
Wall Steepness: Default 2.5. Adjusts how aggressively the gradient transitions from clear to solid.
Wall Start Point: Default 1.5 SD. The deviation level where the gradient shift begins to accelerate.
✅ Best Use Cases
Mean Reversion Trading: Enter trades when price hits the solid 2SD or 3SD wall and shows rejection wicks.
Take Profit Targets: Use the Equilibrium (Gray Line) as a logical first target for reversal trades.
Trend Filtering: Do not initiate new long positions when price is deep inside the Red (Premium) wall.
⚠️ Limitations
Lagging Nature: As a statistical tool based on Moving Averages, the walls react to past price data and may lag during sudden volatility spikes.
Trending Markets: In strong parabolic trends, price can “ride” the bands for extended periods; mean reversion should be used with caution in these conditions.
💡 What Makes This Unique
Physics-Based Visualization: We treat liquidity as a physical barrier that gets denser the deeper you push, rather than just a static line on a chart.
🔬 How It Works
Step 1: The script calculates the mean (SMA) and the Standard Deviation (SD) of the source price.
Step 2: It defines three zones above and below the mean (1SD, 2SD, 3SD).
Step 3: The custom `get_inverted_sigmoid` function calculates an Alpha (transparency) value based on the SD distance.
Step 4: Plot fills are colored dynamically, creating a seamless gradient that hardens at the extremes to visualize the “Liquidity Wall.”
💡 Note
For best results, combine this indicator with Price Action confirmation (such as pin bars or engulfing candles) when price touches the solid walls.

RSI Golden & Dead Cross AlertRSI 14 Golden And Dead Cross Indicator
It will give you an alert when there are rsi golden and dead cross.
It is a intergated signal: Crossing up and Crossing down of RSI.
