Session Range Control [PointAlgo]Session Range Control (SRC)
The Session Range Control (SRC) indicator provides a structured view of intraday price behavior by tracking where the current price sits within the session’s high–low range and how today’s volatility compares to the Average Daily Range (ADR). It combines range analytics, momentum context, volatility interpretation, and visual cues to help traders understand session strength and shifts in intraday conditions.
Core Concept
Every trading session forms a unique high and low. SRC continuously reads these values and calculates the Position in Range, expressed on a scale from 0% to 100%:
0% → Price at Day Low
100% → Price at Day High
50% → Mid-range equilibrium
By normalizing price into a percentage, traders can quickly interpret where market pressure is concentrated during the session.
Trend Zones and Market State
SRC divides the range into logical zones to show the likely sentiment of the session:
1. Strong Uptrend Zone (Above Threshold)
When price consistently holds above the user-defined upper threshold (e.g., 60%), the indicator marks a Strong Uptrend.
This typically reflects:
Persistent intraday buying pressure
Price acceptance near the upper part of the range
Reduced likelihood of deep pullbacks
2. Strong Downtrend Zone (Below Threshold)
When price remains below the lower threshold (e.g., 40%), SRC signals a Strong Downtrend, indicating:
Dominant intraday selling
Consistent pressure keeping price near session lows
3. Bullish / Bearish Zones
Between the midline and strong thresholds, SRC displays softer trend zones:
Above 50% = Bullish Zone
Below 50% = Bearish Zone
These zones help classify whether price is trending, balanced, or drifting.
4. Neutral Territory
When price hovers around the mid-level without conviction, the indicator treats it as a neutral or undecided phase.
Signal Logic :
SRC includes built-in momentum shift signals based on range transitions:
Long Signal
Triggered when price crosses upward through 50%, often showing:
A shift from intraday weakness to strength
Buyers gaining control of the session
Short Signal
Triggered when price crosses downward through 50%, suggesting:
Loss of intraday strength
Sellers taking control
These signals help highlight potential turning points inside the session.
Extreme Levels :
SRC highlights the top and bottom 10% of the range:
> 90% = Extreme High (Overbought intraday condition)
< 10% = Extreme Low (Oversold intraday condition)
These conditions can be useful for identifying overextended movements or potential reaction zones.
ADR Comparison and Volatility Context :
The indicator also measures how today’s price range compares to the Average Daily Range (ADR):
Range Expanding: Today’s range is significantly larger than the ADR
Indicates heightened volatility
Often associated with trending or breakout environments
Range Compressing: Today’s range is much smaller
Suggests low volatility
Common before breakout phases
Characteristic of consolidation or balanced markets
This volatility context helps traders assess whether the session is behaving within normal boundaries or deviating significantly.
Dashboard Overview :
When enabled, the dashboard summarizes key intraday metrics in a structured table:
Trend status (Strong Uptrend, Strong Downtrend, Bullish, Bearish, Neutral)
Range position (%)
Signal status (Long Cross, Short Cross, Extreme High/Low, or None)
Day range calculation
Range vs ADR (%)
Day High / Day Low
Current price level
Simplified action label based on current conditions
This provides a quick reference system to interpret both trend and volatility at a glance without analyzing the full chart visually.
Visual Elements
SRC includes:
Colored dynamic plot for easy trend recognition
Horizontal reference lines at key levels (0%, 50%, 100%, strong-trend thresholds)
Background shading during extreme zone conditions
A separate ADR comparison plot
These visuals ensure the indicator remains intuitive regardless of chart style or timeframe.
Alerts
The script includes alert conditions for:
Long cross
Short cross
Strong trend detection
Extreme high / extreme low
These allow users to automate notifications during key market events without manually monitoring the chart.
Customization Options
Users can configure:
ADR length
Strong trend thresholds
Dashboard visibility
Dashboard position on chart
This makes SRC adaptable to different trading instruments and intraday styles.
Usage Notes
Works best on intraday timeframes where session boundaries are clearly defined.
Designed for analytical interpretation—trend bias, volatility phase, and range structure.
Can complement other tools such as moving averages, volume, or market structure analysis.
Disclaimer :
This indicator is intended for chart analysis and educational purposes only.
It does not generate financial, investment, or trading advice.
Users should validate signals with additional research and apply proper risk management.
Indicadores e estratégias

Optimal Daily MA Suite [MTF]Title: Optimal Daily MA Suite
Description: This is a comprehensive Multi-Timeframe (MTF) analysis suite designed to streamline chart layouts. Instead of loading multiple separate indicators to track various trend lines, this single tool allows traders to overlay higher-timeframe Moving Averages and key support/resistance levels directly onto their intraday charts.
Utility & Workflow: Swing traders and day traders often need to monitor "Big Picture" Daily Moving Averages (like the Daily 200 SMA or Daily 50 EMA) while executing trades on lower timeframes like the 15m or 1H. This tool automates that process, ensuring the major trend context is always visible without cluttering the indicator list.
Key Features:
Multi-Timeframe Engine: By default, all MAs are calculated on the Daily ("D") timeframe, regardless of the chart's current timeframe. This creates a stable "anchor" for trend analysis. The timeframe is fully customizable in the settings (e.g., set to "W" for Weekly analysis).
10 Customizable Slots: Toggle up to 10 different Moving Averages on/off individually.
Flexible Calculation Types: Supports SMA, EMA, WMA, VWMA, RMA (SMMA), and SWMA for every single line.
Trend Cloud Crossovers: Includes two dedicated "Cloud" setups to visualize crossovers (e.g., Golden Cross or Death Cross) with fill shading between the fast and slow lines.
Price Action Crossovers: Optional markers to highlight when the closing price crosses specific MAs.
Contextual Levels: Includes Previous Day High (PDH) and Previous Day Low (PDL) markers for immediate intraday support/resistance context.
How to Use:
Settings: Open the settings menu to select your "Indicator Timeframe" (Default: Daily).
Customization: Enable only the MAs relevant to your strategy (e.g., Enable MA 8 for the 50 SMA and MA 10 for the 200 SMA).
Clouds: Use the "Crossover Set" inputs to define a Bullish/Bearish trend cloud between two moving averages of your choice.
Technical Note: This script uses request.security with lookahead=barmerge.lookahead_off to ensure no repainting of historical data while providing accurate higher-timeframe values on closed bars.
Credits: Standard Moving Average calculations based on TradingView built-in functions.

AlgoZ Smart Divergence [Trend Filtered]AlgoZ Smart Divergence is a precision entry tool designed to catch market reversals by analyzing Volume Divergence combined with Multi-Timeframe Trend Filtering. Unlike standard divergence indicators that signal on every minor price fluctuation, this script uses a strict set of filters to only present high-probability trade setups that align with the broader market trend.
This is the Free Edition of the AlgoZ Suite, focused on providing clean, non-repainting Buy and Sell signals based on institutional volume flow.
How It Works The script operates on a 3-step validation process:
Volume Divergence:
It detects anomalies where volume spikes relative to price action (e.g., Price makes a Lower Low, but Volume hits a Higher High).
HTF Trend Painting:
It analyzes a Higher Timeframe (Default: 3 Hours) to determine the macro trend. If the 3H trend is Bullish, the candles turn Green. If Bearish, they turn Red.
Color Match Filtering:
The script includes a smart filter that blocks signals that go against the trend. You will only see BUY signals when the candles are Green (Uptrend) and SELL signals when the candles are Red (Downtrend).
Key Features
Volume Divergence Engine:
Identifies hidden accumulation and distribution zones.
HTF Trend Coloring:
Automatically paints your chart based on Higher Timeframe breakouts (Default: 3-Hour Trend).
Smart Signal Filtering:
Toggles are available to "Only Show Signals Matching Candle Color," ensuring you never trade against the momentum.
EMA Trend Filter:
Includes a built-in 10-period EMA filter to further refine entries.
Volatility Filters:
Optional RSI and ADX filters are included to avoid trading during low-volatility "chop."
How to Use
For Longs (Buys):
Wait for the candles to turn Green (indicating the 3-Hour trend is up) and look for a BUY label. The price must also be above the 10 EMA (if enabled).
For Shorts (Sells):
Wait for the candles to turn Red (indicating the 3-Hour trend is down) and look for a SELL label.
Risk Management:
This script is designed to catch reversals. Always place your Stop Loss below the recent swing low (for buys) or above the swing high (for sells).
Settings
Higher Timeframe:
Default is set to 3 Hours (180 minutes). You can adjust this to 1 Day or 4 Hours depending on your trading style.
EMA Length:
Default is 10.
Color Match Filter:
On by default.

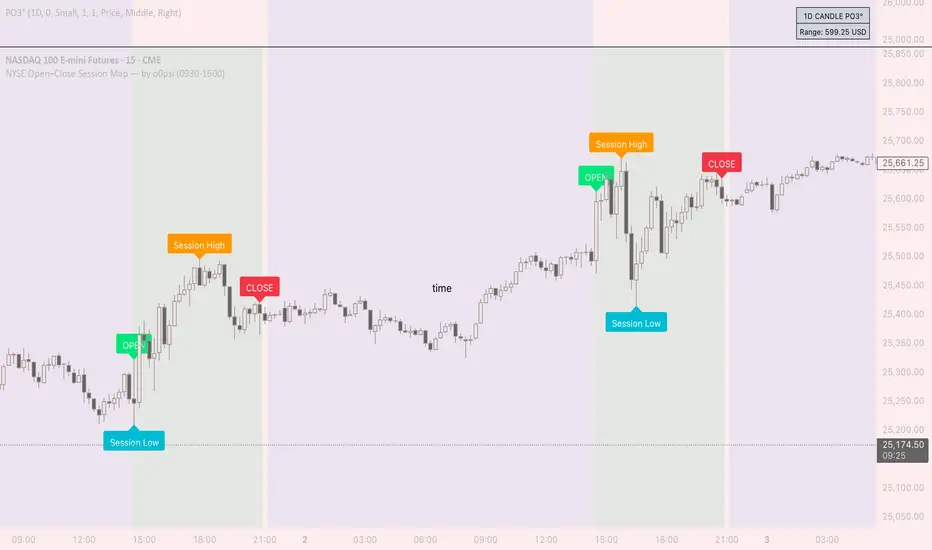
NYSE Open Close Session Map by o0psiNYSE Open Close Session Map by o0psi
This indicator highlights the regular US cash session window (default 09:30–16:00 New York time) and makes the key session bars obvious on the chart.
What it shows
A marker on the session OPEN bar
A marker on the session CLOSE bar (last in-session candle)
Optional background highlight for the full session window
Optional labels for the session high and session low bars (based on intraday price during the session)
How it works
The script detects bars inside the selected session window (New York timezone). It anchors OPEN on the first in-session bar, updates the session high/low while the session is active, then anchors CLOSE on the final in-session bar and labels the high/low bars where they occurred.
Notes
Session range precision depends on chart timeframe (lower timeframes capture extremes more precisely).
This is a charting/visualization tool and does not provide trading advice.

Custom RSI + Divergence + Bold Lines (v6, matched)📌 Custom RSI with Divergence & Dynamic Coloring
This indicator enhances the classic Relative Strength Index (RSI) by combining
dynamic visual feedback with automatic regular divergence detection.
It is designed to help traders quickly identify overbought / oversold conditions
and potential momentum shifts through clear and intuitive visualization.
⸻
🔍 Key Features
1️⃣ Dynamic RSI Line Coloring
• Overbought zone (RSI > Overbought level) → RSI line turns green
• Oversold zone (RSI < Oversold level) → RSI line turns red
• Neutral zone → RSI line remains white
This allows instant recognition of the current RSI state.
⸻
2️⃣ Overbought / Oversold Visual Highlighting
• Clear overbought and oversold reference lines
• Background shading when RSI enters these zones
→ improves signal visibility and reaction speed
⸻
3️⃣ Automatic Regular Divergence Detection
• Bullish Divergence
• Price makes a lower low
• RSI makes a higher low
• Pivot lows are connected with a bold green line
• Bearish Divergence
• Price makes a higher high
• RSI makes a lower high
• Pivot highs are connected with a bold red line
Pivot points are connected directly, making divergence structures easy to identify at a glance.
⸻
4️⃣ Clear Signal Markers
• Bullish divergence: ▲ (bottom of the RSI pane)
• Bearish divergence: ▼ (top of the RSI pane)
⸻
⚙️ Inputs
• RSI Length
• Overbought / Oversold Levels
• Pivot Length (controls divergence sensitivity)
⸻
💡 How to Use
• Oversold + Bullish Divergence → Potential rebound setup
• Overbought + Bearish Divergence → Potential pullback or reversal
• Best used in combination with trend analysis, support/resistance, and volume
⸻
⚠️ Notes
• Divergence signals are probabilistic, not guaranteed.
• In ranging markets, divergences may appear more frequently.
• Always apply proper risk management.
⸻
🎯 Best For
• Traders who actively use RSI
• Traders looking for clean and intuitive divergence visualization
• Users who prefer minimal but informative indicators

7/19 EMA Crossover Alertsaskl hasodidu fuasdo asdfasdfiu sdfiuyiodafugoasdf fa sgyu dsgasdo asfo o asdf

MenthorQ Levels ConversionLevels Conversion helps traders accurately overlay price levels from spot/index ETFs and indices (like SPX, SPY, QQQ, NDX) onto futures charts (like ES, NQ, etc.).
Because futures and spot/index prices don’t trade at the same price, your levels will be misaligned if you plot them directly. Futures typically trade at a spread or ratio versus their related index/ETF. This indicator solves that by calculating the conversion ratio automatically, so your levels stay aligned on the futures chart.
How it works
This script calculates the ratio between Asset A and Asset B and applies it to convert levels from one instrument to the other (for example, SPX → ES, QQQ → NQ).
Ratio options (3 modes)
You can choose one of three ratio sources:
✅ T1 Ratio (Morning Snapshot)
Select a specific time to “lock” the ratio.
Default: 10:00 AM ET (morning session snapshot)
✅ T2 Ratio (Afternoon Snapshot)
Select a second time to “lock” the ratio.
Default: 3:30 PM ET (afternoon snapshot)
✅ Last Price Ratio (Live)
Uses the last traded price of both assets to compute the ratio.
Note: To refresh the “Last Price” baseline, simply remove and re-add the indicator.
Learn more about Levels Conversions: menthorq.com
Common levels conversions
Some popular use-cases include:
- SPX Gamma Levels → ES
- SPY Gamma Levels → ES
- QQQ Gamma Levels → NQ
- NDX Gamma Levels → NQ
- SPX Intraday Gamma Levels → ES
- QQQ Intraday Gamma Levels → NQ
- SPX Swing Trading Levels → ES
- QQQ Swing Trading Levels → NQ
- GLD Levels → GC
- DIA Levels → YM
- USO Levels → CL
- NVDA / MAG7 Levels → QQQ

POI Zones with Imbalance- Ahmed AwadHighlights Point of Interest (POI) zones on the chart where a significant price imbalance occurs between the candle’s open and close. The indicator draws semi-transparent orange zones to mark potential buy or sell areas, helping traders spot strong price moves and key levels. Adjustable imbalance threshold and transparency for flexibility.

Liquidity Entry Triggers (4-Model System) | WarRoomXYZLiquidity Entry Triggers is an open-source, price-action-based analytical framework designed to highlight recurring institutional liquidity behaviors that appear across all liquid markets.
The script focuses on how and where liquidity is taken, rather than attempting to predict direction using oscillators or lagging indicators.
It is optimized for XAUUSD, FX pairs, indices, and crypto , particularly on 1m–15m timeframes where session behavior and liquidity reactions are most visible.
This tool is not a buy/sell signal generator .
It provides contextual entry zones based on structural liquidity logic, allowing traders to apply their own execution rules.
Core Philosophy
Markets move because of:
•Trapped traders
•Forced liquidations
•Session-based liquidity cycles
•Reactions at prior institutional participation zones
This script visualizes four repeatable entry triggers that emerge from those mechanisms.
🔹 1. Failed Breakout / Trapped Trader Model
When price breaks a clearly defined range high or low, breakout traders often enter expecting continuation.
If price fails to hold outside the range and closes back inside, those traders become trapped.
The script detects:
•Breaks beyond recent highs/lows
•Immediate rejection back into the range
•Structural failure of momentum
These conditions frequently lead to mean reversion or reversal moves as trapped traders exit and fuel movement in the opposite direction.
Markers are plotted at the point of failure to highlight potential trap zones.
🔹 2. Liquidation Flush Detection
Sharp impulsive candles with abnormally large wicks often represent liquidation cascades rather than healthy trend continuation.
The script identifies liquidation behavior by measuring:
•Wick-to-body imbalance
•Sudden expansion followed by rejection
•Temporary price inefficiencies
These flushes commonly occur near:
•Session highs/lows
•Range extremes
•Trend exhaustion points
Such events often lead to rebalance moves , where price partially or fully fills the wick.
🔹 3. Orderblock Reaction Zones
Orderblocks represent areas where heavy participation occurred before a strong displacement move.
The script highlights:
•Clean bullish and bearish orderblock structures
•Zones formed during consolidation prior to expansion
•Areas likely to be defended when revisited
Orderblocks with minimal noise and clean departure are prioritized, as they often reflect institutional positioning rather than retail activity.
These zones are intended as reaction areas , not automatic entry signals.
🔹 4. London Session Liquidity Sweep Model
The London session frequently establishes the initial daily high or low.
Later in the session or during New York, price often:
•Sweeps internal liquidity around that level
•Rejects after the sweep
•Continues with the higher-timeframe bias
The script monitors London session behavior and marks:
•Liquidity runs above/below London highs and lows
•Rejections back inside the prior structure
This model is especially effective when combined with broader daily context.
🔹4. How the Components Work Together
The framework is designed as a context stack , not a checklist of signals:
Liquidity Event → Location → Timing → Trader Execution
Each model reinforces the others:
•Failed breakouts often occur after liquidity sweeps
•Liquidation wicks frequently form near orderblocks
•London sweeps often trigger failed momentum moves
•Confluence increases probability, not certainty
🔹 Practical Usage Guide
✔ Identify context
Determine whether price is approaching a range extreme, session level, or prior participation zone.
✔ Wait for a liquidity event
Look for a sweep, failed breakout, or liquidation wick.
✔ Observe reaction
Rejection, displacement, or reclaim behavior provides confirmation.
✔ Execute manually
Stops are commonly placed beyond the liquidity extreme.
Targets are typically internal liquidity, prior highs/lows, or imbalance zones.
The indicator does not manage trades or enforce rules.
Execution and risk management remain the trader’s responsibility.
🔹 5. Originality & Design Notes
This script does not replicate or bundle existing indicators.
It introduces:
•A multi-model liquidity entry framework
•Structural failed breakout detection
•Wick-based liquidation imbalance logic
•Session-aware liquidity sweep visualization
•A unified, minimal, non-lagging design
All concepts are based on observable market behavior and integrated into a single analytical tool.
🔹 6. Suitable Markets & Timeframes
Works best on:
•XAUUSD
•Major FX pairs
•Indices
•Liquid crypto markets
Recommended timeframes:
•1m
•5m
•15m
•30m
🔹7. Limitations & Notes
•This is an analytical framework , not a trading system
•All markings are confirmed at candle close (non-repainting)
•No open interest or order flow data is used
•Results depend on user interpretation and execution
•Best used alongside session bias and higher-timeframe structure
Disclaimer
This script is provided for educational and informational purposes only.
It does not constitute financial advice, investment advice, or a recommendation to buy or sell any instrument.
Trading involves risk, and losses can exceed initial deposits.
The author assumes no responsibility for trading decisions made using this tool.
Users are strongly encouraged to test this script in demo or simulation environments and to apply proper risk management, position sizing, and personal discretion at all times.
By using this script, you acknowledge and accept all associated risks.

PatternTransitionTablesPatternTransitionTables Library
🌸 Part of GoemonYae Trading System (GYTS) 🌸
🌸 --------- 1. INTRODUCTION --------- 🌸
💮 Overview
This library provides precomputed state transition tables to enable ultra-efficient, O(1) computation of Ordinal Patterns. It is designed specifically to support high-performance indicators calculating Permutation Entropy and related complexity measures.
💮 The Problem & Solution
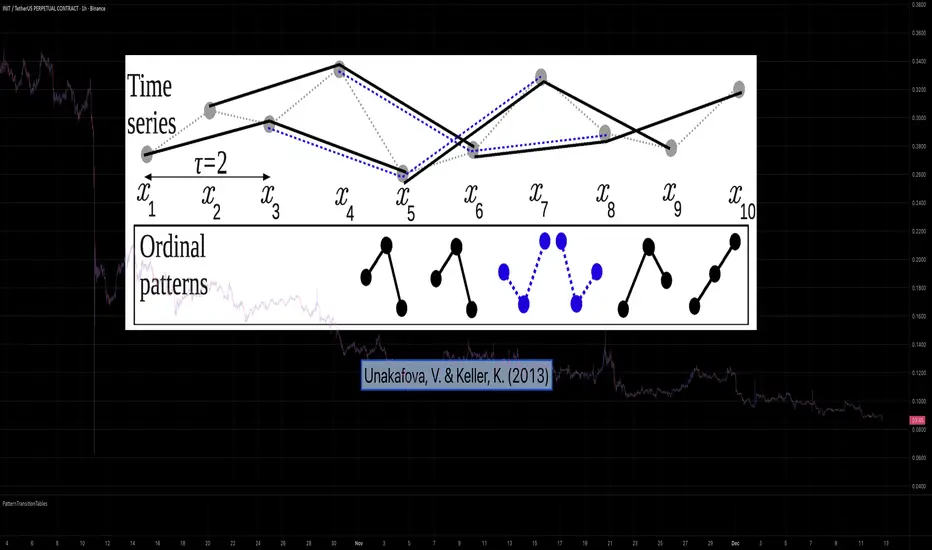
Calculating Permutation Entropy, as introduced by Bandt and Pompe (2002), typically requires computing ordinal patterns within a sliding window at every time step. The standard successive-pattern method (Equations 2+3 in the paper) requires ≤ 4d-1 operations per update.
Unakafova and Keller (2013) demonstrated that successive ordinal patterns "overlap" significantly. By knowing the current pattern index and the relative rank (position l) of just the single new data point, the next pattern index can be determined via a precomputed look-up table. Computing l still requires d comparisons, but the table lookup itself is O(1), eliminating the need for d multiplications and d additions. This reduces total operations from ≤ 4d-1 to ≤ 2d per update (Table 4). This library contains these precomputed tables for orders d = 2 through d = 5.
🌸 --------- 2. THEORETICAL BACKGROUND --------- 🌸
💮 Permutation Entropy
Bandt, C., & Pompe, B. (2002). Permutation entropy: A natural complexity measure for time series.
doi.org
This concept quantifies the complexity of a system by comparing the order of neighbouring values rather than their magnitudes. It is robust against noise and non-linear distortions, making it ideal for financial time series analysis.
💮 Efficient Computation
Unakafova, V. A., & Keller, K. (2013). Efficiently Measuring Complexity on the Basis of Real-World Data.
doi.org
This library implements the transition function φ_d(n, l) described in Equation 5 of the paper. It maps a current pattern index (n) and the position of the new value (l) to the successor pattern, reducing the complexity of updates to constant time O(1).
🌸 --------- 3. LIBRARY FUNCTIONALITY --------- 🌸
💮 Data Structure
The library stores transition matrices as flattened 1D integer arrays. These tables are mathematically rigorous representations of the factorial number system used to enumerate permutations.
💮 Core Function: get_successor()
This is the primary interface for the library for direct pattern updates.
• Input: The current pattern index and the rank position of the incoming price data.
• Process: Routes the request to the specific transition table for the chosen order (d=2 to d=5).
• Output: The integer index of the next ordinal pattern.
💮 Table Access: get_table()
This function returns the entire flattened transition table for a specified dimension. This enables local caching of the table (e.g. in an indicator's init() method), avoiding the overhead of repeated library calls during the calculation loop.
💮 Supported Orders & Terminology
The parameter d is the order of ordinal patterns (following Bandt & Pompe 2002). Each pattern of order d contains (d+1) data points, yielding (d+1)! unique patterns:
• d=2: 3 points → 6 unique patterns, 3 successor positions
• d=3: 4 points → 24 unique patterns, 4 successor positions
• d=4: 5 points → 120 unique patterns, 5 successor positions
• d=5: 6 points → 720 unique patterns, 6 successor positions
Note: d=6 is not implemented. The resulting code size (approx. 191k tokens) exceeds the Pine Script limit of 100k tokens (as of 2025-12).


Stochastic RSI with CrossesThis is the same Indicator on tradingview I just added a trigger for crosses for clarity. It has alerts and now you can clearly see who the STOCH/ RSI crosses.

VOLUME with DOUBLE MAA volume chart with dual moving averages. If you're looking for a volume chart with dual moving averages, this script is for you. By averaging the volume over two periods, you can discover more subtle relationships between price and volume.

MAJOR PA Zones + Structure + Targets (Gray/Purple)This script highlights major price-action structure (HH/HL/LH/LL), marks BOS/CHOCH events, and draws key supply/demand zones to help visualize trend shifts and potential targets.
