AI Market Barometer ProAI Market Barometer Pro - Professional Trading Indicator
Overview
AI Market Barometer Pro is an advanced multi-timeframe trading system that combines artificial intelligence algorithms with proprietary technical analysis to deliver high-confidence trading signals. This professional-grade indicator analyzes market conditions across multiple timeframes simultaneously, providing traders with clear directional bias and signal strength ratings.
Core Features
🎯 Core AI Barometer System
- Multi-Timeframe Analysis: Monitors different timeframes simultaneously
- AI Confidence Score: Proprietary algorithm calculates signal confidence from 0-100%
- Three-Level Signal Strength: Basic, Medium ★, and Strong ★★ signals
- Dynamic Background Coloring: Visual market sentiment at a glance
- Real-Time Information Panel: Customizable position with live market metrics
⚡ Three AI Accelerator Systems
- Accelerator 1: Original multi-timeframe momentum system with 27 dimensions
- Accelerator 2: Five-star selection algorithm with 32 AI parameters
- Accelerator 3:
- Each accelerator provides independent AI support lines and signal zones
- Highly selective signals ensuring maximum accuracy
📊 Advanced Visualization
- Color-Coded Signals:
- Green zones indicate bullish conditions
- Red zones indicate bearish conditions
- Gray indicates neutral/ranging markets
- Smart Labels: Auto-positioned signal labels displaying confidence percentages
- Background Intensity: Three levels showing signal strength
- Customizable Display: Adjustable panel position and visibility options
Configuration Options
Display Settings
- Panel Position: 9 position options (corners, edges, center)
- Show Labels: Toggle signal labels on/off
- Show Background Color: Toggle background coloring on/off
- Show Info Panel: Toggle real-time information table on/off
- Background Display Days: Control how many days of coloring to display (1-30 days)
Channel Settings
- Enable Channel: Optional channel
- Channel Width: Adjustable deviation multiplier
Accelerator Settings
- Enable Accelerator 1: Original accelerator system
- Enable Accelerator 2: Five-star selection system
- Enable Accelerator 3: Advanced buy filtering system
- Each can be toggled independently
Alert System
Pre-configured alerts include:
- AI Long Signal activation
- AI Short Signal activation
- AI Ranging Signal activation
- Accelerator 1 Bull/Bear zones
- Accelerator 2 Bull/Bear zones
- Accelerator 3 Bull/Bear zones
Information Panel Metrics
Real-time display includes:
- Current Timeframe
- Active Signal (Long/Short/Ranging)
- AI Confidence Percentage
- Current Price
- Change Percentage
- Momentum Status (Bullish/Bearish/Mixed)
- Signal Strength Rating
Recommended Timeframes
- Scalping: 1-minute charts
- Day Trading: 5-minute, 15-minute charts
- Swing Trading: 1-hour, 4-hour, Daily charts
- Position Trading: Daily, Weekly charts
Technical Requirements
- TradingView Pro, Pro+, or Premium account (required for multi-timeframe functionality)
- Compatible with all markets: Forex, Crypto, Stocks, Indices, Commodities
- Works on all timeframes from 1-minute to Monthly
Disclaimer
This indicator is a tool to assist with trading decisions. Past performance does not guarantee future results. Trading involves substantial risk of loss. Always use proper risk management and never risk more than you can afford to lose. The AI algorithms and confidence scores are based on historical price patterns and technical analysis, not predictive guarantees.
What Makes This Different?
Unlike simple trading systems, AI Market Barometer Pro:
- ✅ Analyzes multiple timeframes simultaneously
- ✅ Calculates dynamic confidence scores
- ✅ Provides three-tier signal strength ratings
- ✅ Includes three independent accelerator systems
- ✅ Delivers highly selective, low-noise signals
- ✅ Features professional-grade visualization
- ✅ Adapts to all market conditions
Join thousands of traders using AI-powered analysis to gain their edge in the markets.
🌤️ Perfect Companion Indicator
Enhance your trading with AI Market Weather Forecast Pro
Transform complex market analysis into intuitive weather forecasts. Get instant market temperature readings from -50°C to +50°C and know whether you're trading in a heatwave or a blizzard.
Why use them together:
Barometer → Precise entry/exit signals with AI confidence scores
Weather → Overall market climate and trend temperature
Combined → Complete market picture for optimal timing
👉 Get AI Market Weather Forecast Pro
Know the market climate before you trade. Two indicators, one complete trading system.
© 2024 AI Market Barometer Pro. All rights reserved. Proprietary algorithms and methodologies protected.
Indicadores e estratégias

Optimized Options Day Trading Script -Anurag Dec20-2025This indicator is a specialized Multi-Timeframe Trend & Regime System designed specifically for intraday trading on SPY, QQQ, and SPX. It is optimized for high-volatility execution (like 0DTE) by filtering out "choppy" low-probability conditions before they happen.
Unlike standard indicators that only look at the current chart, this script runs a background check on the 15-Minute Timeframe

Gann Levels by Acharya JiThis Pine Script indicator is designed to help traders quickly identify **key intraday levels** based on the **first candle of the trading day**. It performs three main functions:
1. **Marks the First Candle’s High and Low**
- Blue circles are plotted at the high and low of the first candle each day.
- These serve as the baseline reference points for calculating targets.
2. **Plots Upside Targets (Green Lines)**
- Six horizontal green lines are drawn above the first candle’s high.
- Each line represents a percentage increment: **+0.09%, +0.18%, +0.36%, +0.72%, +1.44%, +2.88%**.
- These levels act as potential resistance or profit-taking zones.
3. **Plots Downside Targets (Red Lines)**
- Six horizontal red lines are drawn below the first candle’s low.
- Each line represents a percentage decrement: **-0.09%, -0.18%, -0.36%, -0.72%, -1.44%, -2.88%**.
- These levels act as potential support or stop-loss zones.
---
Purpose
- Provides a **structured intraday roadmap** based on the first candle.
- Helps traders visualize **target ladders** both above and below the market.
- Useful for scalpers, intraday traders, and strategy testing around **breakouts or reversals**.
---
👉 Rahul, would you like me to also add **labels (like +0.09%, -0.18%)** directly on the chart next to each line so you can instantly recognize which target level is which without checking the legend?

ORB 2R Retest Volume Entry (1m) - v6gJdsfjs kdfg s jdslzi gdsjzg SJFds SJKdls dsjzgfjdkzl GDMKls gndsmzgSfgndmsKF fdnsioGLfs


MA-breakout signal (Skull).V1
MA-breakout signal (이평선 돌파 시그널) - V1
역배열에서 정배열 돌파시 -그린 스컬
정배열에서 역배열 돌파시 -레드 스컬
일목구름 완전 돌파시 - 배경 스컬
Moving average line breakout signal
/GREEN Skull /RED Skull
Ichimoku Cloud completely - Background Skull

Minervini Template + Powerplay detectorMinervini Template + PowerPlay Detector
This indicator implements a rule-based Minervini trend template to identify stocks in strong, institutionally supported uptrends, combined with a Power Play momentum detector for explosive leadership moves.
Minervini Model (MM) Rules
The MM dashboard turns GREEN only when all of the following rules are met:
Close ≥ 150-day SMA
Close ≥ 200-day SMA
50-day SMA > 150-day SMA
50-day SMA > 200-day SMA
150-day SMA ≥ 200-day SMA
200-day SMA is rising (current value higher than ~1 month ago)
Close is at least 30% above the 52-week low
Close is within 25% of the 52-week high
Close is not more than 8% below the 50-day SMA
These rules ensure:
Proper long-term trend structure
Institutional accumulation alignment
Strength near highs, not extended weakness
When MM is red, hovering over it shows exactly which rules failed, allowing quick diagnosis of why a stock does not qualify.
POWERPLAY Logic
POWERPLAY highlights rare, high-velocity leadership moves:
Triggers when a stock gains 90% or more within any rolling window of up to 60 trading sessions
Remains active as long as the condition continues to hold
Hover tooltip displays:
Start date of the move
Current date
Total percentage gain so far
This captures fast institutional momentum, even if the move occurs in fewer than 60 sessions.
Dashboard Features
Moveable to any corner of the chart
Adjustable size
Adjustable opacity
Designed for trend followers and momentum traders seeking true market leaders, not short-term noise or late-stage breakouts.

HaP MACDHaP MACD - Advanced DEMA Assisted Signal Indicator
Overview
The HaP MACD is an evolution of the classic MACD, designed for traders who demand faster response times and clearer trend visualisations. By integrating DEMA (Double Exponential Moving Average) logic into the standard MACD framework, this indicator filters out noise and highlights momentum shifts with a unique color-coded dot system.
How It Works
The indicator calculates two types of MACD: a standard one for the main lines and a DEMA-based one for signal generation. This dual approach ensures you stay in the trend while being alerted the moment the momentum starts to fade.
Visual Guide & Color Logic
The signal dots are placed directly on the MACD line to guide your decisions:
🔵 Blue Dot: The Entry Signal. Appears when DEMA conditions first align for a bullish move.
🟢 Green Dot: Strong Momentum. The trend is active and the MACD value is increasing.
🟠 Orange Dot: Warning Signal. The bullish trend is still active, but the momentum is slowing down (MACD is lower than the previous bar).
🔴 Red Dot: Exit Signal. The bullish condition has ended. It’s time to consider closing the position or tightening stops.
Key Features
Reduced Lag: DEMA integration provides earlier signals than standard EMA-based MACDs.
Trend Monitoring: Easily distinguish between a healthy trend (Green) and a tiring trend (Orange).
Customizable: Choose between EMA and SMA for both the oscillator and signal calculations.
Crossover Markers: Optional triangle markers for classic MACD crossovers (can be enabled in settings).

DENIES KRESNA SANTA FOOTSTEPOne very cold night, Santa was counting the good deeds of the children in each house to give them Christmas presents.
The children in the town were curious about which house would receive the gift. But the children could guess where Santa would deliver the gift based on several indications.
Footstep: Santa was delighted to find a good child's house, jumping high to show his joy, leaving footprints on the roof.
Starlight: The presence of starlight indicated that Santa's jump was so high that it tore through the clouds, allowing light to penetrate the town.
Dwarf: Children in their sleep heard the little noisy voices of the dwarfs, who sometimes came out with Santa.
And the children hoped that one day, Santa would return, leaving the most beautiful Christmas gift, and jump high again, filled with joy...

Aroon (Any Source)Aroon (Any Source)
Overview
This indicator is an enhanced version of the classic Aroon Oscillator. It measures trend dominance based on the recency of highs and lows, with added flexibility to operate on any chosen source series and an optional price-scaling mechanism based on VWAP distance.
What the Indicator Does
The Aroon Oscillator compares how recently the most recent high and low occurred within a lookback window. The result is a bounded oscillator that indicates whether buyers or sellers are currently dominant.
This version adds: - Ability to run Aroon on any source - Optional smoothing to reduce noise - Optional VWAP-based price scaling
Core Outputs
• Aroon Up (0–100): Strength of recent highs
• Aroon Down (0–100): Strength of recent lows
• Aroon Oscillator (−100 to +100): Net dominance (Up − Down)
Inputs and Options
• Source: Input series used for calculations
• Aroon Length: Lookback window
• Use Source for High/Low: Enables Aroon-like mode on any series
• Show Oscillator: Toggles oscillator plot
• Show Aroon Up/Down: Toggles component lines
• Smooth Oscillator: Light smoothing (EMA/RMA/SMA)
• VWAP Price Scaling: Scales signal by VWAP distance normalized by ATR
How to Use It
Use the oscillator as a trend regime filter. Positive values indicate bullish dominance; negative values indicate bearish dominance. VWAP scaling helps suppress signals near equilibrium and emphasize extended moves.
Practical Notes
• Measures recency, not magnitude
• Best used as a regime or bias input
• Especially effective intraday with VWAP scaling

Divergence Multi1. Indicator Overview
Divergence Multi is to detect spread divergence signals between two financial market instruments. It provides references for trading decisions through visualizing spread curves and divergence marks filtered by multiple conditions, and supports various spread calculation methods and dynamic noise reduction functions.
2. My thoughts
In fact, this script is a template. When analyzing trading targets, we often need to compare different assets — divergences derived from the comparison of stock indices, treasury bonds, forex pairs and commodities are highly referenceable. Divergences based on other indicators tend to be overly complicated; we only need simple comparisons. What we should focus on is the turning points of major trends, rather than divergences at various highs and lows or indicator-specific divergences.
3. Detailed Parameter Settings
After loading the indicator, you can adjust various parameters through "Indicator Settings" (click the gear icon on the right side of the indicator name). The parameters are divided into the following categories and can be configured as needed:
3.1 Basic Market Configuration
Market 1: The first reference financial instrument, with a default value of "CME_MINI:ES1!" (E-mini S&P 500 Futures). You can manually enter other instrument codes (e.g., "FX:EURUSD" for EUR/USD forex pair, "NASDAQ:AAPL" for Apple stock).
Market 2: The second reference financial instrument, with a default value of "CBOE:VX1!" (CBOE Volatility Index Futures). It is recommended to select instruments with a certain correlation with Market 1 for more effective divergence detection.
Resolution: The data resolution (timeframe) for calculating the spread, with a default value of "15" (15-minute K-line). Optional values include "1" (1 minute), "60" (1 hour), "D" (1 day), etc.
Use current resolution?: A boolean option (enabled by default). When checked, the indicator uses the current timeframe of the chart for spread calculation; when unchecked, it uses the timeframe set in the "Resolution" parameter.
3.2 Spread Calculation Settings
Spread Calculation Type: The type of spread calculation, with three optional options:
Ratio: Calculates as (Market 1 / Market 2) * 100, suitable for comparing instruments with different price scales.
Difference: Calculates as Market 1 - Market 2, suitable for instruments with similar price ranges and high correlation.
Rate Change: Calculates as [(Market 1/Market 1 - 1) - (Market 2/Market 2 - 1)] * 100, which reflects the difference in the rate of price change between the two instruments.
EMA Length: The period of the EMA (Exponential Moving Average) for smoothing the raw spread, with a default value of 2 (minimum value is 1). A larger value will result in a smoother spread curve but may lag behind price changes.
3.3 Divergence Detection Settings
Show Divergence: A boolean option (enabled by default). When checked, the indicator displays bullish and bearish divergence signals on the chart; when unchecked, the divergence marks are hidden.
Lookback Bars: The number of bars used to calculate price and spread changes, with a default value of 1 (minimum value is 1). It determines the time interval for comparing current and historical data to identify divergence.
Extreme Filter Bars: The number of bars used to judge local price extremes, with a default value of 5 (minimum value is 3). The indicator will only detect divergence when the current price is the highest or lowest within this bar range, which helps filter invalid signals.
3.4 Dynamic Filter Settings
Enable Dynamic Filter: A boolean option (enabled by default). It is used to reduce noise and invalid divergence signals by dynamically adjusting the detection threshold.
ATR Period: The period of ATR (Average True Range) for calculating price volatility, with a default value of 14 (minimum value is 5). It provides a reference for judging the significance of price changes.
Min Ratio Multiplier: The minimum ratio multiplier for divergence strength, with a default value of 0.5 (minimum value is 0.1, adjustable in steps of 0.1). It is used to set the minimum threshold for valid divergence strength.
Strength Period: The period for calculating the moving average of divergence strength, with a default value of 10 (minimum value is 5). It is used to form a dynamic baseline for judging divergence strength.
3.5 Alert Settings
Enable Alerts: A boolean option (enabled by default). When checked, the indicator will trigger pop-up or push alerts when divergence signals are generated; when unchecked, no alerts will be sent.
4. How to Use the Indicator
4.1 Chart Display Interpretation
Spread Curve: The white curve on the chart represents the smoothed spread between the two selected instruments (calculated based on the selected spread type). It reflects the relative price relationship between the two instruments.
Divergence Marks:
Green Tiny Circles: Mark bullish divergence signals. This signal appears when the price of the current chart instrument drops (forms a local low), but the spread rises, and the signal passes the filter conditions. It is a potential bullish reversal reference signal.
Red Tiny Circles: Mark bearish divergence signals. This signal appears when the price of the current chart instrument rises (forms a local high), but the spread drops, and the signal passes the filter conditions. It is a potential bearish reversal reference signal.
Information Table: A white table is displayed in the top left corner of the chart (only on the last bar), which shows:
Current spread calculation type
Current smoothed spread value
The two selected market instruments (Market 1 and Market 2)
4.2 Practical Operation Steps
Configure Parameters: According to your trading variety and timeframe, adjust the "Market 1", "Market 2" and "Resolution" parameters first; then select the appropriate spread calculation type based on the price characteristics of the two instruments.
Filter Signals: If there are too many invalid signals, you can optimize the parameters such as "Extreme Filter Bars", "ATR Period" and "Min Ratio Multiplier" to improve the quality of divergence signals.
Reference Signals: Combine the divergence marks with the current market trend, volume and other technical indicators for comprehensive judgment (do not rely solely on this indicator for trading decisions).
Receive Alerts: Ensure that the "Enable Alerts" option is checked, and configure the alert receiving method in TradingView (e.g., email, push notification) to receive divergence signal reminders in a timely manner.
5. Notes
This indicator is only a technical analysis reference tool and cannot guarantee 100% accurate trading signals. It is recommended to combine with other analysis methods for decision-making.
When selecting Market 1 and Market 2, it is recommended to choose instruments with a certain correlation (e.g., stock index and its volatility index, related futures varieties) to improve the effectiveness of divergence detection.
Different market environments may require adjusting parameter settings (e.g., increasing the EMA length in a volatile market to smooth noise), which needs to be optimized according to actual trading experience.

DENIES KRESNA UFO ENGULFhelping me to choose engulf area
This script help me as snipper indicator to choose where is untouch engulf area yet.


Previous Day Week High Low EQ Extensions FIB BoxPDH / PDL EQ 25–75 Indicator
PDH / PDL EQ 25–75 is a comprehensive market-structure and range-analysis indicator designed to visualize key daily and weekly reference levels directly on the chart. The script automatically plots prior highs and lows, equilibrium levels, range-based extensions, Fibonacci zones, and session opens, providing traders with a structured framework for directional bias, mean reversion, and liquidity-based analysis.
Core Features
Daily Range Framework
Previous Day High (PDH) and Previous Day Low (PDL)
Daily Equilibrium (50%) of the prior day’s range
25% and 75% Quartile Levels for range segmentation
Range Extensions at ±25% and ±50% beyond PDH/PDL
Daily Open (DO) plotted and extended forward
Fibonacci Discount/Premium Zone (61.8%–78.6%) highlighted with a shaded box
These levels are recalculated at the start of each trading day and extended forward for clear intraday reference.
Weekly Range Framework
Previous Week High (PWH) and Previous Week Low (PWL)
Weekly Equilibrium (50%)
Weekly Fibonacci Discount/Premium Zone (61.8%–78.6%)
Weekly Open (WO) plotted and extended
Weekly levels reset automatically at the start of each new trading week and are maintained independently from daily levels.
Visual & Customization Options
Fully configurable colors, line widths, and line styles for every plotted level
Adjustable forward extensions for range and open levels
Optional labels with customizable size and optional price display
Distinct separator lines marking daily and weekly ranges
Independent toggles for:
Extension levels
Fibonacci zones
Labels
The indicator is optimized for clarity while maintaining flexibility for different trading styles and chart layouts.
Technical Implementation Highlights
Uses higher-timeframe data via request.security() to ensure accurate daily and weekly calculations
Automatically anchors PDH, PDL, PWH, and PWL to their true originating bars
Efficient object management using arrays to prevent clutter and maintain platform performance
Designed for overlay use on any intraday or higher-timeframe chart
Use Cases
Identifying premium and discount zones
Mapping mean-reversion and continuation areas
Tracking institutional reference levels
Intraday trading with higher-timeframe context
Futures, forex, crypto, and equity markets

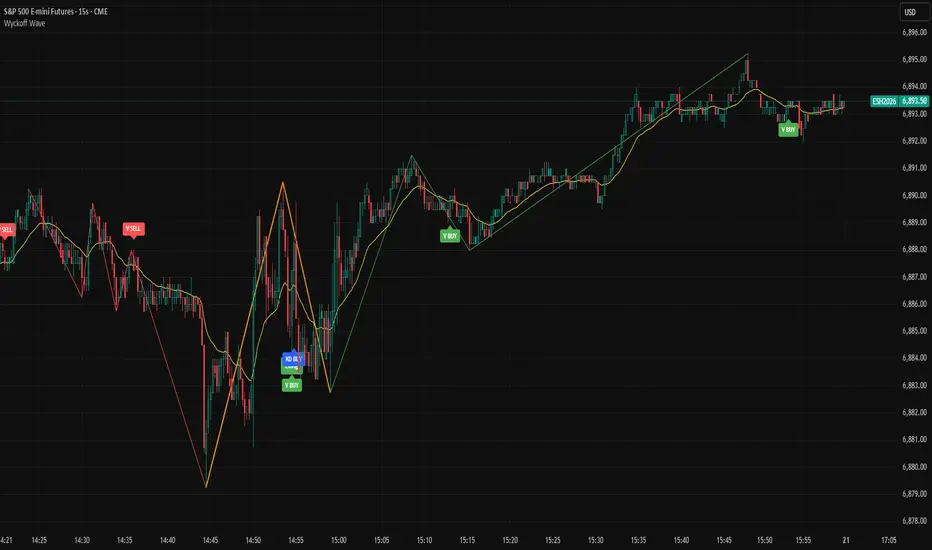
Wyckoff Dual Wave1. Indicator Overview
This Pine Script v5 indicator is built for TradingView, based on Wyckoff Theory. It runs in overlay mode on price charts, featuring dual-wave monitoring for short-term small waves and medium-term large waves. It generates trading signals by combining moving averages, volume analysis, double top/bottom patterns, and KD stochastic indicators. The indicator is suitable for short-term and scalping trading, and can be applied to time frames such as 15 seconds, 1 minute, 3 minutes, and 5 minutes to capture price fluctuations while filtering false signals. It should be noted that the default parameters of this indicator are preset for the 15-second time frame.
2. Some of my thoughts
Wyckoff Wave focuses on dynamic analysis. We need to observe the contest for wave highs and lows. Cumulative trading volume, average volume, and the maximum volume at highs and lows are all helpful for analysis. For the sake of simple and convenient comparison, I only use cumulative trading volume.
For wave analysis, it is necessary for us to refer to the trend of larger time frames. That’s why I use two levels of waves. Instead of adopting specific time frames, I choose large moving averages because, from a certain perspective, large moving averages represent the time frame corresponding to the moving average itself—even more reliably.
3. Input Parameters Explanation
3.1 Core Wave Parameters
Small Wave MA: Default value 50. This is the EMA period used as the base for small wave analysis to define short-term trend boundaries.
Signal MA: Default value 20. This fast EMA is used for double top/bottom signal validation and price crossover detection.
Large Wave MA: Default value 200. This is the EMA period used as the base for large wave analysis to define medium-to-long-term trend boundaries.
PCT Factor: Default value 2.0. This is the ATR multiplier threshold for small wave reversal, controlling the sensitivity of short-term trend changes.
Wave PCT Min: Default value 0.03. This is the minimum price fluctuation percentage required to confirm a valid small wave, filtering minor price movements.
Large Wave PCT Factor: Default value 4.0. This is the ATR multiplier threshold for large wave reversal, controlling the sensitivity of medium-to-long-term trend changes.
Large Wave PCT Min: Default value 0.08. This is the minimum price fluctuation percentage required to confirm a valid large wave, filtering insignificant long-term price swings .
Large Wave Min Bars Distance: Default value 5. This is the minimum number of bars required between pivot highs and lows of large waves, preventing interference from adjacent pivot points.
Min Bars Distance Between Highs/Lows: Default value 3. This is the minimum number of bars required between pivot highs and lows of small waves, filtering dense and invalid pivot points.
3.2 Display Toggle Parameters
Show Large Wave Lines: Default value true. Enables or disables the display of large wave trend lines on the chart.
Show Small Wave MA: Default value false. Toggles the visibility of the small wave base EMA on the chart.
Show Large Wave MA: Default value false. Toggles the visibility of the large wave base EMA on the chart.
Show Signal MA: Default value true. Toggles the visibility of the signal EMA on the chart.
Show Wave: Default value true. Enables or disables the display of small wave trend lines on the chart.
Show Vol: Default value false. Toggles the visibility of volume data and volume labels on the chart.
3.3 Volume Related Parameters
Vol Divisor: Default value 100. This divisor reduces volume values for clearer label display on the chart.
Vol Dist: Default value 2.0. This controls the vertical distance between volume labels and price bars to avoid overlapping.
Vol History Limit: Default value 200. This sets the maximum number of historical volume labels to retain, preventing chart clutter.
3.4 Trend Confirmation Parameters
Trend Confirmation Type: Default value 3-Day Breakaway. It offers three options for trend confirmation rules: Original Rules confirms the trend immediately after a price break; Close Confirmation requires a closing price beyond the pivot point to confirm the trend; 3-Day Breakaway requires three consecutive closing prices beyond the pivot point to validate the trend.
3.5 Signal Display Parameters
Show Long Signals: Default value true. Enables or disables the display of long trading signals on the chart.
Show Short Signals: Default value true. Enables or disables the display of short trading signals on the chart.
Enable Volume Compare Long Signals: Default value true. Triggers additional long signals when pullback volume is lower than the volume of the prior rally phase.
Enable Volume Compare Short Signals: Default value true. Triggers additional short signals when rally volume is lower than the volume of the prior decline phase.
Enable KD Signals: Default value true. Enables or disables trading signals generated by the KD stochastic indicator.
3.6 Pattern Recognition Parameters
Double Pattern ATR Multiplier: Default value 0.0, range from -5.0 to 5.0 with step 0.1. This ATR multiplier is used to calculate the threshold for double top/bottom pattern validation, adjusting the strictness of pattern recognition.
3.7 KD Stochastic Parameters
KD %K Length: Default value 14, minimum 1. This is the calculation period for the %K line of the KD indicator.
KD %K Smoothing: Default value 3, minimum 1. This is the smoothing period for the %K line of the KD indicator.
KD %D Smoothing: Default value 3, minimum 1. This is the calculation period for the %D line of the KD indicator.
KD Overbought Level: Default value 80, range from 50 to 100. This sets the overbought threshold for the KD indicator; values above this level suggest potential short opportunities.
KD Oversold Level: Default value 20, range from 0 to 50. This sets the oversold threshold for the KD indicator; values below this level suggest potential long opportunities.
3.8 Color Customization Parameters
Up Trend Color: Default value green. This is the color used for small wave uptrend lines and related long signal labels.
Down Trend Color: Default value red. This is the color used for small wave downtrend lines and related short signal labels.
Large Wave Up Color: Default value lime. This is the color used for large wave uptrend lines.
Large Wave Down Color: Default value orange. This is the color used for large wave downtrend lines.
4. How to Read Signals and Trade
4.1 Basic Trend Identification
Small Wave Trend: Identified by green (uptrend) or red (downtrend) lines on the chart. Follow small wave trends for short-term trades.
Large Wave Trend: Identified by lime (uptrend) or orange (downtrend) lines. Use large wave trends to filter trades—only take long signals in large uptrends and short signals in large downtrends for higher win rates.
4.2 Trading Signal Types and Usage
Basic Long/Short Signals
Long Signal: Displayed as "Long" label below the price bar. Triggered when price crosses above Signal MA in a small uptrend. Enter long positions on this signal.
Short Signal: Displayed as "Short" label above the price bar. Triggered when price crosses below Signal MA in a small downtrend. Enter short positions on this signal.
Pattern-Based Signals
Double Bottom Buy Signal: Displayed as "DB BUY" or "DBOT" label. Triggered when a double bottom pattern forms in an uptrend. This is a strong long signal—use it for high-confidence entries.
Double Top Short Signal: Displayed as "DT SELL" or "DTOP" label. Triggered when a double top pattern forms in a downtrend. This is a strong short signal.
Volume-Validated Signals
Volume Long Signal: Displayed as "V BUY" label. Triggered when pullback volume is lower than prior rally volume in an uptrend. This confirms buying pressure—use it to add to long positions.
Volume Short Signal: Displayed as "V SELL" label. Triggered when rally volume is lower than prior decline volume in a downtrend. This confirms selling pressure—use it to add to short positions.
KD Resonance Signals
KD Long Signal: Displayed as "KD BUY" label. Triggered when KD %K crosses above oversold level in an uptrend. Use it as a confirmation signal for long entries.
KD Short Signal: Displayed as "KD SELL" label. Triggered when KD %K crosses below overbought level in a downtrend. Use it as a confirmation signal for short entries.
4.3 Signal Filtering Rules (Reduce False Signals)
Trade with the large wave trend: Only take long signals when large wave is in uptrend; only take short signals when large wave is in downtrend.
Combine multiple signal types: Prioritize signals that have both pattern confirmation and volume validation (e.g., DB BUY + V BUY) for higher reliability.
Follow the trend confirmation type: Stick to your chosen trend confirmation rule to avoid premature entries.
5. Risk Management Tips
Do not rely on a single signal—always combine indicator signals with market context (e.g., news, support/resistance levels).
Adjust parameters based on your trading time frame and personal preferences.
Use stop-loss orders: Place stop-loss below the recent pivot low for long positions and above the recent pivot high for short positions to limit losses.
Control position sizes: Adjust position sizes according to your risk tolerance to avoid excessive losses from false signals.
Avoid overtrading: Only take signals that meet your predefined criteria to prevent unnecessary trades.
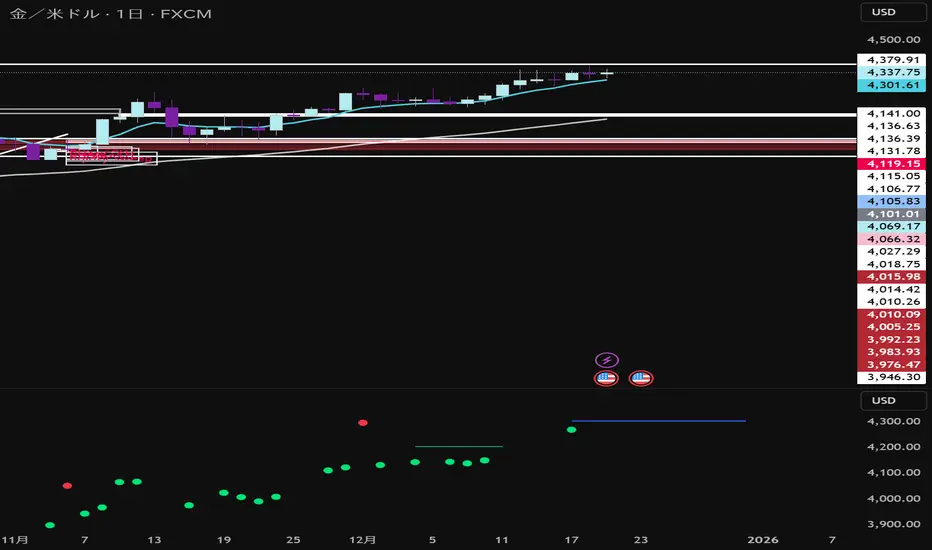
SekakitaMoneyZone本インジケーターは、製作者Sekakitaが実際のトレードで使用している
「相場の波形(Wave Structure)」に基づき、利確候補(TP)を見極めることを目的として開発されました。
相場の流れを視覚的に捉えることで、無駄なエントリーや早すぎる決済を防ぎ、再現性の高いトレード判断を可能にします。
This indicator is developed based on the wave patterns essential to Sekakita’s trading strategy, with the primary goal of identifying potential take-profit (TP) areas.
By visualizing market wave structures in real time, it enables more consistent and disciplined trade management.
OCC Strategy Optimized (MA 5 + Delayed TSL)# OCC Strategy Optimized (MA 5 + Delayed TSL) - User Guide
## Introduction
The **OCC Strategy Optimized** is an enhanced version of the classic **Open Close Cross (OCC)** strategy. This strategy is designed for high-precision trend following, utilizing the crossover logic of Open and Close moving averages to identify market shifts. This optimized version incorporates advanced risk management, multi-timeframe analysis, and a variety of moving average types to provide a robust trading solution for modern markets.
>
> **Special Thanks:** This strategy is based on the original work of **JustUncleL**, a renowned Pine Script developer. You can find their work and profile on TradingView here: (in.tradingview.com).
---
## Key Features
### 1. Optimized Core Logic
- **MA Period (Default: 5):** The strategy is tuned with a shorter MA length to reduce lag and capture trends earlier.
- **Crossing Logic:** Signals are generated when the Moving Average of the **Close** crosses the Moving Average of the **Open**.
### 2. Multi-Timeframe (MTF) Analysis
- **Alternate Resolution:** Use a higher timeframe (Resolution Multiplier) to filter out noise. By default, it uses $3 \times$ your current chart timeframe to confirm the trend.
- **Non-Repainting:** Includes an optional delay offset to ensure signals are confirmed and do not disappear (repaint) after the bar closes.
### 3. Advanced Risk Management
This script features a hierarchical exit system to protect your capital and lock in profits:
- **Fixed Stop Loss (Initial):** Protects against sudden market reversals immediately after entry.
- **Delayed Trailing Stop Loss (TSL):**
- **Activation Delay:** The TSL only activates after the trade reaches a specific profit threshold (e.g., 1%). This prevents being stopped out too early in the trade's development.
- **Ratchet Trail:** Once activated, the stop loss "ratchets" up/down, never moving backward, ensuring you lock in profits as the trend continues.
- **Take Profit (TP):** A fixed percentage target to exit the trade at a pre-defined profit level.
### 4. Versatility
- **12 MA Types:** Choose from SMA, EMA, DEMA, TEMA, WMA, VWMA, SMMA, HullMA, LSMA, ALMA, SSMA, and TMA.
- **Trade Direction:** Toggle between Long-only, Short-only, or Both.
- **Visuals:** Optional bar coloring to visualize the trend directly on the candlesticks.
---
## User Input Guide
### Core Settings
- **Use Alternate Resolution?:** Enable this to use the MTF logic.
- **Multiplier for Alternate Resolution:** How many charts higher the "filter" timeframe should be.
- **MA Type:** Select your preferred moving average smoothing method.
- **MA Period:** The length of the Open/Close averages.
- **Delay Open/Close MA:** Use `1` or higher to force non-repainting behavior.
### Risk Management Settings
- **Use Trailing Stop Loss?:** Enables the TSL system.
- **Trailing Stop %:** The distance the stop follows behind the price (Optimized Default: 1.5%).
- **TSL Activation % (Delay):** The profit % required before the TSL starts moving. (Optimized Default: 2.0% to ensure 0.5% profit is locked immediately).
- **Initial Fixed Stop Loss %:** Your hard stop if the trade immediately goes against you.
- **Take Profit %:** Your ultimate profit target for the trade.
---
## How to Trade with This Strategy
1. **Identify the Trend:** Look for the Moving Average lines (Close vs Open) to cross.
2. **Wait for Confirmation:** If using MTF, ensure the higher timeframe also shows a trend change.
3. **Manage the Trade:** Let the TSL work. With the default **2.0% Activation** and **1.5% Trail**, the strategy will automatically lock in **0.5% profit** the moment the threshold is hit, then follow the price higher.
4. **Position Sizing:** Adjust the `Properties` tab in the script settings to match your desired capital allocation (Default is 10% of equity).
---
## Recommended Settings
1. Trialing < Activation
2. Check ranging
## Credits
Original Strategy by: **JustUncleL**
Optimized and Enhanced by: **Antigravity AI**

Triple EMA (TEMA) + Slope LeadThis indicator plots a standard Triple EMA (TEMA) and an optional slope-lead version. TEMA is a low-lag moving average built from three EMAs, allowing it to track price more closely than a single EMA. The Lead Strength (k) adds a small forward “push” based on the recent TEMA slope:
TEMA_lead = TEMA + k × (TEMA − TEMA ). Higher k values make the line react earlier but increase sensitivity in chop.
Used as a source for other indicators (RSI, MACD, stochastic, regime filters, etc.), TEMA or TEMA-Lead may improve signal quality by reducing noise, aligning momentum readings with trend direction, and producing earlier, cleaner transitions at turns, often without the excessive lag introduced by heavier smoothing.
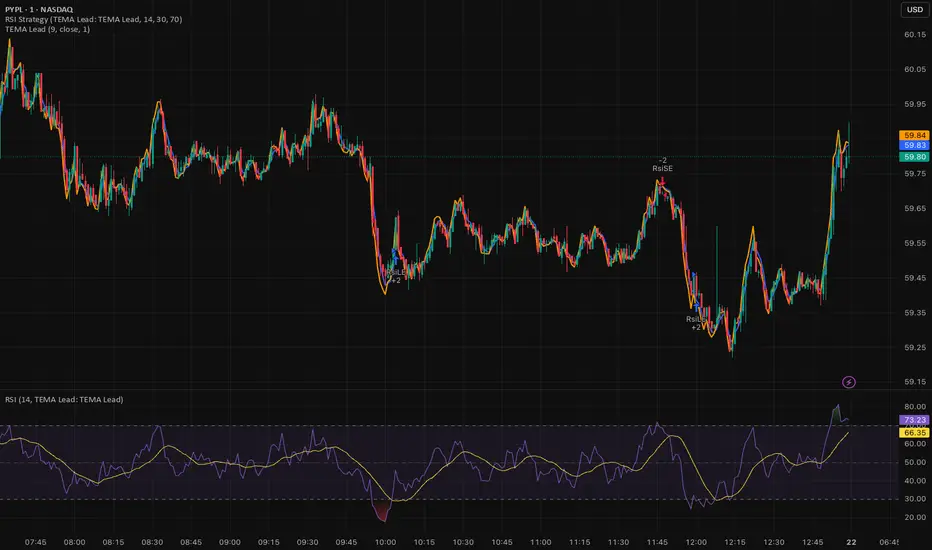
RSI (Any Source) StrategyThis is a simple RSI crossover/crossunder strategy. It calculates RSI on a user-selected Source (default close) using the chosen Length (default 14). It enters a long when RSI crosses up through the Oversold level (default 30), and enters a short when RSI crosses down through the Overbought level (default 70). It does not include explicit exits—each new signal effectively flips/replaces the position via a new entry.

Medium-term TrendThis Medium-term Trend indicator is designed to identify short, mid, and long-term price pivots, track trend directions, and visualize key support and resistance zones. It excels at analyzing mid-term trends, the most optimal timeframe for traders, and delivers greater reliability when applied to larger chart periods. The indicator helps you dynamically observe the battle between bullish and bearish forces at mid-term highs and lows, enabling you to align your trades with the prevailing trend.
How to Use This Script
1. Core Parameter Adjustment
The only critical adjustable parameter for trend validation is Retrace Percentage (%).It defaults to 0.01, with a range of 0 to 20.0 (adjustable in 0.01 increments). This parameter defines the minimum retracement percentage required to confirm a trend change from bullish to bearish or vice versa. A higher value means a more conservative trend change confirmation (fewer false signals), while a lower value captures more frequent trend shifts (may include more noise).
2. Visual Display Controls (Toggle On/Off)
You can enable or disable the following visual elements via the indicator settings panel to match your chart clarity needs.
Pivot Point Displays
Show Short Points: Disable by default. When enabled, small green circles mark short-term lows and small red circles mark short-term highs, with tooltips showing the exact pivot price.
Show Mid Points: Enables by default. When enabled, tiny yellow circles mark mid-term lows and mid-term highs (the core of the indicator), with tooltips showing the exact pivot price. These points are key for identifying mid-term trend direction.
Show Long Points: Disables by default. When enabled, small blue circles mark long-term lows and long-term highs, with tooltips showing the exact pivot price.
Trend Channel Displays
Show Short Channel: Disables by default. When enabled, green lines connect consecutive short-term lows and red lines connect consecutive short-term highs, forming a short-term price channel.
Show Mid Channel: Disables by default. When enabled, yellow lines connect consecutive mid-term lows and mid-term highs, forming a mid-term price channel that clearly visualizes the mid-term trend trajectory.
Show Long Channel: Disables by default. When enabled, blue lines connect consecutive long-term lows and long-term highs, forming a long-term price channel for broader trend analysis.
Mid-term Pivot Rectangles (Core Visual Element)
Show Mid Rectangles: Enables by default. When enabled, transparent rectangles mark mid-term pivot zones (support and resistance) with dynamic break tracking.These rectangles extend to the right until the trend completes, helping you monitor price interactions with key mid-term levels.
3. Trend Identification & Trading Guidance
Key Trend Rules (Mid-term Focus)
Uptrend Confirmation: When mid-term lows show a sequential upward pattern (each subsequent mid-term low is higher than the previous one), the mid-term trend is bullish (uptrend).Downtrend Confirmation: When mid-term highs show a sequential downward pattern (each subsequent mid-term high is lower than the previous one), the mid-term trend is bearish (downtrend).Range Bound Condition: When mid-term highs and lows move sideways (no clear upward/downward sequence), the market is in a mid-term range.
4.How to Align Trades with the Trend
Observe Mid-term Pivot Interactions: Pay close attention to price reactions at the mid-term rectangles (purple for support, orange for resistance). These zones represent key battle areas between bulls and bears.
Uptrend Trading: In a confirmed mid-term uptrend, prioritize long trades when price touches or bounces from mid-term support rectangles (purple), with stop losses placed below the support rectangle’s bottom edge.
Downtrend Trading: In a confirmed mid-term downtrend, prioritize short trades when price touches or rejects from mid-term resistance rectangles (orange), with stop losses placed above the resistance rectangle’s top edge.
Range Trading: In a mid-term range, trade between consecutive mid-term support (purple) and resistance (orange) rectangles—buy near support and sell near resistance, with tight stop losses beyond the rectangle edges.
Trend Breakout Confirmation: When price closes beyond the top (uptrend breakout) or bottom (downtrend breakout) of a mid-term rectangle, and the rectangle stops extending, this signals a potential mid-term trend shift. Wait for a retest of the broken rectangle (if applicable) to enter trades in the direction of the breakout.
5. Best Practices
Optimal Timeframes: While the indicator works on all timeframes, it performs best on larger periods (4-hour, daily, weekly) where mid-term trends are more defined and less prone to noise.Mid-term Focus: For consistent trading results, prioritize mid-term signals (yellow pivot points, mid rectangles) over short-term signals, as mid-term trends offer higher probability trades with favorable risk-reward ratios.Avoid Overcluttering: Keep short-term and long-term displays disabled by default unless you need multi-timeframe confluence. Enabling too many visual elements can obscure key mid-term trend signals.Parameter Fine-Tuning: Adjust the Retrace Percentage (%) based on your asset’s volatility—use higher values (e.g., 0.5 to 2.0) for volatile assets (cryptocurrencies) and lower values (e.g., 0.01 to 0.2) for less volatile assets (blue-chip stocks).Dynamic Analysis: Regularly monitor the evolution of mid-term pivot rectangles and pivot point sequences—trends are not static, and early detection of shifting mid-term highs/lows can help you exit losing trades and capture new trend opportunities.
Disclaimer: This indicator is for educational and analytical purposes only. It does not constitute financial advice. Always conduct your own research and risk assessment before executing trades. For support or customization requests, please send a private message to the author.

Least Squares Moving Average Zero Lag LeadLSMA Zero‑Lag + Lead Indicator
This indicator is a modified Least Squares Moving Average (LSMA) designed to reduce lag and optionally introduce a controlled forward‑leaning (lead) component. It is intended to be used either directly on price or as a smoother, more responsive input source for other indicators such as RSI, MACD, or regime filters.
1. What LSMA Is Doing
LSMA (Least Squares Moving Average) fits a straight‑line regression to the last N bars and evaluates that line at the current bar. Unlike simple or exponential averages, LSMA implicitly models trend direction and slope, which makes it more responsive during directional moves.
2. Zero‑Lag Adjustment
The zero‑lag version applies a simple error‑correction technique:
ZL = 2 × LSMA − LSMA(previous)
This cancels part of the inherent regression delay, producing a smoother line that reacts faster to turns while remaining stable in trends.
3. Lead Component (Optional)
On top of the zero‑lag LSMA, a slope‑based lead is added:
Lead = ZL + k × (ZL − ZL(previous))
Here, the recent slope is projected forward by a user‑controlled factor (k). This does not predict price, but it shifts the average slightly in the direction of current momentum, improving responsiveness for signal generation.
4. Why This Helps RSI and Similar Indicators
RSI and many oscillators operate on raw price changes, which can be noisy and lag‑prone. Feeding RSI with LSMA ZL or LSMA ZL + Lead instead of raw close price:
• Reduces noise without excessive smoothing
• Aligns RSI swings with underlying trend direction
• Improves timing of overbought/oversold transitions
• Reduces late signals after sharp reversals
In practice, this produces an RSI that reacts faster in trends but stays calmer in chop.
5. Practical Usage Tips
• Use LSMA ZL as a clean, low‑lag replacement for price in oscillators
• Add small lead values (0.5–1.0) only if earlier signals are needed
• Avoid high lead values in choppy markets
• Combine with regime or volatility filters for best results
This indicator is best thought of as a signal‑conditioning layer rather than a standalone trading system.

Gann Octave Pro - Angles & Time Cycles 🎯 Gann Octave Pro - Angles & Time Cycles
## Complete Gann Trading System - Price, Angles & Time in One Indicator
A professional-grade Gann analysis tool combining **Octave Price Levels**, **Gann Angles (1x1, 2x1, 1x2)**, and **Advanced Time Cycle Projections**. Perfect for traders seeking precision market timing through geometric confluence.
---
## 🌟 Key Features
### 📐 Octave Price Levels
- **5 Key Levels**: 0%, 25%, 50%, 75%, 100%
- **Color-Coded**: Green (support) → Blue (50% pivot) → Red (resistance) → Black (boundaries)
- **Dynamic Updates**: Auto-adjusts to swing structure
- **Trading Edge**: 50% level is the most powerful reversal zone
### 📏 Gann Angles
- **1x1 Angle** (Black) - Natural 45° trend line
- **2x1 Angle** (Red) - Steep acceleration zone
- **1x2 Angle** (Red) - Gradual support/resistance
- **Customizable Extension**: Fixed bars or % of swing length
### ⏰ Advanced Time Cycles
**Three Calculation Methods:**
1. **Angle-Level Confluence** ⭐ (Recommended)
- Calculates intersections of Gann angles with octave levels
- Most sophisticated timing system
- Based on price-time geometry
2. **Swing Duration** - Uses actual swing bar length
3. **Harmonic (Swing/8)** - Classic Gann harmonic division
**Cycle Visualization:**
- **Full Cycles** (Purple, solid) - Major turning points, labeled "◆ FC1 (176 bars) "
- **Sub-Cycles** (Blue, dotted) - Minor pivots, labeled "S1 "
- **Mid-Cycles** (Orange, dashed) - Half-cycle inflection points
- **Past Display**: Shows 4 complete past cycles for validation
- **Future Projection**: Projects 8 future cycles for anticipation
---
## 🎯 How to Use
### Quick Start
1. Apply to chart (works all timeframes/instruments)
2. Select period: Default 44 bars (adjust based on timeframe)
3. Choose cycle method: "Angle-Level Confluence" for best results
4. Observe past cycles to validate timing accuracy
### Trading Strategies
**Triple Confluence Setup** (Highest Probability)
- Price at octave level (especially 50%)
- Price touches Gann angle (1x1 most reliable)
- Time cycle arrives (full cycle preferred)
- **Entry**: On confluence | **Stop**: Below/above octave level | **Target**: Next level
**Cycle Anticipation**
- Enter 1-2 bars before cycle line if price at octave level
- Exit at next cycle or target octave level
- **Edge**: Anticipate cycles instead of reacting
**Angle Breakout + Cycle**
- Price breaks 1x1 angle + next cycle within 20 bars
- Hold through cycle, exit at 2x1 angle or next major level
---
## ⚙️ Customization
### Period Selection (88-Based)
11 harmonic options: 3, 6, 11, 22, **44**, 88, 176, 352, 704, 1408, 2816 bars
- **Intraday** (15m-1h): Period 3-4
- **Swing Trading** (4h-Daily): Period 4-5
- **Position Trading** (Daily-Weekly): Period 5-6
### Visual Controls
- **Colors**: Independent for all elements
- **Line Widths**: Separate controls (1-5) for levels, angles, cycles
- **Label Size**: Tiny/Small/Normal/Large (unified)
- **Label Position**: Top/Middle/Bottom
- **Show/Hide**: Toggle any component
### Alerts
- 50% octave level breakouts
- Customizable messages
---
## 💡 Pro Tips
1. **Validate First**: Observe 2-3 past cycles before trading
2. **Adjust to Volatility**: High volatility = lower period (22-44), Low = higher (88-176)
3. **Multiple Timeframes**: Apply on different timeframes for confirmation
4. **Respect 50% Level**: Most powerful reversal zone in Gann theory
5. **Focus on Full Cycles**: Highest probability setups (◆ FC markers)
6. **Combine with Price Action**: Indicator shows WHERE/WHEN, price action shows HOW
---
## 🚀 What Makes It Unique
✅ **Intelligent Confluence Cycles** - Unique angle-level intersection calculation
✅ **Historical Validation** - See past cycles to trust future projections
✅ **Professional Design** - Color-coded hierarchy, clean labels, no clutter
✅ **Complete Automation** - Everything updates in real-time
✅ **Three-Dimensional Analysis** - Price + Angles + Time = complete picture
---
## 📊 Best Markets
- Stock indices (S&P 500, NASDAQ, Dow)
- Forex majors (EUR/USD, GBP/USD, USD/JPY)
- Commodities (Gold, Silver, Oil)
- Crypto (BTC, ETH)
- Liquid stocks
✅ Complete Gann system (price + angles + time)
✅ 3 time cycle methods
✅ Auto swing detection
✅ 4 past + 8 future cycle projections
✅ Professional visualization
✅ Extensive customization
✅ Real-time alerts
✅ Works all markets/timeframes
---
## ⚠️ Disclaimer
This indicator is for educational purposes and applies W.D. Gann methodology principles. Not financial advice. Always use proper risk management, position sizing, and stop losses. Practice on paper before live trading. Past performance doesn't guarantee future results.
---
**The market moves in patterns of price and time. This indicator helps you see them.**
Trade with geometry. Trade with time. Trade with confidence.

Butterworth LPF Flip + AutoTune (PF)Butterworth LPF Flip + AutoTune (PF)
This strategy trades price trend flips using two Butterworth low-pass filters (a FAST filter and a SLOW filter). A trade is taken when the FAST filter crosses the SLOW filter. Optionally, the script can auto-tune the filter lengths by simulating many Fast/Slow combinations and selecting the pair with the best Profit Factor (PF).
What the Script Does
- Computes two 2‑pole Butterworth low‑pass filters on price.
- Enters LONG when FAST crosses above SLOW.
- Enters SHORT when FAST crosses below SLOW.
- Optionally simulates many Fast/Slow length combinations internally.
- Chooses the Fast/Slow pair with the highest Profit Factor.
- Trades only the selected best pair.
Manual Mode (Default)
1. Leave Auto‑Tune OFF.
2. Set:
- FAST cutoff period (bars)
- SLOW cutoff period (bars)
3. The strategy will trade using only these values.
Use this mode for normal trading or live deployment.
Auto‑Tune Mode
1. Enable Auto‑Tune.
2. Define Fast and Slow ranges:
- FAST min / max / step
- SLOW min / max / step
3. The script simulates ALL Fast × Slow combinations bar‑by‑bar.
4. Each combination tracks:
- Gross Profit
- Gross Loss
- Closed trades
- Profit Factor (PF = GP / GL)
5. At the end of the chart, the best PF pair is selected and used for trading.
Interpreting the End Box
The status label at the end of the chart reports:
- Whether Auto‑Tune is enabled
- Number of candidate pairs tested
- Best FAST period
- Best SLOW period
- Profit Factor of the best pair
- Win Rate (wins ÷ closed trades)
If PF is near 1.0 or trades are very low, expand the range or length of the test.
Best Practices
- Use Auto‑Tune ONLY for research and optimization.
- After finding good parameters, disable Auto‑Tune and trade manually.
- Keep Fast < Slow (logical separation).
- Longer charts produce more reliable PF results.
- Avoid very small step sizes (performance + noise).
Known Limitations
- Pine Script runs bar‑by‑bar; tuning is approximate, not vectorized.
- Large grids increase execution time.
- Results are historical and NOT predictive.
- Not suitable for live auto‑optimization.
Summary
This script is best viewed as a *research tool first, strategy second*. Use it to discover stable Fast/Slow regimes, then lock them in for simple, repeatable trading.
