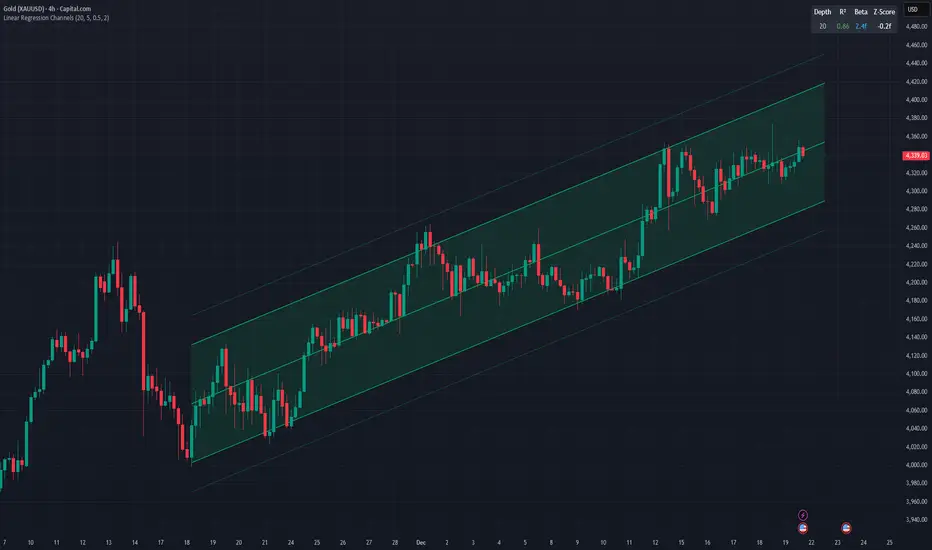
Linear Regression ChannelsThis indicator dynamically identifies and plots the best-fit linear regression channels based on recent pivot points, optimizing for statistical strength across user-defined depths.
How It Works (Technical Methodology)
1. Pivot Point Detection
The indicator uses Pine Script's ta.pivothigh() and ta.pivotlow() functions with a configurable sensitivity length to detect swing highs and lows. All recent pivot indices are stored in an array (limited to avoid performance issues), providing potential starting points for regression calculations.
2. Multi-Depth Evaluation
Users input comma-separated "Pivot History Depths" (e.g., "5,20,50"). For each depth:
- The script evaluates regression fits starting from the most recent pivots, up to the specified depth count.
- It calculates linear regression statistics for each possible channel originating from those pivot bars backward to the current bar.
3. Linear Regression Calculation
For each candidate channel:
- Slope (m) and intercept (b) are computed using least-squares method.
- R-squared (R²) measures goodness of fit (how well price follows the trend line).
- Standard error of the estimate is calculated to quantify volatility around the regression line.
- A composite score = R² × log(length) prioritizes stronger fits on longer periods.
4. Best-Fit Selection and Validation
- Only channels with R² ≥ user-defined minimum (default 0.5) are considered valid.
- The channel with the highest score for each depth is selected and drawn.
- This ensures the most statistically significant and relevant channels are displayed, avoiding weak or short-term noise.
5. Channel Construction
- Mean Line: The regression trend line extended slightly into the future.
- Inner Channels: ± user-configurable standard deviation multiplier (default 2.0σ) around the mean.
- Outer Bands: ±1.5× the inner deviation for additional visual context.
- Filled areas between mean and inner channels for better visibility.
- Color: Green shades for upward slopes (bullish trend), red shades for downward slopes (bearish trend).
6. Dashboard and Statistics
- Optional table in the top-right corner displays for each depth:
- Depth value
- R² (colored green if >0.7, orange otherwise)
- Slope (Beta) – positive blue for uptrend, red for downtrend
- Current Z-Score: How many standard deviations the latest close is from the expected regression value (yellow if |Z| > 2)
How to Use
Regression channels help identify trending markets, potential mean reversion, and overextension.
- Upward Channels (Green): Price above the mean may indicate strength; pullbacks to the mean or lower band offer long opportunities. Overextension above upper band could signal exhaustion.
- Downward Channels (Red): Price below the mean may indicate weakness; rallies to the mean or upper band offer short opportunities. Overextension below lower band could signal capitulation.
- High R² (>0.7): Strong trending channel – trade in direction of slope.
- Low R²: Choppy/range-bound market – avoid trend-following trades.
- Z-Score: |Z| > 2 suggests price is statistically overextended from the trend (potential reversion setup).
- Multi-Depth: Smaller depths catch short-term trends; larger depths capture major trends. Use multiple for confluence across timeframes.
Combine with volume, support/resistance, or other indicators for confirmation.
Disclaimer
This indicator is a technical analysis tool and should be used in conjunction with other forms of analysis. Past performance does not guarantee future results. Always use proper risk management.
Indicadores e estratégias
RVOL Text This script will give you the Relative volume at the time in a numbered text on your charts.

Prop ES EMA Cross during Single/Dual Trading SessionEMA crossover strategy for ES futures optimized for prop firm rules.
Choose long-only, short-only, or both directions.
Customizable short and long EMA lengths.
Enter trades during one or two configurable sessions specified in New York time.
Fixed TP/SL in ticks with forced close by 4:59 PM NY time.

Hybrid CCI Scalper ProHybrid CCI Scalper Pro is a sophisticated trading system designed to solve the biggest problem in scalping: False Signals in Choppy Markets.
Unlike standard CCI indicators that fire on every crossover, the HCS Pro uses a Hybrid Logic Engine that distinguishes between high-probability Trend Continuations and powerful Reversal Setups. It processes every potential entry through a 6-factor "Quality Filter" before generating a signal.
Core Features:
1. The Hybrid Signal Engine The script identifies two distinct market conditions:
TREND Mode: Triggers when price is aligned with the Daily/Local trend AND the CCI angle is steep.
REVERSAL Mode (REV): Triggers only on Extreme Momentum (steep angle) combined with a Zero-Line cross, allowing you to catch tops and bottoms without waiting for lagging trend indicators.
2. The Quality Scoring System (Q-Score) Every signal is rated from 0 to 6 stars based on confluence. The signal label shows Q: 4/6, Q: 5/6, etc.
Score 4+: High probability (Recommended).
Score 6: "The Perfect Storm" – All filters (Trend, Volume, RSI, ADX) align.
3. The "Ironclad" Filters To eliminate fake-outs, the script enforces strict rules:
Candle Color Guard: Never Buys on a Red candle or Sells on a Green one.
Angle validation: Flat CCI movement is ignored.
MTF Trend: Checks the Daily timeframe (D1 EMA) to ensure you aren't scalping against the major flow.
Noise Filter: Uses ATR and Volume to ignore low-volatility "dead" markets.
4. The Information Panel A clean dashboard on the top-right displays real-time metrics:
Current Daily Trend (Bull/Bear)
Momentum Strength (Weak/Strong/Extreme)
ADX Power (Trending vs Ranging)
Live Signal Score
How to Trade:
BUY Signal: Look for a Green Triangle. Ideally, the Label should say TREND or REV with a Quality Score of 4/6 or higher.
SELL Signal: Look for a Red Triangle with a high Quality Score.
No Signal? If the panel says "WAIT" or the score is low, the market is likely choppy. Stay out.
Recommended Settings:
Gold (XAUUSD): Works best on 15m.
Forex (EURUSD): Works well on 5m - 15m.
Default settings are optimized for a balance between frequency and accuracy.

cd_VW_Cx IMPROVED - Quant VWAP System: Regime, Magnets & Z-ScoQuant VWAP System: Regime, Magnets & Z-Score Matrix
This indicator is a comprehensive Quantitative Trading System designed to move beyond simple support and resistance. Instead of static lines, it uses Statistical Probability (Z-Score) and Standard Deviation to define the current market regime, identify institutional value zones, and project high-probability liquidity targets.
It is engineered for Day Traders and Scalpers (Crypto & Futures) who need to know if the market is Trending, Ranging, or preparing for a Breakout.
1. The "Regime" System (Standard Deviation Bands)
The core engine anchors a VWAP (Volume Weighted Average Price) to your chosen timeframe (Daily, Weekly, or Monthly) and projects volatility bands based on market variance.
The Trend Zone (Inner Band / 1.0 SD): This is the "Fair Value" zone. In a healthy trend, price will pull back into this zone and hold. A hold here signals a high-probability continuation (Trend Following).
The Reversion Zone (Outer Band / 2.0 SD): This represents a statistical extreme. Price rarely sustains movement beyond 2 Standard Deviations without a reversion. A touch of this band signals "Overbought" or "Oversold" conditions.
2. Liquidity Magnets (Virgin VWAPs)
The script automatically tracks "Unvisited VWAPs" from previous sessions. These are price levels where significant volume occurred but have not yet been re-tested.
The Logic: Algorithms often target these "open loops." The script visualizes them as Blue Dashed Lines with price tags.
Smart Scaling (Anti-Scrunch): Includes a custom "Ghost Engine" that automatically hides or "ghosts" magnets that are too far away. This prevents your chart from being squashed (scrunched) on lower timeframes, keeping your candles perfectly readable while still tracking targets in the background.
3. The Quant Matrix (Dashboard)
A real-time Heads-Up Display (HUD) that interprets the data for you:
Regime: Detects Volatility Squeezes. If the bands compress, it signals "⚠ SQUEEZE", warning you to stop mean-reversion trading and prepare for an explosive breakout.
Bias: Color-coded Trend Direction (Bullish/Bearish) based on VWAP slope.
Signal: actionable text prompts such as "BUY DIP" (Trend Following), "FADE EXT" (Mean Reversion), or "PREP BREAK" (Squeeze).
4. Visual Intelligence
Bold Day Separators: Clear, vertical dotted dividers with Date Stamps to instantly separate trading sessions.
Dynamic Labels: Floating labels on the right axis identify exactly which deviation level is which, preventing chart confusion.
How to Use
Strategy A: The Trend Pullback (continuation)
Check Matrix: Ensure Bias is BULLISH (Green).
Wait: Allow price to pull back into the Inner Band (Dark Green Zone).
Trigger: If price holds the Center VWAP or the -1.0 SD line, enter Long.
Target: The next Liquidity Magnet above or the +2.0 SD band.
Strategy B: The Reversion Fade (Counter-Trend)
Check Matrix: Ensure price is labeled "EXTREME" or Signal says "FADE EXT".
Trigger: Price touches or pierces the Outer Band (2.0 SD).
Action: Enter counter-trend (Short) with a target back to the Center VWAP (Mean Reversion).
Strategy C: The Magnet Target
Identify a "MAGNET" line (Blue Dashed) near current price.
These act as high-probability Take Profit levels. Price will often rush to these levels to "close the loop" before reversing.
Settings
Anchor: Daily (default), Weekly, or Monthly.
Magnet Focus Range: Adjusts how aggressively the script hides distant magnets to fix chart scaling (Default: 2%).
Visuals: Fully customizable colors, label sizes, and dashboard position.

Witch-Fire ALMA signals: Dynamic Liquidity & Trend GlowThe Witch-Fire ALMA is a high-precision trend bias and liquidity mapping tool designed for price action traders and Smart Money practitioners. Unlike traditional indicators that clutter your chart with lagging signals, this script provides a "clean-yet-powerful" visual anchor to help you stay on the right side of the market while identifying key Points of Interest (POIs).
At its core, the script utilizes an optimized Arnaud Legoux Moving Average (ALMA). Known for its superior ability to balance smoothness and responsiveness, the ALMA effectively filters out market noise and "whipsaws" that often plague standard EMAs.
Key Features:
The Witch-Fire Glow: A neon-styled ALMA line that shifts between Bullish Green and Bearish Red. The white core provides surgical precision for price intersection, while the outer glow visualizes the strength and dominance of the current trend.
Scaled Liquidity Levels: Automatically maps Buy Side Liquidity (BSL) and Sell Side Liquidity (SSL). These levels are dynamic—they scale proportionally with your ALMA settings. This ensures that the liquidity zones you see are always relevant to the trend cycle you are analyzing.
Strategic Bias Background: A subtle background tint provides an instant psychological filter. Only look for Longs in the green zone and Shorts in the red zone to maintain a high-probability strike rate.
How to Trade with Witch-Fire:
Identify the Bias: Look at the Fire ALMA. If the "fire" is red and the price is below the line, your bias is strictly bearish.
Watch the Sweeps: Wait for the price to "sweep" (pierce with a wick) the horizontal SSL (Green) or BSL (Red) lines.
Execution: Look for a strong rejection candle (long wick, small body) at these levels that closes back towards the ALMA line.
Best Used On: 15m, 1H, and 4H timeframes. Works exceptionally well for Crypto, Forex, and Indices.

Seasonality Monthly v2.0-SanjayMonthly seasonality refers to recurring patterns or fluctuations in data that repeat every month due to predictable factors like weather, holidays, or business cycles. For example, retail sales often peak in December due to holiday shopping, while utility usage may rise in summer because of air conditioning. Identifying monthly seasonality helps businesses forecast demand, allocate resources, and plan operations more accurately.
Seasonality significantly impacts forecasting because it introduces predictable, recurring patterns into data that must be accounted for to improve accuracy. If seasonal effects—such as higher sales during holidays or increased energy demand in summer—are ignored, forecasts can be misleading, leading to overproduction or stockouts. Incorporating seasonality into models (e.g., using seasonal decomposition or SARIMA) helps capture these cyclical variations, ensuring that predictions reflect real-world trends rather than just overall averages.

EMA 1 & SALMA Intersection StrategyTrading Strategy: EMA 1 & SALMA Crossover System
This strategy is a Trend-Following system that focuses on the direct interaction between the price (represented by EMA 1) and a smoothed trendline (SALMA). Instead of relying on the color changes of the indicator, it uses mechanical crossover signals to enter and exit trades.
1. Indicators Used
EMA 1 (Exponential Moving Average): Since the period is 1, it effectively represents the Current Price. It reacts instantly to every market move.
SALMA v3.0 (Smoothed Adaptive Lattice Moving Average): A double-smoothed moving average that acts as the "Base Line" or "Trend Support/Resistance."
RSI (Relative Strength Index): Used as a Momentum Filter to ensure we don't trade against the market's strength.
2. Buy (Long) Entry Rules
You enter a Long position when the following conditions are met:
The Crossover: The EMA 1 (Price) crosses ABOVE the SALMA line. This indicates that the short-term momentum is shifting higher than the average trend.
The Filter (RSI): The RSI must be above 50. This confirms that the buyers are in control and the upward move has enough strength.
3. Sell (Short) Entry Rules
You enter a Short position when the following conditions are met:
The Crossunder: The EMA 1 (Price) crosses BELOW the SALMA line. This indicates a breakdown in price action.
The Filter (RSI): The RSI must be below 50. This confirms that the sellers are dominating and the downward momentum is real.
4. Key Advantages of This System
Objectivity: You don't guess based on the color of the line; you wait for a clear physical break (cross) of the line.
Precision: By using EMA 1, you get the earliest possible entry signal compared to slower moving averages.
False Signal Protection: The RSI 50 filter prevents you from entering "weak" trades where the price crosses the line but lacks the volume or momentum to continue.

Price Action High 2 + Risk/Reward VisualizerIntroduction: Price Action High 2 (Bull Flag) Setup
This script identifies the High 2 (H2) setup, a staple price action pattern popularized by Al Brooks. The High 2 is a high-probability continuation pattern designed to catch the resumption of a bull trend after a two-legged pullback (a "complex" bull flag).
In a strong uptrend, the first attempt to end a pullback often fails (High 1). The High 2 represents the second, and usually more reliable, attempt by bulls to take control, often forming a "double bottom" structure within the flag.
How the Logic Works
The indicator follows a strict state-machine logic to ensure the pattern is valid:
Trend Confirmation: The script filters for an established uptrend where price is above a rising EMA (adjustable in settings).
Pullback Identification: It looks for a sequence of bars making lower highs.
High 1 (H1): The first bar in the correction that breaks above the high of the prior bar.
The Second Leg: The script then waits for the price to again fail to break a high, confirming a second leg of the pullback.
High 2 (H2): The signal is triggered when a bar breaks the high of the previous bar for the second time.
Key Features
Signal Bar Quality Filter: Not all High 2s are equal. This script includes a filter ensuring the signal bar closes in the upper portion of its range (bullish conviction) to avoid "weak" breakouts.
Automated Risk/Reward Visualizer: Upon a signal, the script automatically projects a Stop Loss (at the signal bar low) and a Take Profit level based on a customizable R:R ratio.
Clean Visuals: Labeled "H2" markers and dashed trend lines keep the chart uncluttered.
How to Trade It
Entry: Place a buy-stop order 1 tick above the High 2 signal bar.
Stop Loss: Traditionally placed below the low of the signal bar or the most recent swing low.
Target: Common targets include a 1:2 Risk/Reward ratio or the previous major swing high.
Settings Guide
EMA Length: Adjust this to match your timeframe (e.g., 20 for intraday, 50 for daily).
Min Close %: Set this to 50% or higher to ensure you only take trades where the bulls finished the bar strong.
Risk:Reward Ratio: Customize your profit targets to align with your personal trading plan.

WatermarkAdds watermark text to the chart with configurable text, size, color, transparency % and vertical spread %

Pressure Windows [Lite]PRESSURE WINDOWS — Lite is a stripped-down time-cycle instrument based on Jim Hurst’s Time-Cycles method. It lets you define a primary cycle using two major lows and project basic harmonic subdivisions forward in time. The Lite version is designed to expose coarse timing pressure, not full cycle resolution. This is a structural timing tool — not a prediction engine.
What the Lite Version Shows :
A primary time cycle defined by two anchor points
Single-level harmonic subdivision only:
-1/2 (halves)
-1/3 (thirds)
Forward projection of the cycle into the future
Internal verification lines inside the base cycle to check fit
What it does not do (by design):
No chained subdivisions (no 1/2→1/2 or 1/3→1/2)
No higher-resolution nesting
No regime logic or shaded “windows”
Those belong to the full instrument.
How to Use (Lite Workflow) :
1. Define the Cycle :
Add the indicator to your chart
Select Time 1 at a major low
Select Time 2 at the next major low
(You can fine-tune both in the settings)
2. Choose a Subdivision :
In settings:
None → only the primary cycle
1/2 → midpoint timing pressure
1/3 → third-based rhythm
3. Verify Before Trusting :
Look at the subdivisions inside the base cycle:
Do intermediate lows align with halves or thirds?
If they don’t, don’t force it
The Lite version is intentionally coarse — its job is to answer:
“Is the market vibrating in 2s or 3s?”
Not to overfit timing.
Best Practices :
Works best on higher timeframes (Daily / Weekly)
Use Log scale for long-term structure (time remains linear)
Treat projections as zones of pressure, not turning points
Important Note :
Pressure Windows — Lite limits subdivision depth on purpose, if you need nested timing resolution and finer pressure mapping, that’s what the full version is built for.
*This script doesn't constitute investment advice and isn't created solely for qualified investors.

9:30 AM EST 5-Min Candle High/Low LinesThis will draw a horizontal line on the highs and lows of the first 5 min candle of the day. both lines will extend until 1 PM EST that same day.

S.EQ - Macro TrackerMacro Tracker Indicator - Description
This TradingView indicator visualizes macro time windows throughout the trading day, marking specific 33-minute periods that occur hourly (from XX:42 to XX:15 of the next hour) in the America/New_York timezone.
Core Functionality
Time Windows Tracked:
The indicator monitors 24 hourly macro periods (e.g., 00:42-01:15, 01:42-02:15, etc.)
Each period spans 33 minutes, starting at 42 minutes past the hour and ending at 15 minutes past the next hour
Special periods for the last trading hour (14:42-15:15, 15:42-16:15) with an optional 15:15-15:45 window
---------------------------------------------------------------------------------
Visual Display Modes
1. On Chart Mode (Default)
Draws vertical lines at the start and end of each macro period
Displays a horizontal line at the top connecting the boundaries
Shows optional labels with time stamps at the midpoint
Midline Feature: Adds a dotted vertical line at XX:00 (the hour mark) within each macro period
Projects dotted extension lines toward current price action when enabled
Dynamically adjusts line heights based on price movement within the period
2. New Pane Mode
Displays macro periods as colored boxes in a separate indicator pane
Useful for cleaner chart visualization when tracking multiple periods
---------------------------------------------------------------------------------
Key Features
Customizable Display: Toggle individual macro periods on/off, choose colors, and control label visibility
Time Labels: Optional display of exact time ranges on each macro period
Projections: Extension lines that project from macro boundaries toward current price
Midline Markers: Dotted lines showing the hour mark (XX:00) within each macro period
Weekend Handling: Automatically adjusts for Friday closes and weekend gaps (non-crypto markets)
Memory Management: Automatically cleans up old drawing objects to maintain performance

Pre-Market + Daily + Weekly RTH Range Boxes📦 Pre-Market + Daily + Weekly RTH Range Boxes
This indicator automatically plots Pre-Market, Daily, and Weekly range boxes based strictly on US Regular Trading Hours (RTH).
What it does:
Pre-Market Box (04:00–09:30)
Captures the full pre-market high and low, then projects the range forward from the RTH open.
Daily RTH Box (09:30–16:00)
Tracks the previous day’s regular session high and low and plots the range starting at 04:00 the next day.
Weekly RTH Box (Mon–Fri, 09:30–16:00)
Accumulates the full weekly RTH range and plots it at 04:00 on Monday.

Support Resistance + RSI + 4 EMA (Doge_SV)Overview
This comprehensive indicator is designed to provide traders with a "bird's-eye view" of the market by combining three essential technical analysis tools into a single, clean interface. It helps in identifying trend direction, key price levels, and momentum across multiple timeframes without cluttering your workspace.
Key Features
1. Dynamic Support & Resistance (S/R)
The script automatically identifies and plots significant Support and Resistance levels based on pivot points.
Dynamic Zones: It highlights areas where price has historically reacted, helping you find high-probability entry and exit points.
Strength Filtering: Includes a built-in algorithm to display only the most "significant" levels based on their historical strength.
Visual Alerts: Lines and labels change color (Lime for Support, Red for Resistance) based on the current price position.
2. Quad-EMA Trend Ribbon (The "Exponential Moving Averages")
The indicator features four of the most widely used EMAs in professional trading to identify trend hierarchy:
EMA 34 (Green): Short-term momentum and immediate support/resistance.
EMA 89 (Blue): Intermediate-term trend filter (The "Trend Core").
EMA 200 (Black): Long-term trend baseline (The "Institutional Level").
EMA 633 (Purple): Ultra-long-term trend, often used for major cycle analysis.
3. Multi-Timeframe (MTF) RSI Dashboard
Stay informed about overbought or oversold conditions across all timeframes simultaneously.
Real-time Table: A neat table in the corner of your chart displays RSI (14) values from 1 minute up to 1 day.
Heatmap Logic: The table cells automatically change color based on intensity:
Red/Orange: Overbought (RSI > 70/80)
Green/Dark Green: Oversold (RSI < 30/20)
White: Neutral zone.
How to Use
Trend Alignment: Look for the 4-EMAs to be stacked in order (34 > 89 > 200 > 633 for a Bullish trend).
S/R Confirmation: When price approaches a Red Resistance line, check the RSI Dashboard. If higher timeframes are also Overbought, it increases the probability of a reversal.
Breakout Detection: Use the Support/Resistance lines to identify potential breakouts or "Role Reversal" (where old resistance becomes new support).

EMA & Stochastic SignalsEma 200 and ema 500 + stochastic crossover. Buys when price is above emas and sells when price is below emas.

[ASFX] Free Automatic VWAPsAutomatic VWAP & Key Levels
Overview
This indicator is designed to help traders evaluate VWAP interactions in context, rather than treating every VWAP touch as a trade opportunity. It combines VWAP with a momentum-based directional filter to highlight situations where price interaction with VWAP is supported by broader intraday momentum. This indicator also shows you the initial balance and opening range each day.
Concept and Originality
VWAP is commonly used as an institutional reference level, but VWAP alone does not distinguish between meaningful acceptance/rejection and random intraday chop. This script addresses that limitation by conditioning VWAP interactions with a momentum filter. Signals are only displayed when price location and momentum alignment occur together, allowing traders to focus on higher-quality VWAP reactions instead of monitoring multiple indicators separately.
How It Works
• VWAP is used as the primary price reference level.
• A momentum filter evaluates directional bias and participation.
• Visual signals appear only when price is interacting with VWAP and momentum confirms acceptance or rejection in the same direction.
• No signals are shown during low-momentum or sideways conditions around VWAP.
How to Use
This indicator is best used as a confirmation tool, not as a standalone trading system. It is intended to assist traders in filtering VWAP-based trade ideas by highlighting when conditions are aligned versus when price is simply chopping around VWAP.
Markets and Timeframes
• Designed for index futures such as ES and NQ
• Optimized for intraday trading
• Works best on lower timeframes (1–5 minute charts)
Limitations
• Not predictive
• Not a complete trading strategy
• Does not replace price action analysis, trade management, or risk control
• Signals should be evaluated alongside market structure and context

ICT Liquidity Sweep/Swing Fail Pattern V.1# ICT Liquidity Sweep/Swing Fail Pattern V.1
## Indicator Description & User Guide
---
## 📊 Indicator Overview
**Name:** ICT Liquidity Sweep/Swing Fail Pattern V.1
**Type:** Support/Resistance & Liquidity Detection
**Trading Style:** ICT Concepts (Inner Circle Trader)
**Best Timeframes:** 1M, 5M, 15M, 1H
---
## 🎯 Core Features
### 1. **Support & Resistance Lines**
- Automatically draws key swing high and swing low levels
- Based on significant pivot points in price structure
- Updates dynamically as new swings form
### 2. **"X" Mark - Liquidity Sweep**
- **Symbol:** X marker on chart
- **Meaning:** Indicates a liquidity sweep (stop hunt)
- **What it shows:** Price briefly moved beyond a key level to trigger stops, then reversed
- **Trading significance:** High-probability reversal zones after liquidity is taken
### 3. **"SFP" Label - Swing Failure Pattern**
- **Symbol:** SFP text label
- **Meaning:** Swing Failure Pattern detected
- **What it shows:** Price attempted to make a new high/low but failed and reversed sharply
- **Trading significance:** Strong reversal signal - smart money rejecting the level
---
## 📈 How to Use This Indicator
### Entry Setup Strategy:
#### **For SHORT Trades (Sell):**
1. Wait for **SFP** to appear at a swing high
2. Look for **X marker** confirming liquidity sweep above the high
3. **Entry Zone (Red Box):** Enter SHORT positions when price returns to this zone
4. **Stop Loss:** Place above the red zone (above the swept high)
5. **Take Profit (Green Box):** Target the green zone below
#### **For LONG Trades (Buy):**
1. Wait for **SFP** to appear at a swing low
2. Look for **X marker** confirming liquidity sweep below the low
3. **Entry Zone (Green Box):** Enter LONG positions when price returns to this zone
4. **Stop Loss:** Place below the green zone (below the swept low)
5. **Take Profit (Red Box):** Target the red zone above
---
## 🎨 Color Coding System
| Color | Zone Type | Usage |
|-------|-----------|-------|
| 🔴 **Red Box** | Stop Loss / Supply Zone | Place SL here for LONG trades / Entry zone for SHORT trades |
| 🟢 **Green Box** | Take Profit / Demand Zone | Target zone for LONG trades / Place SL here for SHORT trades |
| ❌ **X Mark** | Liquidity Sweep Point | Stop hunt occurred - reversal likely |
| 📝 **SFP Label** | Swing Failure Pattern | Failed breakout - strong reversal signal |
---
## 💡 Trading Examples
### Example 1: SHORT Trade (As shown in your chart)
```
1. SFP appears at swing high (Red zone around 4,000)
2. X marker confirms liquidity sweep above the high
3. Entry: SHORT when price re-enters red zone
4. Stop Loss: Above red zone (e.g., 4,002)
5. Take Profit: Green zone below (3,964-3,972)
6. Risk:Reward = 1:3+
```
### Example 2: LONG Trade
```
1. SFP appears at swing low (Green zone)
2. X marker confirms liquidity sweep below the low
3. Entry: LONG when price re-enters green zone
4. Stop Loss: Below green zone
5. Take Profit: Previous red zone above
6. Risk:Reward = 1:2 minimum
```
---
## ⚠️ Important Trading Rules
### ✅ DO:
- Wait for BOTH SFP and X marker confirmation
- Enter on price returning to the zone (not on first touch)
- Use proper position sizing (1-2% risk per trade)
- Combine with market structure analysis
- Look for confluences (orderblocks, fair value gaps)
### ❌ DON'T:
- Trade against the higher timeframe trend
- Enter without confirmation signals
- Ignore the colored zones for SL/TP placement
- Overtrade - wait for quality setups
- Move stop loss to breakeven too early
---
## 🔧 Indicator Settings (Typical)
**Adjustable Parameters:**
- Swing Length: Number of bars to identify swing points
- Show/Hide X markers
- Show/Hide SFP labels
- Zone opacity and colors
- Line thickness
---
## 📚 ICT Concepts Explained
### **Liquidity Sweep:**
Smart money intentionally pushes price beyond key levels to trigger retail stop losses, then reverses to their intended direction. The X marker identifies these moments.
### **Swing Failure Pattern (SFP):**
Price attempts to make a new high/low but lacks follow-through, indicating weak momentum and likely reversal. Similar to a "false breakout" but more specific to swing structures.
### **Supply & Demand Zones:**
- **Red zones** = Areas where selling pressure overwhelmed buyers
- **Green zones** = Areas where buying pressure overwhelmed sellers
- These zones act as magnets for price to return and react
---
## 🎓 Best Practices
1. **Confluence is Key:**
- Combine with daily/weekly bias
- Check for orderblocks nearby
- Look for imbalances (FVG)
2. **Session Timing:**
- Best during London/New York sessions
- Avoid low liquidity periods
3. **Risk Management:**
- Never risk more than 1-2% per trade
- Use proper lot sizing
- Take partial profits at key levels
4. **Timeframe Correlation:**
- Check higher timeframe for bias
- Enter on lower timeframe for precision
- Exit based on higher timeframe targets
---
## 📞 Support & Updates
**Version:** 1.0
**Compatibility:** TradingView Pine Script v5
**Updates:** Regular improvements based on ICT methodology
---
## ⚡ Quick Reference Card
| Signal | Action | SL Placement | TP Target |
|--------|--------|--------------|-----------|
| SFP + X at High | SHORT at Red Zone | Above Red | Green Zone |
| SFP + X at Low | LONG at Green Zone | Below Green | Red Zone |
**Remember:** The indicator shows you WHERE to trade, but YOU decide WHEN based on confirmation and market context.
---
*Disclaimer: This indicator is a tool for technical analysis. Always use proper risk management and never trade with money you cannot afford to lose.*

Pre-Market + Daily + Weekly REGULAR HOURS 📦 Pre-Market + Daily + Weekly RTH Range Boxes
This indicator automatically plots Pre-Market, Daily, and Weekly range boxes based strictly on US Regular Trading Hours (RTH).
What it does:
Pre-Market Box (04:00–09:30)
Captures the full pre-market high and low, then projects the range forward from the RTH open.
Daily RTH Box (09:30–16:00)
Tracks the previous day’s regular session high and low and plots the range starting at 04:00 AM the next day.
Weekly RTH Box (Mon–Fri, 09:30–16:00)
Accumulates the full weekly RTH range and plots it at 04:00 AM on Monday.

VOLD RatioThis indicator calculates the ratio between NYSE Up Volume and Down Volume (USI:UVOL / USI:DVOL).
It helps assess market participation and short-term buying vs. selling pressure.
Higher values indicate dominant buying volume, while lower values suggest increasing selling pressure.
Useful as a breadth and confirmation tool alongside index price action.

New York Sessions High/Low with Liquidity Purge CriteriaDisplays horizontal lines at the highest high and lowest low of the NY AM (09:30–12:00) and NY PM (13:30–16:00) sessions in New York time.
Lines extend forward until price strongly breaks them by a user-defined threshold (N points), at which point they cease extending - liquidity purged.
Option to show only active lines (unpurged liquidity) - toggle to hide old liquidity pools for a cleaner chart.
Customizable colors, line styles, width, lookback days and purge threshold.

ZTH(P.I) - AlphaShoot (Ultimate+)🔹 ZTH(P) – AlphaShoot (Ultimate+) | Wait for quality, trade with confidence.
ZTH(P) – AlphaShoot (Ultimate+) is a momentum-based trading indicator designed to help traders identify potential BUY and SELL areas with greater clarity and discipline.
Built to reduce subjectivity, overtrading, and emotional decisions, this indicator delivers clean, structured signals without cluttering your chart.
📈 Suitable For
✔ Scalpers, Day Traders, Swing Traders
✔ Forex, Crypto, Stocks, Commodities, Indices
✔ All timeframes & markets on TradingView
🔔 Features
Clear Buy & Sell Area Detection
Momentum Confirmation
Real-Time Alerts (Mobile & Desktop)
Minimalist Chart Design
Beginner-friendly, professional-ready
⚠️ Disclaimer
This indicator is not financial advice and does not guarantee profits.
All trading decisions and risk management remain the user’s responsibility.

TradingSystems_AlphaLib_v6//@version=6
// @description Master Library for Institutional Grade Analysis v1
// @author jmcanovelles
library("TradingSystems_AlphaLib_v6")
// @function Calculates standardized EMA
// @param len Period for the average
export calc_ema(int len) =>
ta.ema(close, len)
// @function Calculates precise ADX and DI
// @param len Calculation period
export calc_adx(int len) =>
= ta.dmi(len, len)
