Weighted ATRWeighted ATR is a volatility indicator that computes True Range and smooths it using a selectable kernel (native Wilder ATR, SMA, EMA, WMA, VWMA, or HMA). It outputs a single volatility line in price units for risk sizing, stop distances, and regime filtering.
Indicadores e estratégias


VC OTC updated📊 Overview
Display candles from any higher timeframe directly on your current chart! OTC-5 shows the current and previous candles from your selected timeframe (like Daily on a 1-hour chart) with customizable styling and positioning.
✨ Key Features
Multi-Timeframe Visualization: View daily (or any timeframe) candles on any lower timeframe chart
Customizable Display: Show 0-10 previous candles alongside the current one
Smart Positioning: Adjust horizontal offset and spacing between candles
Visual Customization:
Custom colors for bullish/bearish candles (body, wick, border)
Optional label showing time remaining in current candle
Choose between default or custom color schemes
Real-time Countdown: Label shows exact time left in the current higher timeframe candle
🎯 Use Cases
Swing Traders: View daily/weekly trends while trading on lower timeframes
Support/Resistance: Identify key levels from higher timeframes
Context Awareness: Maintain bigger picture perspective during intraday trading
Multi-timeframe Analysis: Combine timeframe analysis without switching charts
⚙️ Settings
TimeFrame: Select any higher timeframe (D, W, 4H, etc.)
Number of Previous Candles: 0-10 previous candles to display
Position Controls: Adjust horizontal offset and candle spacing
Color Customization: Separate colors for bullish/bearish candles
Label Options: Show/hide time countdown, customize label colors
📈 Perfect For
Traders who want to see the bigger picture while focusing on entry timing. Whether you're day trading with daily context or swing trading with weekly trends, OTC-5 keeps you aligned with higher timeframe structure.

Gold Smart Scalper V3 - Clean ChartOverview
The Gold Smart Scalper V3 is a trend-following momentum strategy specifically optimized for XAU/USD (Gold). It focuses on catching "value pullbacks" within a strong trend, avoiding the noise of sideways markets. Unlike many scalpers that use lagging indicators for exits, this version uses fixed ATR-based targets to lock in profits during high-volatility moves common in Gold.
Core Methodology
The strategy operates on three layers of confirmation:
Macro Trend (HTF Filter): Uses a 50-period EMA to ensure trades are only taken in the direction of the higher-timeframe momentum.
The Value Zone: Instead of "chasing" green or red candles, the script waits for a pullback to the space between the 9 EMA and 21 EMA. This ensures a better risk-to-reward entry point.
The Trigger: A trade is only executed when price confirms the resumption of the trend by crossing back over the signal EMA after the pullback.
Key Features
Fixed Profit Targets: Replaced dynamic trailing stops with fixed Take Profit (TP) and Stop Loss (SL) levels based on ATR, ensuring exits aren't "hunted" by Gold's signature volatility spikes.
C lean Chart Interface : All moving average plots are hidden. The only visuals provided are the active TP/SL levels when a trade is live, keeping your workspace clutter-free.
Single-Trade Logic: The script includes a "One Trade Per Cross" gate, preventing the strategy from over-trading or "stacking" positions during choppy price action.
Settings & OptimizationATR Multipliers :
Stop Loss (SL): Default $2.0 \times ATR$. Protects against standard market noise.Take Profit (TP): Default $3.0 \times ATR$. Designed for a high Risk/Reward profile.Timeframe Recommendation: Optimized for 15m and 1H for swing scalping, or 5m for aggressive scalping.Instrument: Specifically tuned for Gold (XAU/USD), but applicable to other high-volatility pairs like GBP/JPY or NASDAQ.
Disclaimer
This script is for educational and backtesting purposes only. Past performance does not guarantee future results. Always practice proper risk management.


ODR BoxThis indicator automates the Opening Range Definition (ODR) based on the Ali Khan / ICT Model 1 framework. By capturing the 07:00-09:25 AM Dealing Range, it projects institutional quadrants and standard deviation targets. It is designed to filter out 'retail noise' and highlight the mathematical levels where price delivery is most likely to accelerate or reverse.

ProTradersNetwork - Inefficiency Candle Middle CandleProTradersNetwork
See inefficiency candles with ease.

AsiaSessionHighLowMidLines (v5) - Keep All SessionsProTradersNetwork
See where asia session starts and ends, Highs and Lows

UT Bot + Hull MA Close-Cross Confirm (Strategy)UT Bot + Hull MA Close-Cross Confirm (Strategy)
This strategy combines the classic UT Bot ATR trailing stop with a Hull Moving Average (HMA) close-cross confirmation to reduce false signals and improve trade quality.
The system works in two stages:
UT Bot Signal Detection
A volatility-adjusted ATR trailing stop identifies potential trend shifts using a 1-period EMA crossover. This provides early buy and sell signals based on momentum and volatility.
Hull MA Close-Cross Confirmation
UT Bot signals are only confirmed once price closes across the Hull Moving Average. If a UT signal occurs on the wrong side of the Hull MA, the strategy waits until a valid close-cross occurs before triggering an entry. This confirmation step helps filter chop and late-trend reversals.
Key Features
Non-repainting logic (uses bar-close confirmation)
Futures-friendly design (fixed contracts, point-based TP/SL)
Supports Long, Short, or Both directions
Built-in Take Profit & Stop Loss
Configurable Hull MA type (HMA / EHMA / THMA)
Optional Heikin Ashi signal source
Clean Buy/Sell alerts for automation and webhook execution
Trade Logic Summary
Long Entry:
UT Bot buy signal + confirmed close above Hull MA
Short Entry:
UT Bot sell signal + confirmed close below Hull MA
Exit:
Fixed Take Profit or Stop Loss (user-defined in points)
Alerts & Automation
The strategy includes dedicated Buy Alert and Sell Alert conditions designed for webhook automation (e.g., trade logging, execution engines, or external dashboards). Alerts trigger only on confirmed bar closes, matching backtest behavior.
Intended Use
This strategy is designed for futures markets (e.g., MNQ, ES, GC) and performs best on intraday timeframes. Session filters, risk rules, and trade management can be handled externally if desired.
Disclaimer
This script is provided for educational and research purposes only and is not financial advice. Always test thoroughly and use proper risk management.

Malama's Pre-Market BoxThis script is a comprehensive Pre-Market range visualizer designed to replace older, single-candle analysis tools. It automatically highlights the full pre-market session (04:00–09:30 EST) and extends key support/resistance levels into the regular trading day.
Why this script was created (Evolution from previous versions): This is a complete architectural rewrite of the older "Malama's KAYCAP Pre-Market Box."
Old Logic: The previous version focused on isolating a single, specific 1-minute candle (e.g., exactly 4:00 AM) to determine levels.
New Logic: This version tracks the entire pre-market session range. It dynamically updates the True High and True Low as the pre-market develops, providing a much more accurate support/resistance zone for the open.
Visual Overhaul: Instead of static plots, this version uses Pine Script v6 box and line objects to draw a clean, shading-customizable range that automatically extends rightward until the trading session ends.
How it works:
Session Tracking: The script monitors the user-defined session (default 04:00-09:30).
Dynamic Box: As price moves during pre-market, a box is drawn covering the highest high and lowest low of that period.
Level Extension: At 09:30 (Market Open), the script locks the High and Low values. It then projects two horizontal lines (Resistance and Support) across the chart for the rest of the day.
Breakout Detection: If the price closes outside these levels during regular hours, the script can optionally trigger Alerts and plot "BREAK" labels on the chart.
Settings:
Time Settings: Customizable session string (default captures standard US Pre-Market).
Visuals: Fully adjustable box colors, border transparency, and line width.
Signals: Toggle breakout labels on/off.
Alerts Included:
Bullish Breakout: Triggers when price crosses and closes above the Pre-Market High.
Bearish Breakdown: Triggers when price crosses and closes below the Pre-Market Low.

Previous Days Settlement Price📌 Indicator Description — Previous Days Settlement Prices
Previous Days Settlement Prices is a clean, efficient Pine Script v6 indicator designed for intraday futures and high-precision price reference. It automatically tracks and displays the settlement prices from the previous trading days — anchored to the exact bar where each settlement occurred — and plots each as a horizontal level extending into the current session with customizable visual styles and labels.
⚙️ Core Purpose
Settlement prices represent the officially determined price at which futures contracts settle each trading day — a level often watched by professional traders for support, resistance, acceptance, or rejection behavior. Unlike standard previous-close or high/low indicators, this script uses anchored historical data tracking to accurately record where each settlement happened and visually maintain that reference throughout the subsequent intraday session.
🧠 Original Approach
Rather than relying on request.security lookups alone, this script uses bar-based tracking and array storage to maintain precise settlement values (close price of the last bar of each session). This method ensures:
Accurate anchoring to the actual bar index where the settlement completed, not just price aggregation.
Clean, customizable rendering with dashed/dotted/solid lines and dynamic labels.
Scales elegantly across multiple days without chart clutter.
📊 What It Displays
Up to N previous days’ settlement price levels (configurable, 1–9).
Levels are drawn as horizontal lines from the original settlement bar to the current bar.
Labels with formatted price values display at the rightmost edge of the chart.
Colors, line style (solid/dashed/dotted), line width, and label size are all user-configurable.
🎯 Designed For
Intraday futures traders who rely on settlement levels as reference points.
Traders who want precise anchoring of historical settlement levels for context, not simple static prior-day closes.
Those who prefer a light UI footprint with clear, extendable horizontal levels and reading labels.
📌 Key Indicator Configurations
Number of Days to Show – Choose how many previous settlement levels to display.
Line Style & Width – Customize visual clarity across timeframes.
Label Appearance – Choose color and size for easy identification.
📖 Important Notes for Use
This indicator is optimized for intraday timeframes where settlement references matter most.
Levels are anchored to their actual session close bar, offering a more precise historical reference than simple session closes.
Adjust your chart settings (session times) to match the market you’re trading for best alignment.

Print Bar DataThis script print out the recent bar data. You can configure the position, bar numbers, of the data

RSI Divergence Indicator (Fixed RSI Color + MTF Table)This script combines a classic RSI divergence indicator with a multi–timeframe RSI dashboard.
Main features:
Detects and plots:
Regular bullish & bearish RSI divergence
Hidden bullish & hidden bearish RSI divergence
Dynamic RSI line color:
Green in strong bullish zone
Red in strong bearish zone
Yellow in neutral zone
Standard RSI levels:
70 / 30 overbought–oversold
50 midline with highlighted band
MTF RSI table:
Compact RSI dashboard on the right side of the chart
Timeframes: 1m, 5m, 15m, 30m, 1h, 4h, 8h, 12h, 1D (each can be turned on/off)
Background color highlights extreme RSI:
Red / orange for overbought
Lime for oversold
This tool is designed to help traders quickly see divergence signals on the current chart while also monitoring RSI conditions across multiple timeframes in one place.

ProTradersNetwork-inefficiencyInefficiency Candles Colored, No matter the timeframe, ensures clear visibility of which candles had the most momentum.

BulletProof Long Wick Reversal Markers with LinesThis custom Pine Script indicator for TradingView identifies and marks potential reversal points on your chart based on long wick candles at swing highs (tops) and lows (bottoms). It focuses on candles where the wick is significantly longer than the body (e.g., shooting stars or hammers) and where the subsequent price reversal exceeds a minimum percentage move. Markers appear as colored circles (green for tops, red for bottoms), with horizontal lines extending from each marker to the current bar for easy reference as support/resistance levels.Key Features and InterpretationMarkers (Dots): Green circles at tops: Indicate a potential bearish reversal where price was pushed down after a long upper wick candle.
Red circles at bottoms: Indicate a potential bullish reversal where price was pushed up after a long lower wick candle.
These only appear if the wick-to-body ratio meets the threshold (default 2.0) and the reversal move is at least the minimum percentage (default 1%).
Lines: Horizontal lines extend from each marker to the current bar (updating in real-time). Use these as dynamic levels—e.g., a green top line might act as resistance, while a red bottom line could be support. Lines do not extend into the future blank space on the chart.
Time Filtering: By default, only markers from the last 7 days are shown to reduce clutter. Set to 0 to display all historical ones.
Best Used On: 1-hour charts as per your request, but it works on any timeframe. It's ideal for spotting reversals in trending markets or confirming entries/exits with other indicators.

Participation-Weighted Orderflow Bubbles (HTF / LTF Context ToolThis indicator visualizes participation-weighted market pressure by aggregating lower-timeframe price and volume data into higher-timeframe context bubbles. It is designed to help identify directional dominance, balance, and absorption across timeframes. This is a context and bias tool, not a trade signal generator.
What the indicator shows
Each bubble represents a single chart bar, built from lower-timeframe candles.
Total Notional
Aggregated volume multiplied by price from lower-timeframe candles.
Buy / Sell Proxies
Lower-timeframe candles are classified based on where they close within their range:
– Close near the high → buy-side proxy
– Close near the low → sell-side proxy
– Middle of the range → neutral
Delta (USD and %)
Buy proxy notional minus sell proxy notional, expressed as both absolute USD delta and percentage of total notional.
Bubble colors
Green
Buy-side participation dominance.
Sell color (user configurable)
Sell-side participation dominance. The default is chosen for visibility on bearish candles and can be changed in settings.
Grey
Balanced participation. Indicates two-way trade, consolidation, or auction.
Yellow (Absorption)
High notional with limited price movement, suggesting potential absorption or distribution.
Coloring uses both relative dominance (delta percentage) and absolute dominance (minimum delta in USD), which improves behavior on higher timeframes.
Bubble size and visuals
Bubble size scales with total notional.
HD glow layers adapt automatically by timeframe.
Bubbles are drawn in front of candles for clarity.
Optional text displays delta and total notional.
Hovering over a bubble shows detailed information including total notional, buy/sell/neutral proxies, delta values, absorption status, and the number of lower-timeframe candles used.
Timeframe behavior
The indicator is designed to work across multiple timeframes. On higher timeframes, more grey bubbles are expected due to natural auction and balance behavior. Colored bubbles on higher timeframes represent sustained participation rather than short-term momentum. Visual density and performance are automatically adjusted on higher timeframes.
How to use it
Recommended workflow:
1. Higher timeframe (1H, 4H, Daily)
Use the bubbles to identify dominant buy or sell participation, balance zones, and absorption near highs or lows.
2. Lower timeframe (5m, 15m)
Take trades in alignment with the most recent higher-timeframe dominance. Be cautious or range-focused inside higher-timeframe balance zones. Use structure and price action for entries.
What this indicator is not
This indicator does not show true bid/ask data.
It does not display actual market versus limit orders.
It does not replace a DOM or exchange orderflow feed.
It should not be used as a standalone entry signal.
The indicator works within TradingView’s available data and provides a probabilistic, participation-weighted view of market pressure rather than true tape or orderflow data.
Best practices
Use a 1-minute lower timeframe for best results.
Avoid setting the lower timeframe too high relative to the chart timeframe.
Combine this tool with structure, levels, and session context.
Treat grey bubbles as information about balance, not as noise.
This tool is intended for traders who want better context and bias, not more signals.

MAX TRADEMAX TRADE is a professional BUY/SELL signal indicator built for scalping and intraday trading. It generates clear entries and displays pre-defined risk zones directly on the chart to help traders manage positions faster and more confidently.

GuidedByGod-Vertical Timestamp-GOD MODEmaximum 15 custom vertical lines for time based study-timing might be off by Hour or so , will fix in future iteration , for now does the job

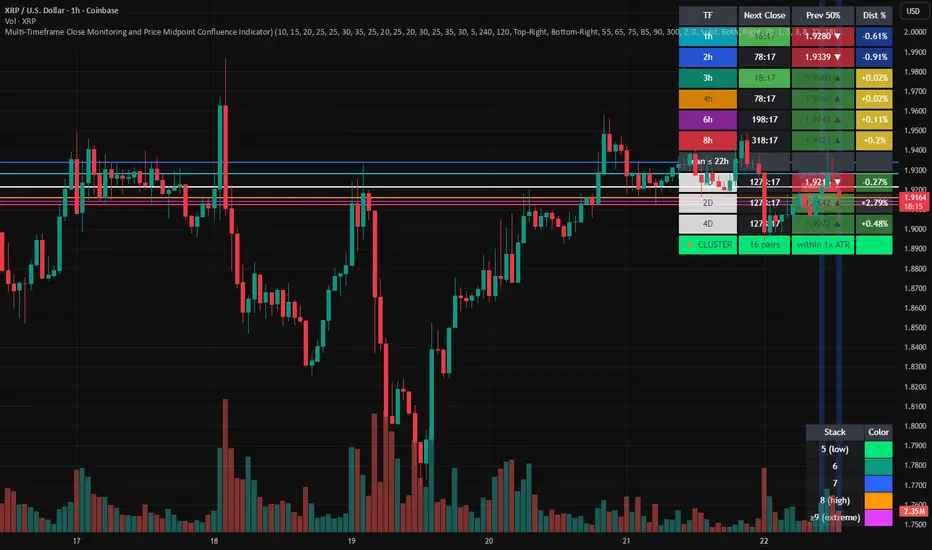
Multi-Timeframe Close and Midpoint ConfluenceMulti-Timeframe Close Monitoring and Price Midpoint Confluence Indicator
This indicator is designed to assist traders in monitoring multiple timeframe candle closes and identifying areas where price midpoints (50% levels) from different timeframes cluster together.
The tool focuses on timing awareness and structural context, helping users observe periods where multiple timeframe events occur close together, which may coincide with increased market activity.
What the Indicator Tracks
The indicator monitors candle close timing and price context across multiple timeframes, including:
Intraday timeframe closes (30m, 1h, 2h, 3h, 4h, 6h, 8h)
Higher-timeframe closes (Daily, Weekly, Monthly) when within a defined scan window
The midpoint (50%) of the previous candle for each tracked timeframe
The distance between current price and each midpoint level
This information is evaluated independently for each timeframe.
Timeframe Close Confluence
When multiple timeframes are approaching a candle close within a short window, the indicator highlights this period visually.
These moments can be useful for observing potential shifts in activity or volatility, particularly when combined with other forms of analysis.
Visual markers and optional alerts are used to draw attention to these timing clusters.
Midpoint (50%) Level Clustering
The indicator also evaluates whether multiple 50% levels from different timeframes are located within a user-defined proximity.
When several midpoints cluster closely together, the area is highlighted as a zone of interest for further observation, as overlapping price references may act as areas of interaction.
Countdown & Information Panel
An optional on-chart panel displays:
A live countdown to upcoming timeframe closes
Relative urgency based on proximity to each close
Whether current price is above or below each midpoint
Distance metrics to help gauge proximity
Color coding is used to improve readability rather than indicate trade direction.
Visual Context Tools
Additional visual options include:
Background shading when multiple timing or midpoint conditions overlap
Adjustable thresholds to control sensitivity
Customizable colors, opacity, and panel placement
These visuals are intended to provide contextual awareness, not trade signals.
Intended Use
Style: Multi-timeframe analysis and timing awareness
Markets: Forex, crypto, equities, futures
Purpose:
Monitor upcoming timeframe closes
Observe overlapping price reference zones
Improve preparation around potential activity windows
The indicator is best used as a supplementary tool alongside independent analysis.
Important Notes
This script is provided for educational and analytical purposes only.
It does not predict market outcomes and should not be used as a standalone decision-making tool. Users are encouraged to apply appropriate risk controls and confirm observations with additional analysis.
Bollinger Reversal + Swing ExitBollinger Reversal + Swing Exit is a mean-reversion strategy designed to capture short-term reversals when price stretches to an extreme and then shows the first signs of rejection.
1. Core idea
This strategy assumes that sharp deviations from a central equilibrium are often followed by a corrective move back toward normal pricing. It does not chase trends. Instead, it waits for price to reach an extreme area and then looks for a controlled turn back in the opposite direction.
2. Signal concept
A setup starts only after price reaches an outer extreme zone. The trade is taken only if the market immediately shows a reversal-type reaction rather than continuing to push outward. This reduces entries that happen too early while the move is still accelerating.
3. Long and short behavior
Long trades are allowed only after a downside extreme has been reached and price begins to recover.
Short trades are allowed only after an upside extreme has been reached and price begins to fade.
The goal is to enter close enough to the extreme to keep risk contained, while still requiring evidence that the turn has started.
4. Risk control
Risk is defined tightly. The protective stop is placed where the reversal thesis is clearly invalidated, so the strategy is built to accept small losses when the market does not revert and continues expanding in the same direction.
5. Exit logic
Profits are taken based on local market structure rather than fixed targets. Once in a position, the strategy looks for a clear exhaustion point in the move and closes the trade when the short-term swing structure signals that the rebound or pullback has likely completed. This aims to capture the core of the corrective move without overstaying.
6. Best conditions
This approach performs best in range-bound markets, during consolidations, and in instruments that frequently oscillate around a fair value. It is also useful after impulsive spikes when the move becomes overstretched and liquidity rebalances.
7. When to avoid
Avoid using it during strong, clean trends and during persistent breakout phases, where extremes can keep extending and reversals can fail repeatedly. In these conditions, mean-reversion setups can be systematically punished.
8. What to expect
Expect a higher trade frequency than trend-following systems, with many small-to-medium wins and occasional sharp losses when the market refuses to revert. The edge comes from disciplined entries only after extremes and quick exits when structure signals completion.

BHUVANA Fib 50/61.8 Stairs with RR Targets Fib 50–61.8 Stairs with RR Targets (debug) automatically tracks the latest swing and draws a 50%–61.8% Fibonacci pullback zone as step-like “stairs.” From that zone it plots a planned trade framework: entry reference, stop/invalidation, and multiple Risk:Reward targets (e.g., 1R/1.5R/2R/3R).
What it’s for
Visualize the “buy/sell pullback” area (50–61.8) in trending moves
Standardize exits with RR targets instead of guessing
Quickly see when the swing/zone updates as structure changes
How to use (simple)
Wait for a clear impulse swing to form.
Let price retrace into the 50–61.8 zone.
Take entries only with your own trigger (reclaim / rejection / BOS).
Use the plotted stop and RR targets for management.
Inputs
Swing detection / lookback
RR multiples and target count
Show/hide stairs, labels, debug visuals
Important
This is a mapping tool, not a standalone signal. If you trade every touch of 50–61.8 without confirmation, you’ll get chopped. Debug version may show extra visuals and can repaint on swing updates. Not financial advice.

Weekly Bullish Engulfing ScreenerThis is a weekly Bullish engulfing screener to find the stocks ready to breakout
