Simulated Liquidation Heatmap [QuantAlgo]🟢 Overview
This indicator visualizes where clusters of stop-loss orders and liquidation levels are likely located, displayed as a 'heatmap'. It's based on the concept of market structure liquidity: large groups of stop orders tend to gather around obvious technical levels (like swing highs and lows), and these pools of orders often attract price movement from institutional traders. The indicator uses a fractal-based algorithm to identify these high-probability liquidation zones and displays them as dynamic, color-coded boxes.
The key feature is the thermal color gradient, which indicates the freshness (age) and therefore the relative relevance of the liquidity zone. Hot colors (e.g., Red/Yellow) represent fresh clusters that have just formed, suggesting strong and immediate liquidity interest. Cold colors (e.g., Blue/Purple) represent aged or decaying clusters that are becoming less relevant over time. This visualization allows traders to anticipate potential liquidity sweeps (stop hunts) and understand areas of significant retail and institutional positioning.
🟢 Key Features
1. Liquidity Zone Heatmap
The core function is the identification of swing high and swing low price points using a user-defined Lookback period. These points are where retail traders are statistically most likely to place their stop-loss orders. The indicator simulates the clustering of these orders by drawing a zone (box) around the detected swing point, with the vertical size controlled by the Stop/Liquidation Zone Width (%) setting.
▶ Cluster Lookback: Defines the sensitivity of swing point detection. Lower values detect frequent, minor zones (scalping/intraday); higher values detect major, stronger swing points (swing trading).
▶ Zone Width (%): Sets the percentage range above and below the swing point where stops are simulated to cluster, accounting for slippage and typical stop placement spread.
▶ Liquidity Decay: Zones gradually fade in color intensity and are eventually removed after the user-defined Liquidity Decay Period (Bars), ensuring the heatmap only displays relevant, current liquidity areas.
▶ Round Number Filter: An optional filter that limits the display to liquidity zones occurring only at psychologically significant round numbers (e.g., $100, $1,500.00), which typically attract higher concentrations of orders.
2. Thermal Color Gradient
The heatmap's color is a direct function of the zone's age, providing a visual proxy for immediate relevance.
▶ Freshness: Newly created zones are displayed in the Hot Color (high relevance).
▶ Decay: As bars pass, the zone color transitions along the gradient toward the Cold Color and increased transparency (lower relevance), until it is removed entirely.
▶ Color Schemes: Multiple pre-configured and custom color schemes are available to optimize the visualization for different chart themes and color preferences.
3. Liquidity Heat Thermometer
An optional visual thermometer is displayed on the chart to provide an instant, overall assessment of the current liquidation heat level in the immediate vicinity of the price.
▶ Calculation: The thermometer calculates an aggregate heat score based on the age and proximity of all liquidity zones within a user-defined Zone Detection Range (%) of the current price.
▶ Visual Feedback: A marker (triangle) points to the corresponding level on the thermometer's color gradient (Hot to Cold). A high reading indicates price is close to fresh, dense stop clusters, suggesting high volatility or an imminent liquidity sweep is probable. A low reading indicates price is in a low-density or aged liquidity area.
▶ Customization: The thermometer's resolution, position, and text size are fully customizable for optimal chart placement and readability.
🟢 Practical Applications
▶ Anticipate Sweeps: Prioritize trading in the direction of Hot (fresh) liquidity zones. For example, a hot low-side zone suggests strong sell-side liquidity (stop-losses) is available for large buyers to sweep.
▶ Filter Noise: Use the Round Number Filter to focus only on the highest probability liquidation zones, which are often at clean, psychological price levels.
▶ Validate Entries: Combine the Heat Thermometer with price action analysis. A rising heat level indicates increasing proximity to a major stop cluster, signaling a potential turn or an aggressive market move to sweep those stops.
▶ Risk Management: Understand that price often acts dynamically around these zones. High heat levels imply high risk/reward setups; stops should be placed strategically beyond the defined Liquidation Zone Width.
▶ Multi-Timeframe Context: Higher timeframes (e.g., Daily, 4-Hour) often reveal more significant, major liquidity zones. Use this indicator on lower timeframes (e.g., 5-min, 15-min) for execution, but prioritize zones that align with higher-timeframe structures.
Indicadores e estratégias

TF7 Weekly Synthetic FutureThis indicator plots a Synthetic Future Chart by combining the ATM (At-The-Money) Call and Put option prices for NIFTY or SENSEX indices.
It reconstructs the theoretical future price using the formula:
Synthetic Future = ATM Strike + ATM Call Price - ATM Put Price
The indicator allows users to:
View the synthetic future as a line chart or a candlestick chart
Visualise the underlying Call (CE) and Put (PE) prices separately
Choose between NIFTY and SENSEX indices
Select expiry and ATM strike manually for precision
This chart can be helpful for:
Traders comparing synthetic and actual futures prices
Option traders identifying potential mispricing or arbitrage opportunities
Intraday and positional traders who want a refined price reference
📘 How to Use
Add the Indicator
Apply the script on any chart (preferably NIFTY or SENSEX) from the TradingView indicator list.
Configure the Index
In the Trade Set Up section, choose "NIFTY" or "SENSEX" as the underlying index.
Set Expiry & ATM Strike
Input the Expiry Date in YYMMDD format (e.g., 251204 for Dec 4, 2025).
Input the Straddle Strike (ATM strike you want to analyze).
The script auto-generates 18 strikes around this base and selects the closest to LTP.
Toggle Display Options
Show ATM CE/PE: Plots the last traded prices of ATM Call & Put.
Show Synthetic Future: Plots the synthetic price.
Show Candlestick Chart Instead of Line: Plots OHLC of the synthetic future instead of just close price.
Visual Tips
Candlestick bars alternate between semi-transparent green and red for better visibility.
Use shorter timeframes (e.g., 5m, 15m) for intraday strategy testing.
✅ Tips for Best Results
Ensure you're using live market hours for accurate option price data.
Match the expiry and strike exactly with available option symbols on TradingView (format: NSE:NIFTY251204CXXXXX).
Compare synthetic futures with actual FUTURE contracts (e.g., NSE:NIFTY1!) for divergence or convergence signals.
Can be used for calendar spreads, option arbitrage, and volatility-based strategies.
⚠️ Limitations
Options data may not load correctly for illiquid strikes or expired contracts.
The indicator doesn’t account for transaction costs, slippage, or dividend impact.
Requires real-time data for optimal usage; delayed data might affect accuracy.

X AVWAP DSOA powerful, non-overlay momentum indicator designed to measure the relationship between current price action and key Volume Weighted Average Price (VWAP) structures. It provides traders with a refined, configurable view of momentum by combining the **magnitude of price separation** with the **trend momentum** of the volume anchor.
---
### Core Calculation and Principle
This oscillator moves beyond simple price-vs-average separation by integrating the momentum (slope) of the volume average itself. The indicator is built around two primary components:
1. **Distance (D):** This is the magnitude of separation, calculated as the difference between the **closing price** and the selected **AVWAP Anchor Source** ($D = \text{Close} - \text{AVWAP}$).
2. **Slope (S):** This represents the **trend momentum** of the VWAP, calculated as the change in the smoothed AVWAP over a defined lookback period.
The final oscillator value is determined by the selected **Combination Method**, giving the user control over how these two factors interact:
* **Addition (Baseline):** The oscillator value is $D + S$. This provides a balanced view where the price separation is slightly adjusted by the VWAP's momentum.
* **Weighted Addition:** The oscillator value is $D + (S \times \text{Weight})$. This is a powerful feature that **allows the user to prioritize the impact of the Slope (trend momentum) over the Distance (magnitude)** using a customizable multiplier called the **Slope Weight**.
---
### Customization and Flexibility
The indicator's value lies in its deep configurability, allowing it to adapt to different trading strategies and timeframes:
* **AVWAP Anchor Source:** You can toggle between two critical VWAP reset structures for context:
* **4H Session VWAP:** Uses fixed, sequential 4-hour VWAP segments (e.g., 18:00, 22:00 NY Time) for tracking short-term structural shifts.
* **Daily AVWAP (ETH 18:00):** Uses a single, continuous VWAP anchored from the Electronic Trading Hours (ETH) open at 18:00 NY Time, providing a broader, sustained volume-weighted average context.
* **VWAP Price Source:** The underlying price used to calculate the VWAP itself is selectable (options include Close, OHLC4, HLC3, Open, High, and Low).
* **Plot Style:** Toggle between a continuous **Line** plot (for tracking fine movements) and a color-coded **Histogram** (for clear magnitude and directional reading, with Blue for positive and Red for negative).
### Trading Application
The AVWAP Distance & Slope Oscillator is a sophisticated tool best used to identify:
* **Zero-Line Crosses:** Signifying price crossing the underlying volume anchor while accounting for the anchor's own momentum.
* **Momentum Confirmation:** A high positive reading indicates price is strongly above the VWAP, and the VWAP itself is actively rising (strong bullish momentum).
* **Filtered Signals:** By adjusting the **Slope Weight** (in the Weighted Addition method), traders can amplify signals when the structural trend (VWAP slope) is strong, helping to filter out minor price fluctuations that occur when the VWAP is relatively flat.

VOID/DOM Tier4 Options CoreExecution Windows
Professional Description (Publish-Ready)
VOID/DOM Tier4 Options Core is an institutional-grade microstructure engine designed to map premium flow, volatility skew, contract drift, and IV-pressure zones during the highest-value trading windows of the day.
This module is optimized for OPTIONS decision-making, not price-only signals. It extracts Tier-4 DOM + Options Chain influence and converts it into clean flow-intent guidance, ideal for directional confirmation, momentum continuation, or early-warning reversal detection.
Core Capabilities
• Tier-4 Options DOM Mapping
Captures hidden liquidity pockets, premium migrations, and microstructure imbalances that standard technical indicators can’t see.
• Flow Premium Pressure (0630–1300 Core Session)
Tracks how premium shifts through the morning auction → trend establishment → mid-day compression.
Helps determine when momentum is real vs fading.
• Volatility & Contract Drift Sync (1200–1300 Reset Window)
Reads IV cooling, gamma realignment, and exhaustion signatures leading into mid-day resets.
• Reversal + Continuation Bias Engine
Filters noise and reveals true intent—ideal for options traders needing direction + timing.
• Multi-Asset Compatibility
Futures, indices, SPX/SPY derivatives, and high-beta assets.
What This Module Is For
✔ Confirming options entries with real flow
✔ Avoiding false moves during chop
✔ Reading premium pressure during the most lucrative sessions
✔ Identifying when liquidity is forcing price vs when price is bluffing
✔ Syncing with the rest of your VOID/DOM Tier4 ecosystem (Chain Scanner, Purge Loop, Apex Fusion, etc.)
Recommended Use
Runs best as a confirmation and environment-grading module, not a standalone signal generator.
Pairs extremely well with Apex Fusion, RAI, SS++ God filters, and all Tier4 chain-based indicators.
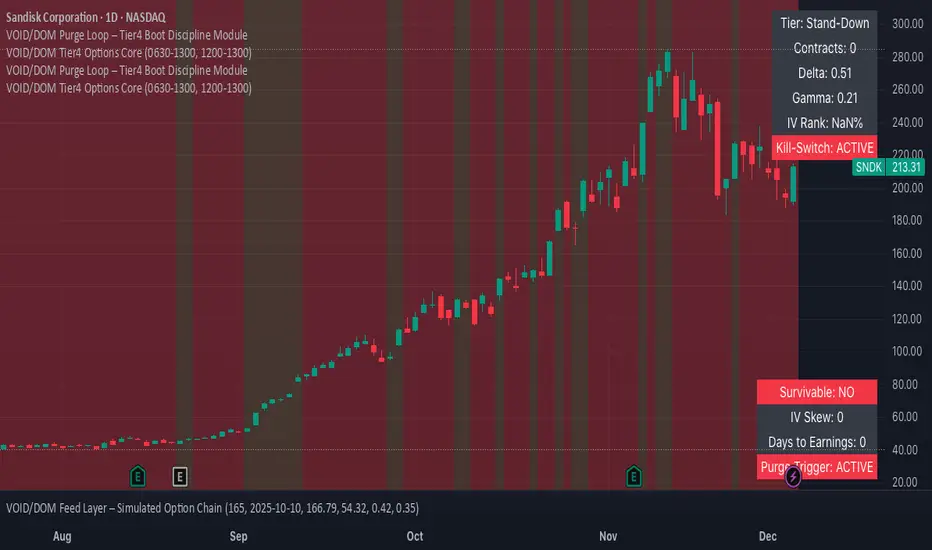
VOID/DOM Purge Loop – Tier4 Boot Discipline ModuleProfessional Description (Publish-Ready)
VOID/DOM Purge Loop is your chart’s boot-time integrity system.
This module analyzes volume spikes, thread anomalies, opening-bar distortions, and early-session instability to determine whether the environment is safe, trending, or unstable before trades begin.
It is designed to prevent traders from entering positions during periods where liquidity is disorderly, flow is erratic, or the market has not “initialized” correctly.
Core Capabilities
• Boot-Time Thread Spike Detection
At bar 0, and during the opening sequence, the indicator checks for abnormal microstructure spikes that typically lead to:
– fake breakouts
– liquidation wicks
– low-probability entries
– algo shakeouts
• Purge Trigger Logic
If volume acceleration or thread spikes exceed acceptable thresholds, the module triggers a Purge State, signaling that the environment requires stabilization before clean directional signals can be trusted.
• Survivability Sync (Tier4)
Pulls in survivability metrics from the Tier4 Chain Scanner:
– Break-Even Alignment
– Chance-of-Profit drift
– IV skew conditioning
– Earnings proximity pressure
These metrics combine to form an early-session trade discipline filter.
• Noise Rejection + Liquidity Calibration
Removes low-quality noise from the opening bars, forcing the trader to operate only inside high-integrity flow periods.
What This Module Prevents
✔ Early morning FOMO entries
✔ Getting trapped in opening fake-outs
✔ Trading when liquidity is distorted
✔ Entering before volatility has normalized
✔ Taking low-survivability trades before the model stabilizes
Recommended Use
Use Purge Loop as the first line of defense in any Tier4 system.
It is built specifically to sync with:
– VOID/DOM Options Core
– Tier4 Chain Scanner
– Apex Fusion / VDA Universe Fusion
– SS++ God Scalper modes
– Any risk-discipline frameworks (TraderPost Automations, kill-switches, etc.)
It does not create trade signals.
It grades, filters, and protects your strategy before trades begin.
✅ Want Me to Also Write:
✔ Short “public-safe” version
✔ Invite-only description
✔ Your private version for customers
✔ A combined description for both modules
✔ A one-line tagline for the indicator list


Pivot automatic by GaryIn recent years, I have been exposed to concepts such as order block and fair value gap, which have gained significant popularity. However, I believe that traditional support and resistance levels based on swing highs and lows still hold certain practical value. In particular, support and resistance on higher timeframes play a crucial role in our technical analysis. The traditional principle of support-resistance flip remains valid, and higher timeframe support/resistance levels provide a more systematic framework for analysis. In contrast, the definitions of order block and fair value gap are overly vague; they are often decoupled from market trends, generate numerous false signals, and are thus difficult to apply effectively in practice.
## Pivot Automatic V4 Indicator
An intelligent support and resistance zone identification tool with the following core features:
**🎯 Auto Timeframe Detection**
- Automatically selects appropriate higher timeframes based on current chart period
- No manual adjustment needed, adapts to different trading styles
**📊 Key Features**
- **Support/Resistance Zones**: Auto-identifies and draws HTF pivot high/low zones
- **Touch Alerts**: Real-time alerts for first touch, re-touch, and breakout of zones
- **High Volume Detection**: Marks price areas with exceptional volume
- **Session Filtering**: Configurable trading session analysis
**💡 Practical Features**
- Customizable zone colors and transparency
- Multiple alert types (touch/breakout/retest)
- Detailed price information tooltips
- Auto-extends active zones, cleans broken zones
Perfect for traders to identify key price levels and improve entry/exit timing accuracy across all timeframes.


ICT Complete SuiteICT Complete Suite - Advanced SMC & Liquidity Analysis
A comprehensive indicator combining ICT (Inner Circle Trader) methodology with Smart Money Concepts for professional trading analysis.
🔹 KEY FEATURES:
- Market Structure Detection (MSS, CISD, BOS, CHoCH)
- Smart Money Liquidity Analysis (BSL/SSL Sweeps)
- Premium Discount Arrays (Order Blocks, FVG, Breaker Blocks)
- OTE Zones (0.62-0.79 Fibonacci)
- Session & Killzone Tracking (Asian, London, NY)
- Silver Bullet Time Windows
- Real-time Info Dashboard
- Multi-timeframe Support
🔹 MODULES:
1. Market Structure & Trend Analysis
2. Liquidity Hunter (BSL/SSL Detection)
3. PD Arrays (OB, FVG, Breaker Blocks)
4. Sessions & Killzones
Perfect for traders who follow ICT concepts and Smart Money trading strategies.
⚠️ Best on M15-H1 timeframes
⚠️ Compatible with XAUUSD, EURUSD, GBPUSD, and major pairs

Angular Resistance & Breakout/BreakdownAngular Resistance & Breakout/Breakdown (Dynamic Trendlines)
This indicator provides a dynamic approach to identifying major support and resistance levels by fitting Linear Regression lines to recent pivot points (swing highs and swing lows). Unlike static horizontal lines, these "Angular" trendlines adapt to the market's slope, providing continuously adjusting targets for resistance and support, along with signals for confirmed breakouts and breakdowns.
💡 Key Features
Dynamic Trendlines: Utilizes Linear Regression to automatically draw sloped trendlines based on a configurable number of the most recent swing pivots.
Confirmed Signals: Generates clear Breakout (▲) and Breakdown (▼) signals with optional buffer and sensitivity filters to reduce noise.
Customizable Inputs: Fine-tune the pivot detection period, the number of points used for regression, line extension, and signal sensitivity.
On-Chart Info Panel: A table displays real-time data, including the number of detected pivot points and the current calculated price level of the dynamic lines.
⚙️ How It Works (The Logic)
Pivot Detection: The script uses the standard ta.pivothigh() and ta.pivotlow() functions to reliably identify swing points, based on the Pivot Left and Pivot Right settings. These points are stored in dynamic arrays (highs for resistance, lows for support).
Angular Line Generation: A custom function, f_regression_from_array, performs a Linear Regression analysis using the bar index (X-axis) and the pivot price (Y-axis) for the Points to use. This calculation determines the optimal slope and intercept to draw a best-fit dynamic line through the identified pivot points.
Breakout/Breakdown Confirmation:
Breakout: Triggered when the current close price crosses above the dynamic resistance line plus the user-defined Breakout buffer.
Breakdown: Triggered when the current close price crosses below the dynamic support line minus the user-defined Breakout buffer.
Sensitivity Filter: An optional filter requires the price movement on the signal bar to exceed a minimum percentage (Label sensitivity) away from the line to confirm the momentum of the move.

MNQ Momentum Suite – Intraday Confluence Dashboard (1-5M)MNQ Momentum Suite is a multi-factor intraday momentum dashboard designed primarily for MNQ / NQ on the 1M–5M timeframes during the New York session.
Instead of staring at 3–4 separate indicators, this script combines them into one clean pane
DMI / ADX → who’s in control (+DI vs –DI) and how strong the move is
Momentum MA Slope (T3 or EMA) → directional bias and trend quality
Squeeze Logic (BB vs Keltner) → volatility compression & expansion zones
Composite Momentum Score (–4 to +4) → single number capturing total confluence
Color-coded Dashboard Table → instant Bull / Bear / Flat status for each component
Core Components
1️⃣ Composite Momentum (Main Histogram)
Score range : –4 to +4
Built from 4 building blocks :
DMI direction (Bull/Bear)
ADX strength above threshold
MA slope direction (up/down)
Squeeze direction (after it fires)
Interpretation:
+3 / +4 → strong bullish confluence
+1 / +2 → mild bullish bias
0 → mixed / no edge
–1 / –2 → mild bearish bias
–3 / –4 → strong bearish confluence
2️⃣ DMI / ADX Block
Uses ta.dmi() under the hood.
DI spread histogram (teal/orange) shows which side is in control.
White ADX line measures trend strength – higher = cleaner moves, low = chop.
3️⃣ Momentum MA Slope (T3 / EMA)
User can choose T3 or EMA for the slope engine.
Slope histogram color:
Aqua → MA sloping up (bull-friendly)
Fuchsia → MA sloping down (bear-friendly)
4️⃣ Squeeze (BB vs Keltner)
Yellow dots mark when Bollinger Bands are inside Keltner Channels (volatility squeeze).
When the squeeze releases and price closes on one side of both BB basis and Keltner basis, the script flags a bullish or bearish squeeze fire that feeds the composite score.
Dashboard Table (Top-Right) : The table gives a fast, text-based read of the environment:
DMI Dir – Bull / Bear / Flat
ADX – Numeric trend strength
Slope – Up / Down / Flat based on chosen MA
Squeeze – Building / Fired Up / Fired Down / Idle
Row text is color-coded:
Green when that metric is bull-friendly
Red when it is bear-friendly
Gray/white when neutral
This makes it very easy to glance at the table and see if the environment is mostly green (long-friendly) or mostly red (short-friendly).
Session & Histogram Controls
Use NY Session Filter?
When enabled, all logic is focused on the defined NY session (default 09:30–16:00 exchange time).
how Histograms Only in NY Session?
true → plots only during the NY session (good for live trading focus).
false → plots on all bars, including overnight, so you can study past days and pre-/post-market behavior.
Alerts
Two built-in alert conditions are provided:
Strong Bull Momentum – Composite ≥ 3 during the session.
Strong Bear Momentum – Composite ≤ –3 during the session.
Use these as “heads-up” momentum pings, then confirm with your own price-action, VWAP, HTF levels, and liquidity zones.
Recommended Use
Primary instruments: MNQ / NQ futures, but it can be applied to any intraday symbol.
Primary timeframes: 1M to 5M.
Designed as a confluence and filter tool, not a stand-alone entry system.
Works especially well combined with:
VWAP
10 EMA
Pre-NY and RTH highs/lows
FVG/IFVG and liquidity zones
As with any tool, this is not financial advice and does not guarantee results. Always combine with risk management and your own playbook.

Ichimoku Traffic Lights Go--no go flags for Ichimoku Cloud. For quick scanning thru your watchlist, and good for scanning through timeframes.

CANDLE_TIME_RDThis tool displays the time of each candle directly on the chart by placing a label below
the bar with an upward-pointing arrow for clear visual alignment. It helps traders quickly
identify the exact timestamp of any candle during fast intraday analysis or historical review.
OVERVIEW
The script extracts the hour and minute of each bar, formats the timestamp according to the
user’s preference, and prints it beneath the candle. This removes the need to rely on the
data window or crosshair for time inspection. It is ideal for ITI evaluation, timestamp
journaling, and precise replay study.
FEATURES
- Prints the time under each candle or every N-th candle using a simple step input.
- Supports both AM/PM and military time through a toggle input.
- Builds all hour and minute text manually to ensure consistent formatting.
- Uses label.style_label_up to draw an arrow pointing toward the candle.
- Positions labels with yloc.belowbar so they do not overlap price bars.
USE CASES
- Reviewing setups with ChatGPT where exact candle timing matters.
- Studying EMA touches, VWAP interactions, or momentum shifts that occur at specific times.
- Journaling entries and exits with precise timestamps.
- Quickly identifying candle times without zooming or opening data windows.
This script is designed for clarity and convenience, improving workflow for structured
intraday traders and replay analysts.

True Trend (StevenCharts)Overview
True Trend (StevenCharts) is a next-generation technical analysis tool designed to automate the most subjective part of trading: Drawing Trendlines.
Whether you are scalping, day trading, or swing trading, identifying valid support and resistance channels is critical. This indicator uses a proprietary multi-timeframe momentum engine to objectively identify market pivots and automatically draw precise, high-probability trendlines (rays) on your chart.
The "True Trend" Engine
At the heart of this indicator is a custom algorithmic model that evaluates market structure across multiple timeframes simultaneously.
No Guesswork: Instead of manually connecting wicks, the script waits for specific algorithmic momentum peaks and troughs to determine exactly where a trend begins and ends.
Dynamic Generation: When the internal trend logic detects maximum strength, the indicator tracks the highest or lowest points of the move. When momentum shifts, it locks in a trendline that projects forward, creating dynamic support and resistance levels.
Key Features
Automated Ray Creation: Automatically draws Red (Bearish) and Green (Bullish) rays based on confirmed momentum shifts.
Clean Chart Logic: The script includes intelligent "cleanup" logic. If price breaks a trendline and confirms the break with sustained momentum, the line is automatically removed to keep your chart clean and focused on relevant data only.
High Volume Confirmation: The logic accounts for volume spikes to validate line breaks.
"SHIFT" Logic (Adaptive vs. Static)
This script features a powerful setting called "Turn SHIFT On":
ON (Adaptive Mode): Uses advanced logic to "leapfrog" trendlines. As price makes new structural highs or lows, the trendline adjusts and locks onto the most recent valid pivot points. This is ideal for active traders following a developing trend.
OFF (Static Mode): Draws independent, static trendlines from every valid pivot. This is useful for seeing the history of market structure and identifying older levels that may still act as support/resistance.
How to Use
Support & Resistance: Use the automatically generated rays as dynamic S/R levels.
Bullish Trend: Price should respect the Green rays as support.
Bearish Trend: Price should respect the Red rays as resistance.
Breakout/Reversal: When a localized trendline is deleted or broken, it signals a potential shift in market structure.
Settings
Turn 'SHIFT' On: Toggles between adaptive (moving) lines and static lines.
Show Highest/Lowest Only: Keeps the chart clean by focusing on the most dominant outer trends.
Ray Colors: Customizable colors for Up and Down trends.

市场微观转变确认指标Logic: Signals only appear when Cloud Trend aligns with Structural Breakouts.
Visuals: Grey bars indicate noise/chop; colored bars indicate valid resonance.
Best for: 15m timeframe fast-paced trading.
"High-speed scalping indicator fusing Volatility Clouds and Market Structure for noise-filtered, double-confirmed entries."

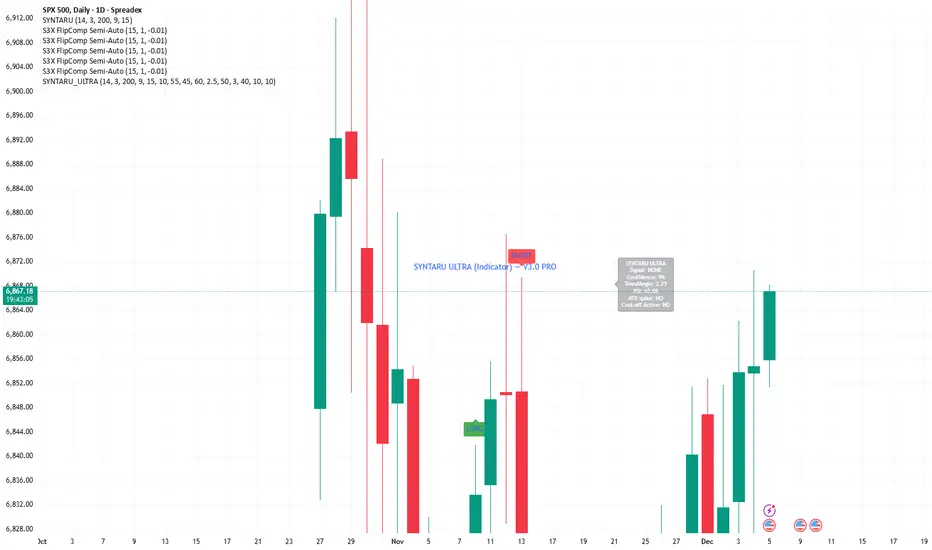
SYNTARU ULTRA (Indicator) — Non-Repaint PROSYNTARU ULTRA (Non-Repaint PRO)
A professional-grade, non-repainting trading indicator designed to identify high-probability entries using multi-layer analysis. Combines core trend EMA (G1), ATR-based volatility bands (G2), momentum (RSI + EMA slope, G3), and optional higher timeframe confirmation (G4) to generate LONG and SHORT signals. Features include ATR spike filters for news/noise avoidance, cool-off bars to reduce false alerts, confidence scoring (0–100%), and full webhook-ready alerts for automation. On-chart panel displays signal, confidence, trend angle, RSI, ATR spike status, and cool-off activity for real-time monitoring.