浅笑纪念版trend = ta.ema(ta.ema(close, 8), 62) // EMA(EMA(close, 8), 62)
plot(trend, color=color.new(#AB47BC, 0), linewidth=5, title="趋势线")
Indicadores e estratégias

indicator from Amory VIP WIN RATE 99% Only Free 7 DaysAMORY PRO 2025 – WINRATE 99%+ (Original version)
COMPLETELY FREE OPEN VERSION FOR THE FIRST 7 DAYS!
More than 15,000+ Vietnamese & international traders have used it.
AWESOME VIP FEATURES:
• Extremely strong BUY/SELL signals (RSI divergence + breakout trend + volume spike)
• Super beautiful realtime dashboard: Trend – RSI – ADX – ATR – Volume Change – SIGNAL
• Automatically filter noise, block reverse trends, order indicators when the probability of winning is extremely high
• Support Bollinger Bands + ADX filter + EMA trend
• No repaint – No lag – Run smoothly on all time frames 1p → 1D
THIS VERSION IS CURRENTLY 100% FREE FOR THE FIRST 7 DAYS!
After 7 days → the script will automatically lock (only invited people can continue to use it).
If you want to continue using it for a long time (not locked):
Inbox now at: t.me
There will be gifts + special offers for those who inbox during these 7 free days!
AMORY PRO 2025 – THE BEST MONEY MAKING INDICATOR!
© 2025 Amory – All Rights Reserved

Buforn Combo Pro — Swing & Long-Term FlowsBuforn Combo Pro — Swing & Long-Term Flows
Buforn Combo Pro combines short-term swing timing with long-term valuation & flow context in one indicator.
It does not auto-trade or promise profits – it’s a visual decision tool.
⸻
1. Module A – Swing regression channel + Emotional cycle
• Draws a short-term regression channel (price vs linreg ±σ).
• Tracks an internal fear/greed cycle (HumanCycle) with a dynamic midline.
Signals:
• A BUY – price touches the lower band, volatility & trend filters are OK,
and the emotional cycle crosses up from Fear.
• A SELL – price touches the upper band, filters OK,
and the emotional cycle crosses down from Greed.
A cooldown in bars reduces signal noise.
⸻
2. Module C – “Band + Fear” deep pullbacks
Uses the previous candle:
• Previous candle is below the lower band (full body or at least the low, configurable).
• Emotional cycle was below the Fear line on that bar.
Signals:
• C BUY – current bar marks that extreme Band + Fear setup.
• C SELL – exit when price closes above the trend MA and/or above the Greed line.
Useful for aggressive re-entries after deep fear.
⸻
3. Module B – Long-term valuation, whales & TIF (with SECRET)
Module B gives the bigger picture:
• Valuation vs long-term MA → “cheap” or “expensive” vs trend.
• Whale Money Flow → activity of big players.
• TIF (Trades in Favor) → behaviour of retail (fear / FOMO).
Base signals:
• B BUY – undervaluation + low whales + “green” TIF zone.
• B SELL – overvaluation + high whales + “red” TIF zone.
SECRET signals (optional):
• Vote system using extremes in valuation, WhaleMF, TIF and whales vs retail divergence.
• You choose the minimum votes for BUY SECRET / SELL SECRET.
• Option to show BUY SECRET only when a C BUY context (Band+Fear) is present.
⸻
4. Long-term regression bands
A second linreg ±σ channel provides long-term extremes:
• LOWER↑ BUY – price crosses up from the lower band (potential buy / re-entry zone).
• UPPER↓ SELL – price crosses down from the upper band (potential sell / take-profit zone).
These are context tags, not standalone trade signals.
⸻
5. How to use
Typical use:
1. Read long-term context with Module B (B BUY / B SELL + SECRET).
2. Use Module A to time swings near the channel edges.
3. Use Module C only for strong Band+Fear pullbacks.
You can enable/disable modules in GLOBAL — Visibility and tune sensitivity for your asset and timeframe.
This indicator is for analysis only and is not financial advice. Always combine it with your own risk management and independent judgement.

IPDA Standard DeviationsIPDA stands for Interbank Price Delivery Algorithm. It’s not a single indicator but a broader conceptual framework from “smart-money” / institutional-flow style trading. According to its proponents, price movement isn’t random — instead, there are “delivery rules” that institutions tend to follow.

NBS.GOLD v3NBS.GOLD v3 is a professional buy & sell level indicator for Gold (XAUUSD).
It displays fixed price levels including Buy entry, Sell entry, 3 Take Profit levels, and 1 Stop loss level for both long and short trades.
All levels are extended on both sides of the chart to make it easier to view reaction points when price reaches the levels.
This version is protected, meaning the source code is hidden, and updates will be delivered automatically to all users.


Universal Lot Size Calculator (Forex, Index, Metals)Multi-functional lot size calculator with support for various instruments
🎯 MAIN FEATURES:
Universal — works with Forex, indices, metals, and custom instruments
Auto-detect — automatically detects instrument type by ticker
Precise position sizing - considering risk and currency conversions
Currency conversion — automatic conversion between deposit currencies
Advanced visualization — entry, stop-loss, take-profit lines
Smart table — convenient display of all parameters
⚙️ SETTINGS GROUPS:
📈 Instrument Settings
Instrument Type — selection: Auto, Forex, Index, Metals, Custom
Custom Contract Size — manual contract size configuration
Use Manual Exchange Rate — manual rate for currency conversion
💰 Account & Risk Settings
Deposit Currency — account currency (USD, EUR, GBP, CHF, JPY)
Account Size — deposit amount
Risk in % — risk percentage from deposit
🎯 Price Levels
Entry Price — entry price
Stop Price — stop-loss price
Target Price — take-profit price
Color settings for each line
📊 Risk/Reward Settings
Manual Target Price — manual TP setting
Show R Levels — display profit levels in R multiples
Show only last R level — show only the last R level
Number of R Levels — number of R levels (1-10)
🎨 Line Styles & Table Appearance
Line style settings (solid, dashed, dotted)
Line width
Table position and size
Color schemes
📈Supported instrument types:
Forex — standard lot 100,000
Indices — E-mini futures (US100=20, SP500=50, US30=5, DAX=25)
Metals — Gold=100 oz, Silver=5000 oz
Custom — user-defined contract size
📱 KEY FEATURES:
- Auto instrument detection:
Indices: US100, SP500, US30, DAX
Metals: XAUUSD (Gold), XAGUSD (Silver)
Forex: all currency pairs
- Smart table with key parameters:
Instrument type and contract size
Account size and risk
Entry/exit prices
Calculated lot size
- Visual elements:
Dynamic level lines
Labels with profit/loss calculations
R-levels for target prices
- Currency conversion:
Automatic rate fetching
Support for USD, EUR, GBP, CHF, JPY
Manual rate setting when needed
⚠️ IMPORTANT NOTES:
Contract sizes may vary between brokers
For CFD brokers use Custom type with Contract Size = 1
During weekends currency rates may be unavailable — use manual rate
When trading in different currencies verify conversion accuracy
🚀 HOW TO USE:
Select instrument type (Auto for auto-detection)
Set deposit size and account currency
Define risk percentage (1-100%)
Specify prices for entry, stop-loss, and take-profit
Use calculated lot to open positions
⚠️ RESETTING CALCULATIONS:
To reuse the calculator with new price levels, you need to:
Right-click on the indicator's table/chart
Select "Reset Points" from the context menu
OR manually update all three price levels (Entry, Stop Loss, Take Profit) in the settings

CPR Scope 3.5Central Pivot Range (CPR):
Monthly
Weekly
Daily
vCPRs will be shown if it is not mitigated.
Camarilla:
L6~H6

EMA Cross with SLEMA Cross with adjustable SL.
Created for M5 timeframe chart.
Best combine with MACD.


Market Structure & Order BlockMarket Structure & Order Block
Day Trading:
1H/M5
Swing:
H4/M15 MMxM
1D/1H MMxM

TJR Strategy - Pinhead TradesMarks Out Session Ranges
BOS/CHOCH/79% Extension
SMT Divergences
Entry Signals (TP/SL)
ATR Based / Fixed RR
Fully Modular
*Based on TJR'S Session Reversal Strategy

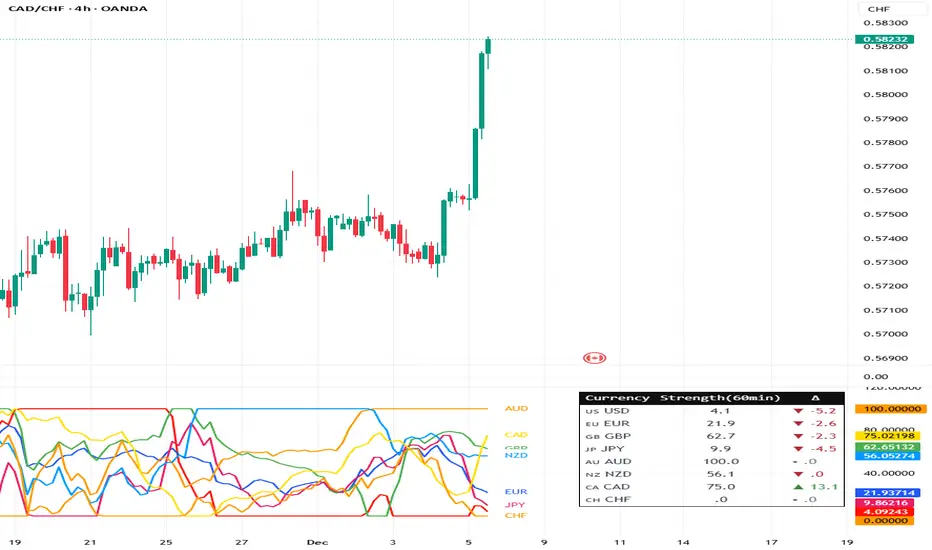
Currency Strength Meter (8 Majors) — invincible3
📊 Currency Strength Meter (8 Majors) — Description
The Currency Strength Meter (8 Majors) calculates the relative performance of the major global currencies — USD, EUR, GBP, JPY, AUD, NZD, CAD, CHF — using aggregated logarithmic returns across all major FX pairs. Strength values are normalized on every bar, allowing users to quickly identify the strongest and weakest currencies at any moment in time.
Each currency’s strength is computed from a basket of 7 related currency pairs, smoothed with EMA, converted into z-scores, and finally normalized to a 0–100 scale for easy comparison.
A built-in table displays the real-time strength for all currencies, along with bar-to-bar delta and directional arrows.
🔶 SETTINGS
General
Broker Prefix
Select the broker symbol prefix used for pair requests (e.g., OANDA:, FX_IDC:).
Calculation Timeframe
Timeframe used to calculate the log returns of currency pairs.
Higher timeframes reduce noise, lower timeframes increase sensitivity.
Lookback Bars
Number of bars (on the calculation timeframe) used to measure logarithmic performance.
Smoothing (EMA)
Smooths currency strength with an EMA of selectable length.
Plot Lines
Option to display the normalized strength of each currency (0–100) directly on the chart.
🔹 Strength Meter Table
Show Table
Enables the on-chart strength meter table.
Show ▲▼ Delta Arrows
Displays directional arrows indicating bar-over-bar momentum:
▲ increasing strength
▼ decreasing strength
• neutral
Size
Controls the table text size (Tiny → Huge).
Layout
Shows:
Currency name & flag
Strength (0–100)
Delta (current – previous bar)
🔶 USAGE
This indicator helps traders quickly determine which currencies are strong and which are weak , and how that strength evolves over time.
Because currencies are evaluated relative to one another , trend strength becomes easier to identify across FX pairs.
Use cases include:
Finding strong vs. weak currency pair combinations
Confirming trend continuation or exhaustion
Identifying momentum shifts through the delta column
Spotting early reversals when strength begins to diverge
Comparing currency performance over multiple timeframes
📈 Example Interpretation
If the USD shows:
Strength = 82
Delta = +3 (▲)
…USD is not only strong, but also getting stronger relative to the previous bar.
If AUD shows:
Strength = 22
Delta = -5 (▼)
…AUD is weak and weakening further.
This makes strong/weak pairing intuitive:
Prefer strong vs weak pairs (e.g., USD/AUD if USD strong & AUD weak)
Avoid neutral or mixed-strength pairs
🔶 DETAILS
Currency Strength Calculation
For each currency pair, the indicator calculates the log-return over the selected lookback window.
Each currency aggregates 7 major related pairs to form a composite strength value.
The aggregated value is smoothed using EMA.
All 8 currencies are converted into z-scores, then normalized to a 0–100 scale for cross-sectional comparison.
A bar-to-bar delta is computed to reveal strengthening or weakening momentum.
This structure ensures the indicator remains stable, consistent, and highly responsive for intraday and higher-timeframe trading.
BK AK-FVG/SR Institutional⚔️ BK AK-FVG/SR Institutional — Smart Money Gaps. True Support/Resistance. ⚔️
There are already some excellent FVG tools out there—built by traders who’ve put in real work studying imbalance, liquidity, and smart money behavior.
BK AK-FVG/SR Institutional is simply my version of that idea: my attempt to take what I learned from those great frameworks and push it further into volume, structure, lifecycle, and accountability—so every zone is treated as a living, graded object, not just a static box on a chart.
This is my 12th script release—and that number matters to me. Twelve is structure: twelve tribes, twelve months, twelve divisions of ordered space. It’s the number of complete arrangement. So for script twelve, I’m releasing what I consider my institutional map—a tool built specifically around boundaries, alignment, and where real money chooses to defend and attack.
This script is invite-only. Access is controlled. It’s built for traders who actually respect structure, not tourists looking for colors on a chart.
“AK” in the name is not branding—it’s honor. It belongs to my mentor A.K., whose standard of discipline and clarity sits behind every decision in this tool. Above that, all glory and gratitude to Gd—the real source of any wisdom, edge, or endurance we have in this game.
🧠 What BK AK-FVG/SR Institutional Actually Does
This is a full institutional FVG/SR system, not a paintbrush. It:
Detects and manages bullish & bearish FVG zones using ATR/percent filters and aging logic
Assigns a 0–100 institutional strength score and 1–5★ rating to every zone
Builds a per-zone lower-timeframe volume profile with POC, volume delta, and optional volume text
Tracks historical touches, breaks, role reversals, merging, clustering, and divergence at the zone
Runs per-zone backtest stats and feeds that into an adaptive/ML-style confidence weight
Compresses the whole environment into a real-time Info Table: bias, market position, nearest S/R, risk, session
Fires alerts only when something actually matters: strong FVGs, magnetic pull, divergence at a level
If price is the map, this is the layer that tells you which levels are real and which are noise.
🧱 Core Engine — Institutional Zone Logic
Smart FVG Detection
Clean 3-bar gap logic for bullish & bearish FVGs
ATR or % based minimum gap size + optional distance filter from price
Zone aging with max life in bars and optional “reset on touch”
Overlap & proximity control:
Prevent overlapping zones
Enforce minimum bar spacing
Or keep only the strongest zone in a cluster
Institutional Strength & Rating
Each zone gets a score (0–100) + star rating (1–5★) based on:
Volume vs average (with optional lower timeframe split)
Gap size vs ATR
Pivot confluence
Historical meaningful touches
Role reversal (support ↔ resistance)
MTF FVG alignment
Session weighting (Asian / London / NY / overlaps)
Order block overlap & imbalance behavior
VWAP proximity/extremes
Fib level alignment
Delta divergence
Zone clustering & consolidation
Adaptive “performance weight” from historical reactions
Bad zones don’t just look weaker—they literally get filtered out when you enable minimum star / institutional filters.
📊 In-Zone Volume & Profile Intelligence
Each zone can be backed by lower-timeframe volume:
Per-zone volume histogram inside the gap
POC line at the most traded price in that zone
Optional total volume label
POC line color shifts with volume delta (buy vs sell pressure)
Additional bull/bear volume bars alongside the zone and/or numeric volume text inside the box
You’re not just staring at a gap—you’re seeing the liquidity pocket inside the gap.
🎯 Structure, Confluence & Role Reversal
The engine includes deep structural context:
Pivots: stored swing highs/lows for S/R confluence
MTF FVG Confluence: two extra timeframes for higher-timeframe alignment
Fibonacci Levels: auto-mapped 0.236 / 0.382 / 0.5 / 0.618 / 0.786 with optional lines & labels
Order Blocks & Imbalance: engulfing OB detection + volume/imbalance filters
VWAP Intelligence: VWAP proximity/extreme bonuses, optional short-form plotting
Delta Divergence: volume-based confirmation flags for zones under real internal pressure
Smart S/R Positioning & Role Flip
Hide “wrong side” zones or auto-flip roles when broken & retested
Track broken zones for N bars, then retire them
Mark role reversals with badges and strength bonuses
Support/resistance is treated like behavior, not just lines.
🤖 Adaptive Learning & Backtesting
Each zone is monitored when price touches it:
Checks if price respects the zone and moves X points away (success)
Or violates beyond failure threshold (failure)
Tracks successes, failures, and win rate per zone
Feeds a confidence score into an adaptive weight so consistently performing zones matter more
Zones that meet the bar get ML/🤖 marking when enabled
The script doesn’t just say “this looks strong”—it tracks how it actually behaved.
📋 Info Table & Sessions — On-Chart War Room
On the latest bar, an Info Table summarizes:
Zone count (bull vs bear)
Market position (NEAR SUPPORT / NEAR RESISTANCE / ABOVE RESISTANCE / BELOW SUPPORT / NEUTRAL)
Nearest S/R levels
Trade bias (BULLISH / BEARISH / NEUTRAL)
Active session (ASIAN / LONDON / NY / OVERLAP / OFF)
Risk level (LOW / MED / HIGH)
Sessions are coded in EST with multipliers so you can weight London/NY more heavily than Asia if that matches your playbook.
Hover the table for a strategy tooltip: live market posture, suggested behavior near the zones, and context around the current environment.
⚠ Divergence & Alerts
Real-time RSI/OBV/ADX divergence detection at the zone
Flexible visual modes: border, icon, color change, or combinations
Alerts included:
Magnetic Zone Pull (price entering ATR-based “field” of a strong zone)
Strong Bullish FVG
Strong Bearish FVG
Divergence at Zone
Let the chart call you when a real decision point appears, instead of forcing you to stare all day.
🕹 How to Use BK AK-FVG/SR Institutional
1️⃣ Build Bias With Structure
Use the Info Table, star ratings, and where the 4–5★ zones cluster relative to price to decide which side of the tape you’re allowed to trade on.
2️⃣ Only Trade From Strong, Aligned Zones
Focus on 4–5★ zones with confluence (pivots, Fib, OB, VWAP, clustering).
Use the zone body/wick region as your execution area, not some random mid-air candle.
3️⃣ Treat Role Reversal & Clusters as Campaign Nodes
When a strong zone breaks, flips role, and collects touches, that’s campaign territory—not scalp noise.
4️⃣ Use Divergence/Delta as a Brake, Not a Toy
If divergence lights up at your level, respect it: size down, wait for confirmation, or stand down.
5️⃣ Let the Engine Filter Junk For You
Tune volMultiplier, star thresholds, session multipliers, distance filters, and min star rating to match your timeframe and instrument.
This script’s job is to remove your excuse for taking low-quality trades.
📜 Boundaries & Wisdom
King Solomon wrote:
“Do not remove the ancient boundary stone that your fathers have set.”
This tool is built around that idea. It maps where the real boundaries live—where smart money defends, attacks, traps, and reverses.
It will not give you discipline. It will simply remove the illusion that “you didn’t know the level was there.”
🔒 Access & Usage
This is an invite-only TradingView script.
Access is granted at my discretion to traders who take structure, risk, and discipline seriously.
⚔️ BK AK-FVG/SR Institutional — Map the Smart Money Gaps. Trade Only the Real Levels.
May Gd bless your vision, your patience, and every decision you make at the edge. 🙏

Combo ProCombo Pro – Regression Channel & Long-Term Flows
This script is a visual study tool, not a trading strategy. It does not place trades or guarantee results. It simply helps to analyze price context, volatility and “flow” on the chart.
The indicator is built in three blocks:
Module A – Swing regression channel + emotional cycle
• Draws a regression channel (±σ) around price to highlight extended moves up/down.
• Adds a simple trend filter MA and basic volatility filters (ATR%).
• Includes an emotional cycle (Fear/Greed style) that tries to smooth price swings and mark potential “over-fear” / “over-greed” zones.
• “A BUY” / “A SELL” markers only show where channel + cycle conditions align; they are not automatic trade signals.
Module C – Previous candle below lower band + Fear
• Marks situations where the previous bar is below the lower regression band and the emotional cycle is in a “Fear” zone.
• Adds optional exit conditions (price back above the trend MA and/or above the Greed line).
• This module is meant to highlight potential exhaustion areas, not to provide standalone entries or exits.
Module B – Long-term MA, Whale Money Flow, TIF & SECRET votes
• Measures percentage distance from a long-term MA (pd) as a simple valuation context (cheap/expensive vs. average).
• Uses a custom Whale Money Flow to approximate when larger participants might be more/less active.
• Uses TIF (Trades in Favor) as a retail positioning/pressure gauge.
• “SECRET” logic combines valuation, whales and TIF into a vote system to highlight possible extreme zones.
• Long-term regression bands and their crosses are plotted as BUY/SELL zones only in a descriptive sense (price reaching extreme bands), not as guaranteed signal levels.

MirPapa_Lib_BoxLibrary "MirPapa_Lib_Box"
GetHTFrevised(_tf, _case)
GetHTFrevised
@description Retrieve a specific bar value from a Higher Time Frame (HTF) series.
Parameters:
_tf (string) : string The target HTF string (examples: "60", "1D").
_case (string) : string Case string determining which OHLC value to request.
@return float Returns the requested HTF value or na if _case does not match.
GetHTFrevised(_tf)
Parameters:
_tf (string)
GetHTFoffsetToLTFoffset(_offset, _chartTf, _htfTf)
GetHTFoffsetToLTFoffset
@description Adjust an HTF offset to an LTF offset by calculating the ratio of timeframes.
Parameters:
_offset (int) : int The HTF bar offset (0 means current HTF bar).
_chartTf (string) : string The current chart's timeframe (e.g., "5", "15", "1D").
_htfTf (string) : string The High Time Frame string (e.g., "60", "1D").
@return int The corresponding LTF bar index. Returns 0 if the result is negative.
GetHtfFromLabel(_label)
GetHtfFromLabel
@description Convert a Korean HTF label into a Pine Script timeframe string.
Parameters:
_label (string) : string The Korean label (e.g., "5분", "1시간").
@return string Returns the corresponding Pine Script timeframe (e.g., "5", "60").
IsChartTFcomparisonHTF(_chartTf, _htfTf)
IsChartTFcomparisonHTF
@description Determine whether a given HTF is greater than or equal to the current chart timeframe.
Parameters:
_chartTf (string) : string Current chart timeframe (e.g., "5", "15", "1D").
_htfTf (string) : string HTF timeframe (e.g., "60", "1D").
@return bool True if HTF ≥ chartTF, false otherwise.
IsCondition(_boxType, _isBull, _pricePrev, _priceNow)
IsCondition
@description FOB, FVG 조건 체크.\
_boxType: "fob"(Fair Order Block) 또는 "fvg"(Fair Value Gap).\
_isBull: true(상승 패턴), false(하락 패턴).\
상승 시 현재 가격이 이전 가격보다 높으면 true, 하락 시 이전 가격이 현재 가격보다 높으면 true 반환.
Parameters:
_boxType (string) : 박스 타입 ("fob", "fvg")
_isBull (bool) : 상승(true) 또는 하락(false)
_pricePrev (float) : 이전 가격
_priceNow (float) : 현재 가격
Returns: bool 조건 만족 여부
IsCondition(_boxType, _high2, _high1, _high0, _low2, _low1, _low0)
IsCondition
@description Sweep 조건 체크 (Swing High/Low 동시 발생).\
_boxType: "sweep" 또는 "breachBoth".\
조건: high2 < high1 > high0 (Swing High) AND low2 > low1 < low0 (Swing Low).\
중간 캔들이 양쪽보다 높고 낮은 지점을 동시에 형성할 때 true 반환.
Parameters:
_boxType (string) : 박스 타입 ("sweep", "breachBoth")
_high2 (float)
_high1 (float)
_high0 (float)
_low2 (float)
_low1 (float)
_low0 (float)
Returns: bool 조건 만족 여부
IsCondition(_boxType, _isBull, _open1, _close1, _high1, _low1, _open0, _close0, _low2, _low3, _high2, _high3)
IsCondition
@description RB (Rejection Block) 조건 체크.\
_boxType: "rb" (Rejection Block).\
상승 RB: candle1=음봉, candle0=양봉, low3>low1 AND low2>low1, close1*1.001>open0, open1close0.\
이전 캔들의 거부 후 현재 캔들이 반대 방향으로 전환될 때 true 반환.
Parameters:
_boxType (string) : 박스 타입 ("rb")
_isBull (bool) : 상승(true) 또는 하락(false)
_open1 (float)
_close1 (float)
_high1 (float)
_low1 (float)
_open0 (float)
_close0 (float)
_low2 (float)
_low3 (float)
_high2 (float)
_high3 (float)
Returns: bool 조건 만족 여부
IsCondition(_boxType, _isBull, _open2, _close1, _open1, _close0)
IsCondition
@description SOB (Strong Order Block) 조건 체크.\
_boxType: "sob" (Strong Order Block).\
상승 SOB: 양봉2 => 음봉1 => 양봉0, open2 > close1 AND open1 < close0.\
하락 SOB: 음봉2 => 양봉1 => 음봉0, open2 < close1 AND open1 > close0.\
3개 캔들 패턴으로 강한 주문 블록 형성 시 true 반환.
Parameters:
_boxType (string) : 박스 타입 ("sob")
_isBull (bool) : 상승(true) 또는 하락(false)
_open2 (float) : 2개 이전 캔들 open
_close1 (float) : 1개 이전 캔들 close
_open1 (float) : 1개 이전 캔들 open
_close0 (float) : 현재 캔들 close
Returns: bool 조건 만족 여부
CreateBox(_boxType, _tf, _isBull, _useLine, _colorBG, _colorBD, _colorText, _cache)
CreateBox
@description 박스 생성 (breachMode 자동 결정).\
_boxType: "fob", "rb", "custom" → directionalHighLow, 나머지 → both.\
_tf: 시간대 (timeframe.period 또는 HTF).\
_isBull: true(상승 박스), false(하락 박스).\
_cache: HTF 사용 시 필수, CurrentTF는 na.\
반환: .
Parameters:
_boxType (string) : 박스 타입
_tf (string) : 시간대
_isBull (bool) : 상승(true) 또는 하락(false)
_useLine (bool) : 중간선 표시 여부
_colorBG (color) : 박스 배경색
_colorBD (color) : 박스 테두리색
_colorText (color) : 텍스트 색상
_cache (HTFCache) : HTF 캐시 데이터
Returns: 성공 여부와 박스 데이터
CreateBox(_boxType, _tf, _isBull, _useLine, _colorBG, _colorBD, _colorText, _cache, _customText)
CreateBox
@description 박스 생성 (커스텀 텍스트 지원, breachMode 자동 결정).\
_boxType: "fob", "rb", "custom" → directionalHighLow, 나머지 → both.\
_customText: 박스에 표시할 텍스트 (비어있으면 "시간대 박스타입" 형식으로 자동 생성).\
_isBull: true(상승 박스), false(하락 박스).\
반환: .
Parameters:
_boxType (string) : 박스 타입
_tf (string) : 시간대
_isBull (bool) : 상승(true) 또는 하락(false)
_useLine (bool) : 중간선 표시 여부
_colorBG (color) : 박스 배경색
_colorBD (color) : 박스 테두리색
_colorText (color) : 텍스트 색상
_cache (HTFCache) : HTF 캐시 데이터
_customText (string) : 커스텀 텍스트
Returns: 성공 여부와 박스 데이터
CreateBox(_boxType, _breachMode, _tf, _isBull, _useLine, _colorBG, _colorBD, _colorText, _cache, _customText)
CreateBox
@description 박스 생성 (breachMode 명시적 지정).\
_breachMode: "both"(양쪽 모두 돌파), "directionalHighLow"(방향성 high/low 돌파), "directionalClose"(방향성 close 돌파).\
_isBull: true(상승 박스), false(하락 박스).\
_customText: 박스에 표시할 텍스트 (비어있으면 "시간대 박스타입" 형식으로 자동 생성).\
반환: .
Parameters:
_boxType (string) : 박스 타입 (fob, fvg, sweep, rb, custom 등)
_breachMode (string) : 돌파 처리 방식: "both" (양쪽 모두), "directionalHighLow" (방향성 high/low), "directionalClose" (방향성 close)
_tf (string) : 시간대
_isBull (bool) : 상승(true) 또는 하락(false) 방향
_useLine (bool) : 중간선 표시 여부
_colorBG (color) : 박스 배경색
_colorBD (color) : 박스 테두리색
_colorText (color) : 텍스트 색상
_cache (HTFCache) : HTF 캐시 데이터 (CurrentTF는 na)
_customText (string) : 커스텀 텍스트 (비어있으면 자동 생성)
Returns: 성공 여부와 박스 데이터
CreateCustomBox(_boxType, _breachMode, _isBull, _top, _bottom, _left, _right, _useLine, _colorBG, _colorBD, _colorText, _text)
CreateCustomBox
@description 완전히 유연한 커스텀 박스 생성.\
사용자가 박스 위치(top, bottom, left, right), breach mode, 모든 파라미터를 직접 지정.\
조건 체크는 사용자 스크립트에서 수행하고, 이 함수는 박스 생성만 담당.\
새로운 박스 타입 추가 시 라이브러리 수정 없이 사용 가능.
Parameters:
_boxType (string) : 박스 타입 (사용자 정의 문자열)
_breachMode (string) : 돌파 처리 방식: "both", "directionalHighLow", "directionalClose", "sobClose"
_isBull (bool) : 상승(true) 또는 하락(false) 방향
_top (float) : 박스 상단 가격
_bottom (float) : 박스 하단 가격
_left (int) : 박스 시작 시간 (xloc.bar_time 사용)
_right (int) : 박스 종료 시간 (xloc.bar_time 사용)
_useLine (bool) : 중간선 표시 여부
_colorBG (color) : 박스 배경색
_colorBD (color) : 박스 테두리색
_colorText (color) : 텍스트 색상
_text (string) : 박스에 표시할 텍스트
Returns: 성공 여부와 박스 데이터
ProcessBoxDatas(_openBoxes, _closedBoxes, _useMidLine, _closeCount, _colorClose, _currentBarIndex, _currentLow, _currentHigh, _currentTime)
ProcessBoxDatas
@description 박스 확장 및 돌파 처리.\
열린 박스들을 현재 bar까지 확장하고, 돌파 조건 체크.\
_closeCount: 돌파 횟수 (이 횟수만큼 돌파 시 박스 종료).\
breachMode에 따라 돌파 체크 방식 다름 (both/directionalHighLow/directionalClose).\
종료된 박스는 _closedBoxes로 이동하고 _colorClose 색상 적용.\
barstate.islast와 barstate.isconfirmed에서 호출 권장.
Parameters:
_openBoxes (array) : 열린 박스 배열
_closedBoxes (array) : 닫힌 박스 배열
_useMidLine (bool) : 중간선 표시 여부
_closeCount (int) : 돌파 카운트 (이 횟수만큼 돌파 시 종료)
_colorClose (color) : 종료된 박스 색상
_currentBarIndex (int) : 현재 bar_index
_currentLow (float) : 현재 low
_currentHigh (float) : 현재 high
_currentTime (int) : 현재 time
Returns: bool 항상 true
UpdateHTFCache(_cache, _tf)
UpdateHTFCache
@description HTF 데이터 캐싱 (성능 최적화).\
HTF의 OHLC 데이터를 캐싱하여 매 틱마다 request.security 호출 방지.\
_cache: 기존 캐시 (없으면 na, 첫 호출 시).\
_tf: 캐싱할 시간대 (예: "60", "1D").\
새 bar 또는 bar_index 변경 시에만 업데이트, 그 외에는 기존 캐시 반환.\
Parameters:
_cache (HTFCache) : 기존 캐시 데이터 (없으면 na)
_tf (string) : 시간대
Returns: HTFCache 업데이트된 캐시 데이터
GetTimeframeSettings(_currentTF, _midTF1m, _highTF1m, _midTF5m, _highTF5m, _midTF15m, _highTF15m, _midTF30m, _highTF30m, _midTF60m, _highTF60m, _midTF240m, _highTF240m, _midTF1D, _highTF1D, _midTF1W, _highTF1W, _midTF1M, _highTF1M)
GetTimeframeSettings
@description 현재 차트 시간대에 맞는 중위/상위 시간대 자동 선택.\
_currentTF: 현재 차트 시간대 (timeframe.period).\
1분~1월 차트별로 적절한 중위/상위 시간대 매핑.\
예: 5분 차트 → 중위 15분, 상위 60분.\
반환: .\
Parameters:
_currentTF (string) : 현재 차트 시간대
_midTF1m (string)
_highTF1m (string)
_midTF5m (string)
_highTF5m (string)
_midTF15m (string)
_highTF15m (string)
_midTF30m (string)
_highTF30m (string)
_midTF60m (string)
_highTF60m (string)
_midTF240m (string)
_highTF240m (string)
_midTF1D (string)
_highTF1D (string)
_midTF1W (string)
_highTF1W (string)
_midTF1M (string)
_highTF1M (string)
Returns:
BoxData
BoxData
Fields:
_type (series string) : 박스 타입 (fob, fvg, sweep, rb, custom 등)
_breachMode (series string) : 돌파 처리 방식
_isBull (series bool) : 상승(true) 또는 하락(false) 방향
_box (series box)
_line (series line)
_boxTop (series float)
_boxBot (series float)
_boxMid (series float)
_topBreached (series bool)
_bottomBreached (series bool)
_breakCount (series int)
_createdBar (series int)
HTFCache
Fields:
_timeframe (series string)
_lastBarIndex (series int)
_isNewBar (series bool)
_barIndex (series int)
_open (series float)
_high (series float)
_low (series float)
_close (series float)
_open1 (series float)
_close1 (series float)
_high1 (series float)
_low1 (series float)
_open2 (series float)
_close2 (series float)
_high2 (series float)
_low2 (series float)
_high3 (series float)
_low3 (series float)
_time1 (series int)
_time2 (series int)


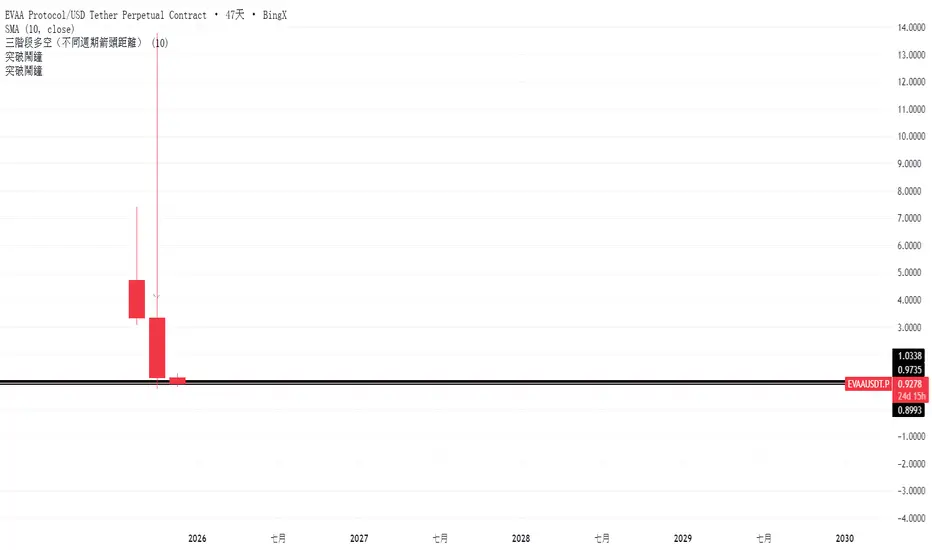
突破鬧鐘//@version=5
indicator("突破鬧鐘", overlay=true)
prevHigh = high
prevLow = low
var label activeLabel = na
var int activeDirection = 0
isBreakHigh = high >= prevHigh
isBreakLow = low <= prevLow
if activeDirection == 1 and low < prevHigh
label.delete(activeLabel)
activeLabel := na
activeDirection := 0
if activeDirection == -1 and high > prevLow
label.delete(activeLabel)
activeLabel := na
activeDirection := 0
if isBreakHigh and activeDirection != 1
if not na(activeLabel)
label.delete(activeLabel)
activeLabel := label.new(bar_index, low, text="突破前高: " + str.tostring(prevHigh), style=label.style_label_up, color=color.green, textcolor=color.white, yloc=yloc.belowbar)
activeDirection := 1
if isBreakLow and activeDirection != -1
if not na(activeLabel)
label.delete(activeLabel)
activeLabel := label.new(bar_index, high, text="跌破前低: " + str.tostring(prevLow), style=label.style_label_down, color=color.red, textcolor=color.white, yloc=yloc.abovebar)
activeDirection := -1

244D-VWAP■What is VWAP
The standard VWAP (Volume-Weighted Average Price) is calculated by taking *all trades* executed during a trading day, summing up “price × volume” for each trade, and then dividing by the total volume traded. In other words, it is an average price that reflects **how many shares were traded at which price levels**. On a chart it appears as a line, and whether the current price is above or below the VWAP can provide one gauge of market strength, or whether the stock is trading “fairly”, “cheaply” or “expensively.”
■Features of “244 D VWAP
This script displays the VWAP calculated over the past 244 days. It can also be switched to use a 1-hour VWAP or a 15-minute VWAP instead.
■How to use it
* If the price is *above* the 244-day VWAP → you might interpret this as “people who bought over the past year are — on aggregate — sitting on a profit.”
* If the price is *below* the 244-day VWAP → you might interpret this as “people who bought over the past year are — on aggregate — at a loss.”

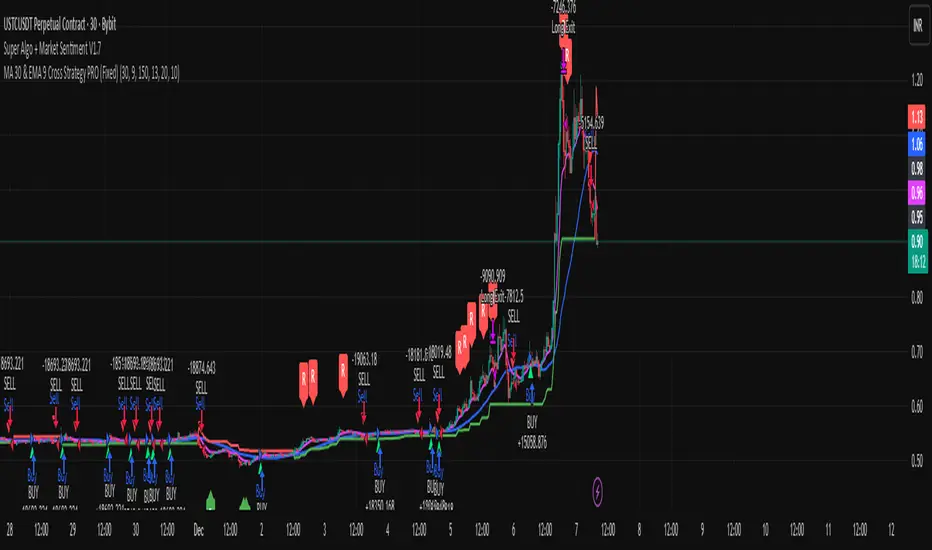
Sunny Quantum Momentum Framework (SQMF)Sunny Quantum Momentum Framework (SQMF) – Strategy Description
The Sunny Quantum Momentum Framework is a dynamic trend-adaptive trading model designed to identify early momentum shifts and capitalize on directional price movements. The strategy blends multiple market-sensitive components to filter noise, detect emerging trends, and optimize entries with precision.
SQMF works by continuously evaluating price behavior, volatility fluctuations, and short-term trend acceleration to generate actionable signals. Instead of relying on a single indicator, the framework integrates layered momentum structures and adaptive smoothing techniques to maintain signal quality across different market conditions.
The system focuses on:
Detecting momentum transitions with minimal lag
Reducing false signals through multi-stage validation
Aligning entries with broader trend conditions
Managing trades dynamically using built-in risk controls
SQMF is designed for traders seeking a balanced approach—fast enough to catch early movements, but stable enough to avoid common market noise. The strategy is suitable for intraday, swing, and algorithmic trading environments.
1012多空n//@version=5
indicator("三階段多空訊號(極致穩定版)", overlay=true)
maLen = input.int(10, "MA 長度")
ma = ta.sma(close, maLen)
tick = syminfo.mintick
var bool l1 = false
var bool l2 = false
var float l2Open = na
var float l2Close = na
var label lArrow = na
var bool s1 = false
var bool s2 = false
var float s2Open = na
var float s2Close = na
var label sArrow = na
// ===== 做多 =====
if close > ma and not l1
l1 := true
if l1 and close < close and open > ma and close > ma
l2 := true
l2Open := open
l2Close := close
if l2
if not ((open > ma and close > ma) or (not na(l2Close) and open == l2Close))
l1 := false
l2 := false
l2Open := na
l2Close := na
longTrigger = barstate.isconfirmed and l2 and close > l2Open and close > l2Close
if longTrigger
if not na(lArrow)
label.delete(lArrow)
lArrow := label.new(bar_index, low - tick * 5, "", style=label.style_arrowup, color=color.green, textcolor=color.green, size=size.large)
alert("做多", alert.freq_once_per_bar_close)
l1 := false
l2 := false
l2Open := na
l2Close := na
// ===== 做空 =====
if close < ma and not s1
s1 := true
if s1 and close > close and open < ma and close < ma
s2 := true
s2Open := open
s2Close := close
if s2
if not ((open < ma and close < ma) or (not na(s2Close) and open == s2Close))
s1 := false
s2 := false
s2Open := na
s2Close := na
shortTrigger = barstate.isconfirmed and s2 and close < s2Open and close < s2Close
if shortTrigger
if not na(sArrow)
label.delete(sArrow)
sArrow := label.new(bar_index, high + tick * 5, "", style=label.style_arrowdown, color=color.red, textcolor=color.red, size=size.large)
alert("做空", alert.freq_once_per_bar_close)
s1 := false
s2 := false
s2Open := na
s2Close := na
alertcondition(longTrigger, "做多", "做多")
alertcondition(shortTrigger, "做空", "做空")
Swing Aurora v7.0 — The ExecutionerSwing Aurora v7.0 — The Executioner
Swing Aurora v7.0 is a multi-engine swing trading framework that combines trend-following, momentum, HTF confluence and SMC/Fibonacci structure in one script.
This version moves from a rigid gate logic to a scoring + state machine engine, so you can see not only if there is a signal, but how strong that signal really is.
🧠 1. Scoring Engine – A-Grade & B-Grade Signals
Instead of a single if (all conditions == true) check, v7.0 builds a score on every bar:
Trend score – position vs Baseline, slope, Supertrend direction.
Momentum score – MACD, RSI-Stoch triggers, ADX, local HH/LL.
HTF score – alignment with higher timeframe Baseline, Bias EMA, EMAs and RSI.
Confluence flags – divergences, ST flip/retest, SMC zones, VDub context.
Results:
A-Grade (Strong) signals → high score, strong trend + momentum + HTF alignment.
B-Grade (Speculative) signals → early/partial setups, clearly marked as higher risk.
You no longer lose good entries just because one minor filter disagrees, but you can clearly distinguish high-quality setups from speculative ones.
🔁 2. Strict Trade Cycle – State Machine
v7.0 uses a simple state machine:
0 = Flat, 1 = Long, -1 = Short.
When you are Long, the script only looks for exits or reversals, not new BUY entries.
Same for Short.
This enforces a clean, disciplined flow:
BUY → Hold → EXIT → wait for next setup, without label spam or conflicting signals while already in a position.
🛡️ 3. Quality Gates & Anti-FOMO Filters
To avoid buying local tops or chopping yourself to death:
RSI Gate – blocks BUY when RSI is already overbought (and vice-versa for SELL).
ATR Over-Extension filter – no entries when price is too far from the Baseline (parabolic moves).
No-Trade / Chop zone – combines ADX, ATR vs ATR-slow, distance to Baseline, Bollinger/Keltner squeeze and volume behavior.
Volume Gate – requires a real volume spike, not just random price wiggle.
Supertrend Gate – entries are synchronized with ST (flip / early / retest — configurable).
HTF Guardrails – optional: blocks entries against the dominant HTF regime.
📈 4. Visual Layer: Trend Map, Labels & Gradient
BUY/SELL labels with confidence percentage.
Background gradient based on trend direction and strength (ADX).
EMA 13/21 + Baseline with dynamic bull/bear colors.
Optional mini-legend showing: TS / RSI / ADX / HTF status at a glance.
🧩 5. Divergences, VDub & Macro Map
Full divergence engine (classic + hidden) on a basket of indicators (RSI, MACD, CCI, OBV, etc.), with optional lines and count labels.
VDub levels & signals – “smart levels” (solid/dotted) and add-on BUY/SELL signals filtered by market regime.
HTF Macro Map – higher timeframe Baseline, Bias EMA, fast EMAs, RSI and slope, using an auto or user-selected higher TF.
🧱 6. SMC Zones & Fibonacci (v7.0 Logic)
The SMC / Fibo component was refined so it is not hard-wired to the current bar’s entry signal:
Automatic HH / HL / LH / LL market structure labelling.
Demand / Supply zones:
derived from BOS with ATR buffer,
auto-update bar-by-bar,
auto-delete when broken or after a user-defined lifetime.
Fibonacci range:
built from the latest valid swing-high / swing-low,
shows 0 / 0.382 / 0.5 / 0.618 / 1 / 1.618 levels plus equilibrium line,
persists while the range is valid (independent of being in a trade).
AI zone boost (v7.0) – optional: zone opacity adapts dynamically to the underlying confidence score, highlighting higher-quality areas.
⚙️ 7. Modes & Configuration
Modes: Aggressive / Balanced / Conservative – adjust score thresholds and confidence requirements.
Risk & Quality: slope filter, min ATR distance, strict anti-chop, volume gate, HTF guardrails.
Visual toggles: labels on/off, baseline & EMAs, gradient, mini-legend, SMC boxes, Fibonacci.
This script does not trade for you – it provides a structured, consistent framework for reading trend, momentum and structure, plus graded signals so you can execute your own risk management and strategy.
Disclaimer
This script is provided strictly for educational and research purposes. It does not constitute financial advice, investment recommendation or any guarantee of profit. Historical performance, backtests and chart examples do not ensure future results.
Always use your own risk management rules, test the script on multiple instruments and timeframes, and never trade with money you cannot afford to lose. The author and contributors accept no responsibility for any trading decisions made based on this indicator.
