Global Session MarkerA pinescript-coded indicator intended for TradingView that indicates US/EU/AS sessions, namely 16:00 closes for American equity and how that can impact cryptocurrency ETFs that are designed to deliver a multiple of the daily performance of their underlying benchmark.
Indicadores e estratégias

ES1! Manipulation/Distribution Projections (17 years OHLC Stats)Overview
The Manipulation/Distribution Projections (OHLC Stats) indicator is a powerful tool designed to forecast potential price levels for various timeframes on S&P 500 E-mini futures (ES1!). It operates on a simple yet profound principle: price action within a single candle can be broken down into “manipulation” and “distribution” phases.
By analyzing over 17 years of ES (ES1!) historical OHLC data externally in Python, this script calculates the average (mean) and typical (median) extent of these movements. These statistical insights are then used to project key levels on your chart based on the current period’s opening price—providing a statistically-grounded framework for potential support, resistance, and price targets.
________________________________________
Key Concepts Explained
The indicator’s logic is based on how price wicks and bodies form relative to the opening price.
• Manipulation: This refers to the initial move that goes against the candle’s eventual direction.
o For a bullish candle, it’s the lower wick (the move from the open down to the low before reversing higher).
o For a bearish candle, it’s the upper wick (the move from the open up to the high before selling off).
It represents a “fake out” or a stop hunt.
• Distribution: This is the primary, directional move of the candle from the opening price.
o For a bullish candle, it’s the distance from the open to the high.
o For a bearish candle, it’s the distance from the open to the low.
It represents the “real” intended direction of price for that period.
________________________________________
How It Works
This indicator does not calculate these ratios in real-time. Instead, it leverages a comprehensive statistical analysis performed externally in Python on over 17 years of ES (ES1!) OHLC data. This analysis determined the mean and median ratios for both Manipulation and Distribution movements across different timeframes and, for intraday periods, different times of day.
These pre-computed, static ratios are embedded directly into the script. When a new period begins (e.g., a new day on the Daily timeframe), the indicator:
1. Takes the opening price for that period.
2. Retrieves the corresponding pre-calculated Manipulation and Distribution ratios.
3. Applies these ratios to the opening price to project eight potential price levels:
o
/ - Mean Distribution
o
/ - Median Distribution
o
/ - Mean Manipulation
o
/ - Median Manipulation
This approach provides a stable, forward-looking set of levels for the entire duration of the trading period.
________________________________________
Features
• Statistically-Derived Projections: Plots eight key price levels based on historical tendencies, providing clear potential zones for entries, exits, and stop placement.
• Selectable Timeframe: Choose to view projections for the 1H, 4H, 1D, or 1W periods directly from the settings.
• Dynamic Stats Table: A powerful, on-chart dashboard that provides real-time context. For all four timeframes (1H, 4H, 1D, 1W), it shows:
o Position: Where the current price is relative to the projected zones (e.g., “In +Manip Zone,” “Below -Dist”).
o Range Completed: The percentage of the historical average range that the current period has already covered.
o Current & Average Range: The current high-to-low range in points vs. the historical average.
• Historical Context: You can display levels for previous periods to see how price has interacted with them in the past.
• Full Customization: Control the color, style, and visibility of every line, label, and fill to match your chart’s theme.
________________________________________
How to Use
This indicator is versatile and can be integrated into various trading strategies.
• Identifying Targets & Reversal Zones: The Distribution levels (especially the zone between the median and mean) can serve as logical take-profit targets, as they represent a historical point of extension. Conversely, Manipulation levels can indicate areas where price might form a wick and reverse.
• Gauging Volatility: Use the Stats Table’s “Range Completed” column to assess market conditions. If the 1D range is only 30% complete by mid-day, there may be room for significant expansion. If it’s already at 150%, the market might be overextended and due for consolidation.
• Multi-Timeframe Confluence: Use the Stats Table to quickly check if the price on a lower timeframe (e.g., 1H) is approaching a significant level on a higher timeframe (e.g., 1D), adding more weight to that level.
• Defining Bias: If the price opens and holds above the Manipulation zones, it can signal a strong directional bias for the rest of the period.
________________________________________
Settings
• Projection Timeframe: The primary timeframe for which to calculate and display the levels.
• Historical Periods to Show: Set to 1 for only the current period, or increase to see how levels from past periods held up.
• Timezone: Set the timezone for accurate hourly calculations (defaults to America/New_York).
• Visuals: Customize the appearance of the projection lines, labels, and the shaded zones between mean and median levels.
• Stats Table: Enable/disable the table and configure its position, size, and colors.
________________________________________
Disclaimer
This indicator is for informational and educational purposes only. It does not constitute financial advice or a recommendation to buy or sell any asset. All trading involves risk, and past performance is not indicative of future results. Please do your own research and risk management.
Enjoy!

Trading Session IL7 Session-Based Intraday Momentum IndicatorOverview
This indicator is designed to support discretionary traders by highlighting intraday momentum phases based on price behavior and trading session context.
It is intended as a confirmation tool and not as a standalone trading system or automated strategy.
Core Concept
The script combines multiple market observations, including:
- Directional price behavior within the current timeframe
- Structural consistency in recent price movement
- Session-based filtering to focus on periods with higher activity and liquidity
Signals are only displayed when internal conditions align, helping traders avoid low-quality setups during sideways or low-momentum market phases.
How to Use
This indicator should be used to confirm existing trade ideas rather than generate trades on its own.
It can help traders:
- Identify periods where momentum is more likely to continue
- Filter out trades during unfavorable market conditions
- Align intraday execution with higher-timeframe bias
Best results are achieved when used alongside key price levels, higher-timeframe structure and proper risk management.
Limitations
This indicator does not predict future price movements.
Signals may change during active candles.
Market conditions may reduce effectiveness during extremely low volatility periods.
Language Notice
The indicator’s user interface labels are displayed in German.
This English description is provided first to comply with TradingView community script publishing rules.

MTF Dashboard Pro v2.3 © 2025 - Sachin ThakareMTF Dashboard Pro v2.3 — A premium multi-timeframe market dashboard created for professional traders.
Features include:
• MTF EMA Trend (9/21)
• MTF 200 MA System with Threshold Logic
• Session-based VWAP (Daily Reset)
• SuperTrend (Corrected Direction Engine)
• RSI / MACD / ADX / Alligator
• Stochastic (Correct Pine Signature)
• Daily PDH / PDL Bias
• 11-Signal Institutional Bias Score
• Trend Strength Classification (Strong Bull → Strong Bear)
• Multi-TF Alerts for Strong Bull / Strong Bear
• Optimized Table Engine & Enhanced Performance
Designed for Scalping, intraday, swing, and high-precision market bias evaluation across 3m → 1M timeframes.
Built & optimized by Sachin Thakare (2025 Edition).

Range&Swing - 2SD Band + 2/3SD Arrows + HTF Supertrendthis is my first indicator, please be nice to me
i combined Band, 2sd + 3sd arrows and also supertrend for swing plays

AR-Session-Orb-HTF High/LowThis indicator is built for intraday model execution around liquidity grabs, session timing, and higher-timeframe draw-on-liquidity. It maps out sessions, ICT killzones, Session opening ranges (including the US 09:30 cash open), a daily NY “TD Open” line (00:00 → NY close), and key highs/lows from higher timeframes directly onto any lower timeframe chart (down to 1 minute).
________________________________________
1. Sessions (Asia / London / New York)
• Highlights the 3 main sessions with colored boxes:
• Asia
• London
• New York
• Default session times are set in New York local time:
• Asia: 18:00–02:00
• London: 03:00–12:00
• New York: 08:00–17:00
• You can change these times in the settings.
• Each box automatically expands as the session progresses.
Why it matters: these windows show you where liquidity usually builds, where the day “hands off” from Asia → London → NY, and when expansion/displacement typically happens.
________________________________________
2. ICT Killzones
The script includes 4 configurable killzones (NY local by default):
• Asia late session: 20:00–00:00
• London killzone: 02:00–05:00
• New York AM: 07:00–10:00
• New York Midday: 10:00–12:00
For each killzone you can:
• toggle on/off
• adjust the time window
• pick colors
This makes it easy to see when price is trading inside a high-probability delivery period, so you can line it up with liquidity above/below the session or OR.
________________________________________
3. Opening Range Levels
The indicator captures the high and low of the first X minutes (default 15) of each important window and projects those levels as horizontal lines.
It does this for:
• Asia Open Range
• London Open Range
• New York Open Range (08:00)
• NY 09:30 Cash-Open Range
• (in the original idea: NY mid / second NY window)
Behavior:
• Asia OR → after the first X minutes of Asia, the high/low are projected across the rest of the trading day.
• London OR → taken from the London start, but extended only while London is active.
• NY OR (08:00) → taken from the start of the NY session and extended only during NY.
• NY 09:30 OR → this one is special. At exactly 09:30 (cash open) the script starts a second, independent OR for that day, using your chosen length (e.g. 15 minutes). When the window finishes, it freezes the 09:30 high and low and projects them horizontally all the way to the NY session end. You can style it separately (color, labels). This gives you a clean “cash-open dealing range” to watch for sweeps, fake-outs and continuations.
You can:
• choose the range length (1–60 minutes for 09:30, 1–30 for the others)
• show/hide each OR
• color each OR
• show labels such as “Asia OR High”, “Lon OR Low”, “NY 09:30 High”, etc.
• control line padding so labels don’t print on top of the candle
These ORs often become obvious liquidity pools, fail-break zones, or continuation triggers.
________________________________________
4. NY TD Open Line (Daily 00:00)
On every trading day the script also plots a “TD” structure for New York:
• at 00:00 NY time it draws a vertical dashed line to mark the day’s start
• it records that day’s open price
• it then projects a horizontal line from 00:00 → all the way to NY session close (default 17:00)
• the horizontal line is labeled e.g. “NY TD Open”
How to use it:
• see instantly where current price is vs the daily open
• combine with 09:30 OR to know if cash open is opening above/below the day’s open
• good for intraday bias (above = bullish day structure, below = bearish day structure)
• nice anchor when you go down to 1m/3m
You can toggle the TD feature on/off and change its colors.
________________________________________
5. Previous Week High / Low
• Plots last week’s high and low on any timeframe
• Drawn as dashed lines with padding (so they don’t run to infinity)
• Each level is labeled (default “PW High” / “PW Low”)
These are classic weekly liquidity magnets and very useful when London/NY is expanding into an old weekly extreme.
________________________________________
6. Monthly High / Low
The script plots both:
• Previous month high/low
• Current month high/low (live)
Defaults:
• previous month → dashed + purple
• current month → solid + blue
You can change:
• line colors
• label text & colors
• how far the line should extend (bars span)
This gives you higher-TF liquidity targets on your intraday chart without switching to M or W.
________________________________________
7. 4H High / Low (Intra-session Liquidity Map)
On timeframes up to 4H, the script also plots:
• previous 4H high/low
• current 4H high/low
Important design choice: they only live inside their own 4H window.
• the previous 4H range is shown only over the previous 4H time span
• the current 4H range is shown only over the current 4H candle
That means you don’t get messy, stretched 4H lines across the whole day — only where they actually apply. This is super useful for London/NY raids on 4H highs/lows.
________________________________________
8. Customization / Inputs
Almost everything is editable:
• session windows + colors
• killzone windows + colors
• opening-range length
• ON/OFF per OR (Asia, London, NY 08:00, NY 09:30)
• label text, size, bg color, text color
• HTF line length (weekly / monthly)
• TD 00:00 ON/OFF + colors
• line end padding so labels don’t sit on the right edge
The idea is to give you structure, not signals.
________________________________________
How to Use
1. Start from the monthly / weekly / previous week levels to see where price “wants” to go.
2. Drop into the active session box / killzone to know when to pay attention.
3. Trade around opening-range highs/lows — especially the NY 09:30 OR — and look for liquidity sweeps.
4. Check where price is relative to the NY TD Open (00:00) to confirm intraday bias.
5. Refine entries using the 4H highs/lows that fall inside that session.
Result: you get a top-down liquidity map + intraday timing tool, all on one chart.
________________________________________
Notes
• All times are interpreted in the chart/session timezone — keep your chart on NY session if you want the defaults to match the description.
• TradingView has drawing limits; on very low timeframes far back in history, old drawings may recycle.
• Because 09:30 and TD are drawn every day, it’s normal to see more labels the further right you scroll.
________________________________________
Disclaimer
This script is for educational and charting purposes only.
It does not generate trade signals, manage risk, or guarantee profitability.
Trading involves risk — always do your own analysis.
Special Thanks to Sabo & Hive Community
Nov 17
Release Notes
This indicator is built for intraday model execution around liquidity grabs, session timing, and higher-timeframe draw-on-liquidity. It maps out sessions, killzones, opening ranges (including the US 09:30 cash open), a daily NY “TD Open” line (00:00 → NY close), and key highs/lows from higher timeframes directly onto any lower timeframe chart (down to 1 minute).
________________________________________
1. Sessions (Asia / London / New York)
• Highlights the 3 main sessions with colored boxes:
• Asia
• London
• New York
• Default session times are set in New York local time:
• Asia: 18:00–02:00
• London: 03:00–12:00
• New York: 08:00–17:00
• You can change these times in the settings.
• Each box automatically expands as the session progresses.
Why it matters: these windows show you where liquidity usually builds, where the day “hands off” from Asia → London → NY, and when expansion/displacement typically happens.
________________________________________
2. ICT Killzones
The script includes 4 configurable killzones (NY local by default):
• Asia late session: 20:00–00:00
• London killzone: 02:00–05:00
• New York AM: 07:00–10:00
• New York Midday: 10:00–12:00
For each killzone you can:
• toggle on/off
• adjust the time window
• pick colors
This makes it easy to see when price is trading inside a high-probability delivery period, so you can line it up with liquidity above/below the session or OR.
________________________________________
3. Opening Range Levels
The indicator captures the high and low of the first X minutes (default 15) of each important window and projects those levels as horizontal lines.
It does this for:
• Asia Open Range
• London Open Range
• New York Open Range (08:00)
• NY 09:30 Cash-Open Range
• (in the original idea: NY mid / second NY window)
Behavior:
• Asia OR → after the first X minutes of Asia, the high/low are projected across the rest of the trading day.
• London OR → taken from the London start, but extended only while London is active.
• NY OR (08:00) → taken from the start of the NY session and extended only during NY.
• NY 09:30 OR → this one is special. At exactly 09:30 (cash open) the script starts a second, independent OR for that day, using your chosen length (e.g. 15 minutes). When the window finishes, it freezes the 09:30 high and low and projects them horizontally all the way to the NY session end. You can style it separately (color, labels). This gives you a clean “cash-open dealing range” to watch for sweeps, fake-outs and continuations.
You can:
• choose the range length (1–60 minutes for 09:30, 1–30 for the others)
• show/hide each OR
• color each OR
• show labels such as “Asia OR High”, “Lon OR Low”, “NY 09:30 High”, etc.
• control line padding so labels don’t print on top of the candle
These ORs often become obvious liquidity pools, fail-break zones, or continuation triggers.
________________________________________
4. NY TD Open Line (Daily 00:00)
On every trading day the script also plots a “TD” structure for New York:
• at 00:00 NY time it draws a vertical dashed line to mark the day’s start
• it records that day’s open price
• it then projects a horizontal line from 00:00 → all the way to NY session close (default 17:00)
• the horizontal line is labeled e.g. “NY TD Open”
How to use it:
• see instantly where current price is vs the daily open
• combine with 09:30 OR to know if cash open is opening above/below the day’s open
• good for intraday bias (above = bullish day structure, below = bearish day structure)
• nice anchor when you go down to 1m/3m
You can toggle the TD feature on/off and change its colors.
________________________________________
5. Previous Week High / Low
• Plots last week’s high and low on any timeframe
• Drawn as dashed lines with padding (so they don’t run to infinity)
• Each level is labeled (default “PW High” / “PW Low”)
These are classic weekly liquidity magnets and very useful when London/NY is expanding into an old weekly extreme.
________________________________________
6. Monthly High / Low
The script plots both:
• Previous month high/low
• Current month high/low (live)
Defaults:
• previous month → dashed + purple
• current month → solid + blue
You can change:
• line colors
• label text & colors
• how far the line should extend (bars span)
This gives you higher-TF liquidity targets on your intraday chart without switching to M or W.
________________________________________
7. 4H High / Low (Intra-session Liquidity Map)
On timeframes up to 4H, the script also plots:
• previous 4H high/low
• current 4H high/low
Important design choice: they only live inside their own 4H window.
• the previous 4H range is shown only over the previous 4H time span
• the current 4H range is shown only over the current 4H candle
That means you don’t get messy, stretched 4H lines across the whole day — only where they actually apply. This is super useful for London/NY raids on 4H highs/lows.
________________________________________
8. Customization / Inputs
Almost everything is editable:
• session windows + colors
• killzone windows + colors
• opening-range length
• ON/OFF per OR (Asia, London, NY 08:00, NY 09:30)
• label text, size, bg color, text color
• HTF line length (weekly / monthly)
• TD 00:00 ON/OFF + colors
• line end padding so labels don’t sit on the right edge
The idea is to give you structure, not signals.
________________________________________
How to Use
1. Start from the monthly / weekly / previous week levels to see where price “wants” to go.
2. Drop into the active session box / killzone to know when to pay attention.
3. Trade around opening-range highs/lows — especially the NY 09:30 OR — and look for liquidity sweeps.
4. Check where price is relative to the NY TD Open (00:00) to confirm intraday bias.
5. Refine entries using the 4H highs/lows that fall inside that session.
Result: you get a top-down liquidity map + intraday timing tool, all on one chart.
________________________________________
Notes
• All times are interpreted in the chart/session timezone — keep your chart on NY session if you want the defaults to match the description.
• TradingView has drawing limits; on very low timeframes far back in history, old drawings may recycle.
• Because 09:30 and TD are drawn every day, it’s normal to see more labels the further right you scroll.
________________________________________
Disclaimer
This script is for educational and charting purposes only.
It does not generate trade signals, manage risk, or guarantee profitability.
Trading involves risk — always do your own analysis.
Special Thanks to Sabo & Hive Community

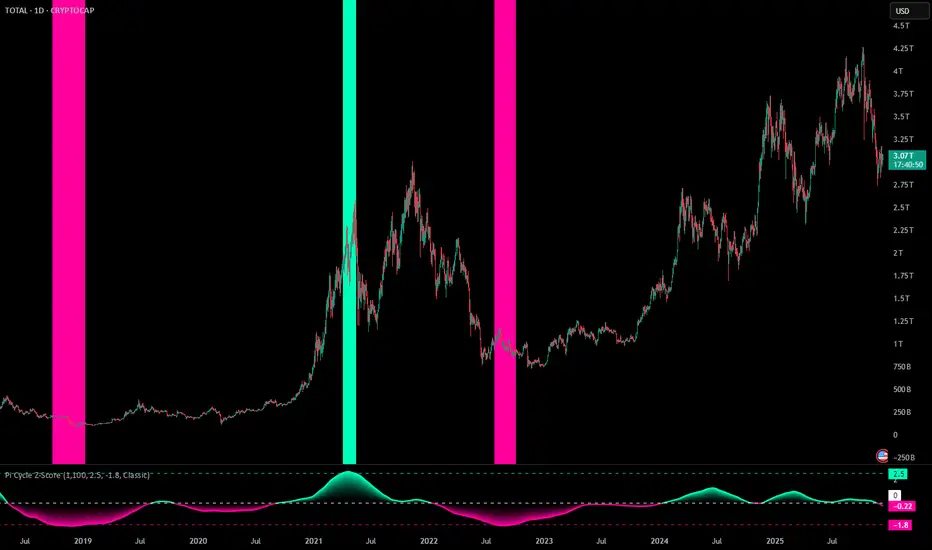
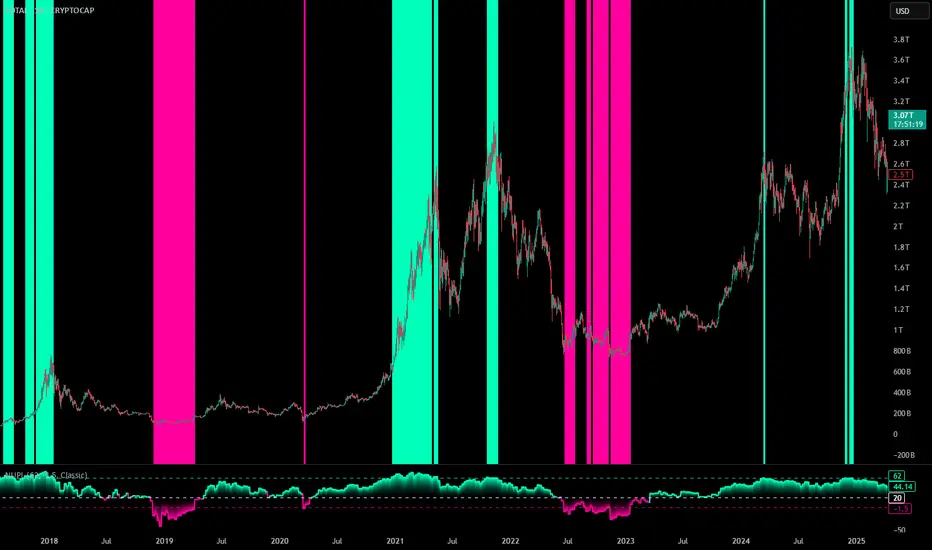
Pi Cycle Z-ScorePi Cycle Z-Score
The Pi Cycle Top Indicator uses the 111 day moving average (111DMA) and a newly created multiple of the 350 day moving average, the 350DMA x 2 (the multiple is of the price values of the 350DMA, not the number of days). For the past three market cycles, when the 111DMA moves up and crosses the 350DMA x 2 we see that it coincides with the price of Bitcoin peaking. It is also interesting to note that 350 / 111 is 3.153, which is very close to Pi = 3.142, thus the name. Z-score analysis has been conducted to provide traders with a precise tool for identifying market extremes and potential reversions.
This indicator is calibrated on a weekly timeframe in order to give precise top and bottom signals for each cycle.
Features
The script compares the Z-score with customizable threshold levels to generate overbought and oversold levels. A Z-score exceeding the upper threshold suggests potential overbought conditions, while a Z-score below the lower threshold may indicate oversold conditions.
This script offers several customizable inputs, enabling traders to tailor the indicator to their preferences. The length determines the lookback period that the Z-score is calculated over. Traders can also adjust the thresholds to define the sensitivity of overbought and oversold conditions.
It has 10 available color schemes to choose from and the background coloring on the chart can be toggled on and off.
Practical Applications
This indicator is designed for traders who focus on identifying cycle extremes and potential mean reversion opportunities. By using Z-score analysis, this tool can be particularly effective for detecting points of overextension in the market, where a reversion to the mean is likely.
Detecting Overbought and Oversold Conditions: The Z-score measures how far the price has deviated from its norm, allowing traders to identify overbought or oversold conditions with precision.
Timing Market Reversals: The indicator provides early signals of potential market reversals by highlighting when the price has moved too far away from its average, helping traders anticipate reversion opportunities.
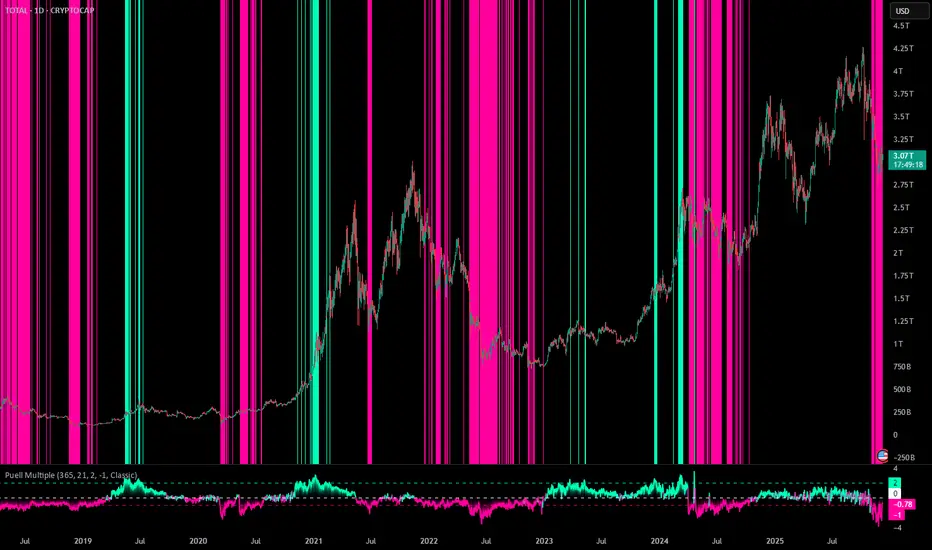
Puell Multiple Z-ScorePuell Multiple Z-Score
The Puell Multiple is calculated by dividing the total USD value of Bitcoin issued today (newly mined coins × BTC price) by the 365-day moving average of that daily issuance value. It shows how today's miner revenue compares to the past year's average. Z-score analysis has been conducted to provide traders with a precise tool for identifying market extremes and potential reversions.
This indicator is calibrated on a daily timeframe in order to give precise top and bottom signals for each cycle.
Features
The script compares the Z-score with customizable threshold levels to generate overbought and oversold levels. A Z-score exceeding the upper threshold suggests potential overbought conditions, while a Z-score below the lower threshold may indicate oversold conditions.
This script offers several customizable inputs, enabling traders to tailor the indicator to their preferences. The length determines the lookback period that the Z-score is calculated over. Traders can also adjust the thresholds to define the sensitivity of overbought and oversold conditions.
It has 10 available color schemes to choose from and the background coloring on the chart can be toggled on and off.
Practical Applications
This indicator is designed for traders who focus on identifying cycle extremes and potential mean reversion opportunities. By using Z-score analysis, this tool can be particularly effective for detecting points of overextension in the market, where a reversion to the mean is likely.
Detecting Overbought and Oversold Conditions: The Z-score measures how far the price has deviated from its norm, allowing traders to identify overbought or oversold conditions with precision.
Timing Market Reversals: The indicator provides early signals of potential market reversals by highlighting when the price has moved too far away from its average, helping traders anticipate reversion opportunities.

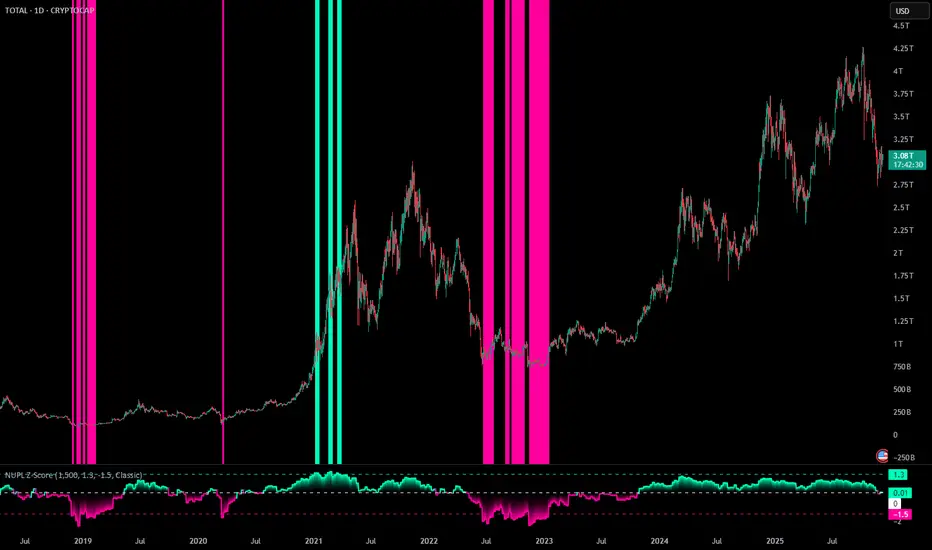
NUPL Z-ScoreNUPL Z-Score
The Net Unrealized Profit and Loss (NUPL) is an advanced on-chain indicator that is measured by subtracting the Realized Value from Market Value. Realized Value takes the price of each Bitcoin when it was last moved. It adds up all individual prices and takes an average. It multiplies that average price by the total number of coins in circulation. Market Value is the current price of Bitcoin multiplied by the number of coins in circulation. This gives us the NUPL which estimates the total paper profits/losses in Bitcoin held by investors. This indicator enhances this metric by normalizing it into a Z-score, and enabling customizable features for precision and visualization.
This indicator is calibrated on a weekly timeframe in order to give precise top and bottom signals for each cycle.
Features
The script compares the Z-score with customizable threshold levels to generate overbought and oversold levels. A Z-score exceeding the upper threshold suggests potential overbought conditions, while a Z-score below the lower threshold may indicate oversold conditions.
This script offers several customizable inputs, enabling traders to tailor the indicator to their preferences. The length determines the lookback period that the Z-score is calculated over. Traders can also adjust the thresholds to define the sensitivity of overbought and oversold conditions.
It has 10 available color schemes to choose from and the background coloring on the chart can be toggled on and off.
Practical Applications
This indicator is designed for traders who focus on identifying cycle extremes and potential mean reversion opportunities. By using Z-score analysis, this tool can be particularly effective for detecting points of overextension in the market, where a reversion to the mean is likely.
Detecting Overbought and Oversold Conditions: The Z-score measures how far the price has deviated from its norm, allowing traders to identify overbought or oversold conditions with precision.
Timing Market Reversals: The indicator provides early signals of potential market reversals by highlighting when the price has moved too far away from its average, helping traders anticipate reversion opportunities.
SOPR Z-ScoreSOPR Z-Score
The Spent Output Profit Ratio (SOPR) is an advanced on-chain indicator that measures the ratio between the combined USD value of all Bitcoin outputs spent on a given day and their combined USD value at the time of creation. SOPR offers a window into aggregate seller behavior, effectively representing the USD amount received by sellers divided by the USD amount they originally paid. This indicator enhances this metric by normalizing it into a Z-score, and enabling customizable features for precision and visualization.
This indicator is calibrated on a weekly timeframe in order to give precise top and bottom signals for each cycle.
Features
The script compares the Z-score with customizable threshold levels to generate overbought and oversold levels. A Z-score exceeding the upper threshold suggests potential overbought conditions, while a Z-score below the lower threshold may indicate oversold conditions.
This script offers several customizable inputs, enabling traders to tailor the indicator to their preferences. The length determines the lookback period that the Z-score is calculated over. Traders can also adjust the thresholds to define the sensitivity of overbought and oversold conditions.
It has 10 available color schemes to choose from and the background coloring on the chart can be toggled on and off.
Practical Applications
This indicator is designed for traders who focus on identifying cycle extremes and potential mean reversion opportunities. By using Z-score analysis, this tool can be particularly effective for detecting points of overextension in the market, where a reversion to the mean is likely.
Detecting Overbought and Oversold Conditions: The Z-score measures how far the price has deviated from its norm, allowing traders to identify overbought or oversold conditions with precision.
Timing Market Reversals: The indicator provides early signals of potential market reversals by highlighting when the price has moved too far away from its average, helping traders anticipate reversion opportunities.

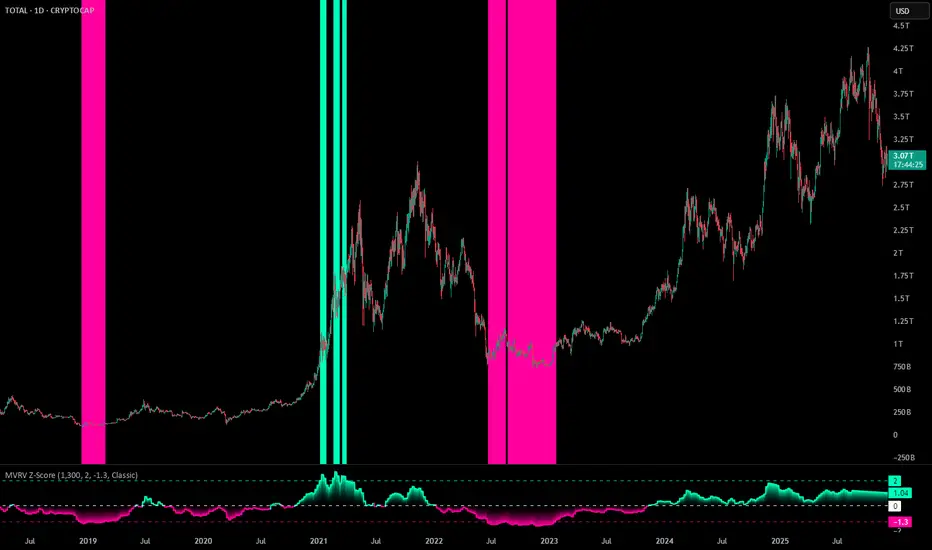
MVRV Z-ScoreMVRV Z-Score
The Market Value to Realized Value (MVRV) is an advanced on-chain indicator designed to assess the ratio between the Market Value and the Realized Value of Bitcoin.
Market Value is calculated as the current price of Bitcoin multiplied by its circulating supply and realized Value is derived by multiplying the realized price of Bitcoin (the price at which the coins last moved) by the circulating supply. It represents the total cost basis of all Bitcoin held.
Z-score analysis has been conducted to provide traders with a precise tool for identifying market extremes and potential reversions.
This indicator is calibrated on a weekly timeframe in order to give precise top and bottom signals for each cycle.
Features
The script compares the Z-score with customizable threshold levels to generate overbought and oversold levels. A Z-score exceeding the upper threshold suggests potential overbought conditions, while a Z-score below the lower threshold may indicate oversold conditions.
This script offers several customizable inputs, enabling traders to tailor the indicator to their preferences. The length determines the lookback period that the Z-score is calculated over. Traders can also adjust the thresholds to define the sensitivity of overbought and oversold conditions.
It has 10 available color schemes to choose from and the background coloring on the chart can be toggled on and off.
Practical Applications
This indicator is designed for traders who focus on identifying cycle extremes and potential mean reversion opportunities. By using Z-score analysis, this tool can be particularly effective for detecting points of overextension in the market, where a reversion to the mean is likely.
Detecting Overbought and Oversold Conditions: The Z-score measures how far the price has deviated from its norm, allowing traders to identify overbought or oversold conditions with precision.
Timing Market Reversals: The indicator provides early signals of potential market reversals by highlighting when the price has moved too far away from its average, helping traders anticipate reversion opportunities.
Pi CyclePi Cycle
The Pi Cycle Top Indicator uses the 111 day moving average (111DMA) and a newly created multiple of the 350 day moving average, the 350DMA x 2 (the multiple is of the price values of the 350DMA, not the number of days). For the past three market cycles, when the 111DMA moves up and crosses the 350DMA x 2 we see that it coincides with the price of Bitcoin peaking. It is also interesting to note that 350 / 111 is 3.153, which is very close to Pi = 3.142, thus the name.
Features
This script offers several customizable inputs, enabling traders to tailor the indicator to their preferences. Traders can adjust the thresholds to define the sensitivity of overbought and oversold conditions.
It has 10 available color schemes to choose from and the background coloring on the chart can be toggled on and off.
Practical Applications
This indicator is designed for traders who focus on identifying cycle extremes and potential mean reversion opportunities.
Detecting Overbought and Oversold Conditions: The indicator measures how far the price has deviated from its norm, allowing traders to identify overbought or oversold conditions with precision.
Timing Market Reversals: The indicator provides early signals of potential market reversals by highlighting when the price has moved too far away from its average, helping traders anticipate reversion opportunities

IndiabizlistFX Scalper 1.0the detailed description will be updated soon
basically an indicator with customized settings for reversal trading, i am currently updating it, with the dashboard, it will be updated soon

Puell MultiplePuell Multiple
The Puell Multiple is calculated by dividing the total USD value of Bitcoin issued today (newly mined coins × BTC price) by the 365-day moving average of that daily issuance value. It shows how today's miner revenue compares to the past year's average.
Features
This script offers several customizable inputs, enabling traders to tailor the indicator to their preferences. Traders can adjust the thresholds to define the sensitivity of overbought and oversold conditions.
It has 10 available color schemes to choose from and the background coloring on the chart can be toggled on and off.
Practical Applications
This indicator is designed for traders who focus on identifying cycle extremes and potential mean reversion opportunities.
Detecting Overbought and Oversold Conditions: The indicator measures how far the price has deviated from its norm, allowing traders to identify overbought or oversold conditions with precision.
Timing Market Reversals: The indicator provides early signals of potential market reversals by highlighting when the price has moved too far away from its average, helping traders anticipate reversion opportunities.
Trend Finder - Buy/Sell (Anuj Edition)Renko Trend Finder – Anuj Edition is a powerful trend-following tool designed to detect market direction using Renko logic instead of traditional candlesticks.
Renko filtering removes market noise, making trends clearer and reversals easier to identify.
This indicator internally builds Renko-style price movement and generates clean, high-quality Buy and Sell signals without repainting.

NUPLNUPL
The Net Unrealized Profit and Loss (NUPL) is an advanced on-chain indicator that is measured by subtracting the Realized Value from Market Value. Realized Value takes the price of each Bitcoin when it was last moved. It adds up all individual prices and takes an average. It multiplies that average price by the total number of coins in circulation. Market Value is the current price of Bitcoin multiplied by the number of coins in circulation. This gives us the NUPL which estimates the total paper profits/losses in Bitcoin held by investors.
Features
This script offers several customizable inputs, enabling traders to tailor the indicator to their preferences. Traders can also adjust the thresholds to define the sensitivity of overbought and oversold conditions.
It has 10 available color schemes to choose from and the background coloring on the chart can be toggled on and off.
Practical Applications
This indicator is designed for traders who focus on identifying cycle extremes and potential mean reversion opportunities.
Detecting Overbought and Oversold Conditions: The indicator measures how far the price has deviated from its norm, allowing traders to identify overbought or oversold conditions with precision.
Timing Market Reversals: The indicator provides early signals of potential market reversals by highlighting when the price has moved too far away from its average, helping traders anticipate reversion opportunities.
SOPRSOPR
The Spent Output Profit Ratio (SOPR) is an advanced on-chain indicator that measures the ratio between the combined USD value of all Bitcoin outputs spent on a given day and their combined USD value at the time of creation. SOPR offers a window into aggregate seller behavior, effectively representing the USD amount received by sellers divided by the USD amount they originally paid.
Features
This script offers several customizable inputs, enabling traders to tailor the indicator to their preferences. Traders can adjust the thresholds to define the sensitivity of overbought and oversold conditions.
It has 10 available color schemes to choose from and the background coloring on the chart can be toggled on and off.
Practical Applications
This indicator is designed for traders who focus on identifying cycle extremes and potential mean reversion opportunities.
Detecting Overbought and Oversold Conditions: The indicator measures how far the price has deviated from its norm, allowing traders to identify overbought or oversold conditions with precision.
Timing Market Reversals: The indicator provides early signals of potential market reversals by highlighting when the price has moved too far away from its average, helping traders anticipate reversion opportunities.

Trend Finder - Buy/Sell (Anuj Edition)Renko Trend Finder – Anuj Edition is a powerful trend-following tool designed to detect market direction using Renko logic instead of traditional candlesticks.
Renko filtering removes market noise, making trends clearer and reversals easier to identify.
This indicator internally builds Renko-style price movement and generates clean, high-quality Buy and Sell signals without repainting.

MVRVMVRV
The Market Value to Realized Value (MVRV) is an advanced on-chain indicator designed to assess the ratio between the Market Value and the Realized Value of Bitcoin.
Market Value is calculated as the current price of Bitcoin multiplied by its circulating supply and realized Value is derived by multiplying the realized price of Bitcoin (the price at which the coins last moved) by the circulating supply. It represents the total cost basis of all Bitcoin held.
Features
This script offers several customizable inputs, enabling traders to tailor the indicator to their preferences. Traders can also adjust the thresholds to define the sensitivity of overbought and oversold conditions.
It has 10 available color schemes to choose from and the background coloring on the chart can be toggled on and off.
Practical Applications
This indicator is designed for traders who focus on identifying cycle extremes and potential mean reversion opportunities.
Detecting Overbought and Oversold Conditions: The indicator measures how far the price has deviated from its norm, allowing traders to identify overbought or oversold conditions with precision.
Timing Market Reversals: The indicator provides early signals of potential market reversals by highlighting when the price has moved too far away from its average, helping traders anticipate reversion opportunities.

Brahmastra Basic1. Core Purpose and Strategy
This is a multi-timeframe (MTF) indicator designed to identify high-probability entry points for a specific trend-following options selling strategy. It works by confirming a trend on higher timeframes (Daily and Hourly) before waiting for a precise entry trigger on a lower timeframe (15-Minute).
The core principle is confluence: ensuring that the Daily trend bias and the Hourly trend momentum are aligned before looking for a trade. This filters out many false signals that can occur when trading on a single timeframe.
IMPORTANT: This indicator MUST be applied to a 15-minute chart to function correctly.
2. How to Read the Visual Signals on Your Chart
The indicator provides several visual cues to guide you through the trading setup from start to finish.
A. Candle Colors: The "Setup is Ready" Signal
The primary signal to start paying attention is the change in candle color.
Aqua Candles: The market is in a Bullish Alignment. This means both the Daily and Hourly trends are bullish. You should now be preparing for a Put Sell entry. The very first aqua candle in a sequence is your "alert candle."
Yellow Candles: The market is in a Bearish Alignment. This means both the Daily and Hourly trends are bearish. You should now be preparing for a Call Sell entry. The very first yellow candle in a sequence is your "alert candle."
B. Entry Signals: The "Execute Trade" Signal
These signals appear only after the alert candle's level has been breached.
Green "PUT SELL" Label (below candle): This is your signal to enter a Put Sell (or a long position). It appears on the close of the 15-minute candle that breaks above the high of the first aqua alert candle.
Red "CALL SELL" Label (above candle): This is your signal to enter a Call Sell (or a short position). It appears on the close of the 15-minute candle that breaks below the low of the first yellow alert candle.
C. Exit Signals: The "Close Position" Signal
Red 'X' (above candle): This is the signal to close your Put Sell position. It appears when the primary daily trend has reversed to bearish.
Green 'X' (below candle): This is the signal to close your Call Sell position. It appears when the primary daily trend has reversed to bullish.
D. Background & EMA Lines: The "Context"
EMA Lines: The indicator plots two key EMAs from the higher timeframes onto your 15-minute chart so you can see the context.
Orange Line: Daily 5 EMA
Blue Line: Hourly 51 EMA
Faint Background Color: After an entry signal appears, the background will remain faintly colored (green for a bullish trade, red for a bearish trade) to remind you that you are in a hypothetical position.
3. The Step-by-Step Strategy Logic
Here is the precise set of rules the indicator follows to generate its signals:
For a PUT Sell (Bullish Trade):
Alignment Check: The indicator first confirms that:
The Daily Close is above the Daily 5 EMA.
AND the Hourly Close is above the Hourly 51 EMA.
Alert Phase: As soon as this alignment is true, the 15-minute candles turn aqua. The indicator internally notes the high of the very first aqua candle.
Entry Trigger: The indicator waits for a 15-minute candle to close above the high of that first alert candle. When this happens, the green "PUT SELL" label is plotted.
Exit Condition: The position is held until the Daily Close crosses back below the Daily 5 EMA. When this happens, the red 'X' exit signal is plotted.
For a CALL Sell (Bearish Trade):
Alignment Check: The indicator first confirms that:
The Daily Close is below the Daily 5 EMA.
AND the Hourly Close is below the Hourly 51 EMA.
Alert Phase: As soon as this alignment is true, the 15-minute candles turn yellow. The indicator internally notes the low of the very first yellow candle.
Entry Trigger: The indicator waits for a 15-minute candle to close below the low of that first alert candle. When this happens, the red "CALL SELL" label is plotted.
Exit Condition: The position is held until the Daily Close crosses back above the Daily 5 EMA. When this happens, the green 'X' exit signal is plotted.

MTF Fractal Manifold Support & Resistance Pro [Voidspire]Welcome to MTF Fractal Manifold Support & Resistance Pro. This is not a standard pivot point or zigzag indicator. This tool utilizes Topological Data Analysis (TDA) and Quantitative Physics concepts to treat price action as a high-dimensional manifold.
By applying Lorentzian Kernel Clustering and the Expectation-Maximization (EM) algorithm, the script identifies "High Energy" singularity points where price, time, and volatility (mass) converge. It distinguishes between significant structural levels and random market noise using Shannon Entropy Z-Scores.
🧠 Key Features
⚛️ Physics-Based Clustering: Instead of simple highs/lows, we calculate the "Mass" of a price level based on Tick Volume (Forex) or Real Volume (Equities) and Volatility.
📐 6-Dimensional Analysis: Monitors 6 different timeframes simultaneously (Micro, Meso, and Macro layers) to find Fractal resonance.
📊 Hurst Exponent Integration: Automatically detects whether the market is trending or mean-reverting (ranging) to adjust the search radius (Gamma) of the clusters dynamically.
🧪 Entropy Z-Score: Each level is assigned a Z-Score. Low scores (Green) indicate highly ordered, stable support. High scores (Red) indicate chaotic, unstable zones.
🔥 Topological Confluence Zones: When multiple timeframe levels overlap, they merge into high-probability "Heatmap Boxes," signaling major reversal or breakout zones.
🔥 This indicator does not use future functions and will not be repaint.
⚙️ Comprehensive Settings Guide
This script is highly customizable to fit any asset class (Crypto, Forex, Stocks, Indices).
1. Algorithm Settings (Core)
Asset Class Model:
Forex/Synthetic: Uses Tick Volume + Volatility to calculate Mass.
Equities: Uses Real Volume.
Pure Price: Uses pure geometry (Suitable for assets where accurate trading volume information is not available).
Fractal Gamma Sensitivity: Controls the "focus" of the clustering. Higher values detect finer, more local structures; lower values find broader, major structures.
Entropy Lookback: The historical window used to calculate the Z-Score statistics.
2. Manifold Layer Configuration (Layers 1-6)
You have control over 6 distinct timeframe layers.
Enable/Timeframe: Choose which timeframes to analyze (e.g., 15m, 1H, 4H, Daily).
K-Centers: How many support/resistance clusters to find on this specific timeframe.
Sample Size: How far back in history to analyze data for this layer.
3. Topological Confluence (The Heatmap)
Show High-Energy Confluence: Enables the drawing of rectangular zones where levels overlap.
Merge Threshold %: The distance required to merge two levels into a single zone.
Bullish/Bearish Heatmap: Custom colors for Support (Bullish) and Resistance (Bearish) zones.
4. Dynamic Visibility Control
Hide Micro/Meso Layer: Automatically hides lower timeframe levels when you zoom out to higher timeframes (e.g., hide 15m levels when looking at the Weekly chart) to keep your chart clean.
5. UI & Visual Interaction
Confluence Breakout Threshold: The percentage price must move beyond a zone to confirm a breakout signal.
Zone Transparency: Adjusts the alpha channel of the confluence boxes.
Label Size: Customize the text size of the energy/entropy data labels.
Show Dashboard: Toggles the stats panel.
Show Midline: Toggles the median line inside confluence zones.
6. Layer Coloring & Alerts
Layer Colors: Set unique colors for all 6 layers (Micro, Meso, Macro) to visually decode timeframe hierarchy.
Ghost Extension Transparency: Adjust the visibility of the dotted lines that project the support levels into the future.
Alerts: Configure custom messages for bullish breakouts or bearish breakdowns. Supports variables {ticker} and {price}.
Disclaimer
Trading involves substantial risk and is not suitable for every investor. This indicator is a tool for technical analysis and does not constitute financial advice. Past performance does not guarantee future results. Always use proper risk management.
------------------------------------
中文介绍
机构级市场支撑阻力分析系统
欢迎使用多时间框架高维流形支撑阻力分析系统。这不仅仅是一个普通的枢轴点或 Zigzag 指标。本脚本利用 拓扑数据分析 (TDA) 和 量化物理学 概念,将价格行为视为一个高维流形进行建模。
通过应用 洛伦兹核聚类 (Lorentzian Kernel Clustering) 和 期望最大化 (EM) 算法,该脚本能够识别价格、时间和波动率(质量)汇聚的“高能奇点”。同时,结合 香农熵 Z-Score (Shannon Entropy Z-Scores),它可以有效区分关键的市场结构位和随机的市场噪音。
🧠 核心特性
⚛️ 物理驱动聚类: 我们不单纯依赖高低点,而是根据 Tick 量(外汇)或真实成交量(股票)结合波动率来计算价格水平的“质量 (Mass)”。
📐 6维流形分析: 同时监控 6 个不同的时间周期(微观、中观、宏观层级),寻找分形共振。
📊 赫斯特指数 (Hurst Exponent): 自动检测市场是处于趋势状态还是均值回归(震荡)状态,并据此动态调整聚类算法的搜索半径 (Gamma)。
🧪 熵值 Z-Score: 每个支撑位都有一个 Z分数。低分(绿色)代表高度有序、稳固的支撑;高分(红色)代表混沌、不稳定的区域。
🔥 拓扑共振区: 当多个时间周期的水平位重叠时,它们会合并成高概率的“热力图箱体 (Heatmap Boxes)”,这通常是反转或突破的关键区域。
🔥该指标不使用未来函数,也不会重绘。
⚙️ 全面的参数设置指南
本脚本高度可定制,适用于任何资产类别(加密货币、外汇、股票、指数)。
1. Algorithm Settings (核心算法设置)
Asset Class Model (资产模型):
Forex/Synthetic: 使用 Tick 量 + 波动率计算质量。
Equities: 使用真实成交量。
Pure Price: 纯几何计算(适用于不能获取准确成交量信息的资产)。
Fractal Gamma Sensitivity (分形敏感度): 控制聚类的“焦点”。数值越高,生成的结构越精细;数值越低,寻找的结构越宏观。
Entropy Lookback: 计算熵值 Z-Score 统计数据的历史样本窗口大小。
2. Manifold Layer Configuration (流形层级 1-6)
您可以控制 6 个独立的时间框架层级。
Enable/Timeframe: 选择要分析的时间周期(例如:15分钟、1小时、4小时、日线)。
K-Centers: 在该时间周期上寻找多少个支撑/阻力聚类中心。
Sample Size: 分析该层级多少根历史 K 线的数据。
3. Topological Confluence (拓扑共振/热力图)
Show High-Energy Confluence: 开启后,将重叠的水平位显示为矩形区域。
Merge Threshold %: 将两个临近水平位合并为一个区域的距离阈值。
Bullish/Bearish Heatmap: 自定义支撑区(看涨)和阻力区(看跌)的颜色。
4. Dynamic Visibility Control (动态可视性)
Hide Micro/Meso Layer: 当您切换到大周期图表时,自动隐藏小周期的线条,保持图表整洁。
5. UI & Visual Interaction (UI 与交互)
Confluence Breakout Threshold: 价格必须突破区域宽度的百分之多少才被确认为突破信号。
Zone Transparency: 调整共振区箱体的透明度。
Label Size: 自定义能量/熵值数据标签的字体大小。
Show Dashboard: 显示/隐藏统计面板。
Show Midline: 显示/隐藏共振区内部的中轴线。
6. Layer Coloring & Alerts (着色与警报)
Layer Colors: 为所有 6 个层级设置不同的颜色,以便直观区分微观、中观和宏观结构。
Ghost Extension Transparency: 调整向右延伸的预测虚线的透明度。
Alerts: 配置看涨突破或看跌跌破的自定义警报消息。支持变量 {ticker} 和 {price}。
免责声明
交易涉及巨大风险,并不适合所有投资者。该指标仅供技术分析辅助使用,不构成任何财务建议。过往的表现并不能保证未来的结果。请务必做好风险管理。

n-Day Stock Return with MAs and SlopesThis indicator calculates the n-day percentage return of a stock and visualizes it either as a histogram or line, with optional moving averages (MA1 and MA2) of the return and their slopes. The script highlights trend changes in the slopes of these moving averages by drawing colored horizontal markers at each reversal point—green for upward slope shifts, red for downward shifts, and gray when the slope turns flat—allowing users to quickly identify strengthening, weakening, or neutral return trends over time. It also includes optional slope plots for additional trend context and a zero reference line for distinguishing positive and negative performance.

Paradox CyclesParadox Cycles is a comprehensive market timing indicator that helps traders visualize key trading time-cycles throughout the trading day. Designed for intraday trading on timeframe 15 minutes and below.
