SCOTTGO - Buy Sell Volume📊 SCOTTGO - Buy Sell Volume Bars - Delta - Up Down Volume Bars
This indicator disaggregates the total volume traded on each bar into estimated Buying Volume and Selling Volume to visualize market pressure and dominance directly in a dedicated sub-pane.
Key Features:
Volume Disaggregation: Uses a standard formula to estimate how much of a bar's total volume was associated with upward (buying) pressure and how much was associated with downward (selling) pressure.
Visual Clarity: Plots the Buy Volume (teal, upward) and Sell Volume (red, downward) as separate columns against a transparent total volume background, allowing for quick assessment of pressure balance.
Real-Time Badge: A dynamic badge is fixed to the corner of the chart (default: Top Right) providing a numeric summary of the latest bar:
Buy %: Percentage of the bar's total volume estimated as Buying Volume.
Sell %: Percentage of the bar's total volume estimated as Selling Volume.
Delta %: The magnitude of the volume difference (Delta) as a percentage of total volume, indicating the strength of the dominant side.
Dominance Indicator: The background color of the badge changes dynamically to immediately signal whether Buying (customizable color, default: Teal) or Selling (customizable color, default: Red) pressure was dominant on the current bar.
Usage:
Traders can use this tool to identify periods of heavy accumulation (high Buy Volume) or distribution (high Sell Volume), providing insight into the conviction behind price movements.
Indicadores e estratégias

225 SMA CrossoverWell-known strategy from Zahlengraf from the Mauerstrassenwetten subreddit for you to test yourself.
You can change the length of the SMA and whether to trade long, short or both directions.

Pivot Points High LowGaneshA Pivot Points High/Low indicator that:
Detects swing highs (ta.pivothigh) and swing lows (ta.pivotlow) using configurable left/right bar lengths.
Draws labels at the confirmed pivot points:
Down labels at pivot highs (potential resistance).
Up labels at pivot lows (potential support).
Lets you customize text color and label fill color separately for highs and lows.
It’s designed for overlay (on-price chart), with max_labels_count=500 to allow many labels.

GMMA fill (v5) + Golden Crossover HighlightsGMMA Fill (v5) + Golden Crossover Highlights
This setup combines the Guppy Multiple Moving Average (GMMA) Fill version 5 with Golden Crossover signals to identify strong trend continuation and potential breakout points. GMMA provides layered moving averages for short- and long-term trend analysis, while the Golden Crossover highlights bullish momentum shifts, making it ideal for spotting entry opportunities in trending markets.

All-in-One Momentum Composite The Four Components (and Why They're Chosen)
RSI (Relative Strength Index) – Classic overbought/oversold oscillator (14-period default). Measures speed and change of price movements.
Stochastic (%D line) – Smoothened momentum indicator that compares closing price to the price range over a period. Excellent at spotting reversals in ranging markets.
WaveTrend – Very popular in crypto and forex communities (originally by LazyBear). It’s essentially a momentum oscillator based on overbought/oversold channels, similar to a faster, smoother RSI/Stochastic hybrid. Known for early divergence signals and clean crossovers.
MACD Histogram – Captures momentum changes and trend strength via the difference between fast and slow EMAs. The histogram shows acceleration/deceleration.

H1 Bias Rhythmic Lite Public V1.0 by SRTH1 Bias Rhythmic Lite Public V1.0 by SRT
Version: 1.0 (Public Lite)
Author: SRT
Platform: TradingView / Pine Script v6
Overlay: Yes (works directly on price chart)
Purpose: Provide H1 directional bias with D1 alignment and basic rhythm signals. Perfect for traders looking for clean bias visualization without clutter.
💡 Key Features
H1 Bias (Primary Engine)
Uses EMA7, EMA40, SMA150, and SMA200 for H1 directional bias.
Clearly identifies bullish, bearish, and neutral conditions.
Stack-based logic ensures consistency and reliability.
D1 Bias Alignment
Pulls higher timeframe (daily) EMA40, SMA150, SMA200.
Confirms H1 bias alignment with daily trend.
Helps filter trades in the direction of the larger trend.
Flush Detection
H1 flushes: Price fully “flushed” beyond EMA7 for bullish/bearish setups.
D+H1 flush: Aligns H1 flush with D1 bias for stronger context.
Visual dots with configurable sizes and colors indicate flush levels.
Price Action Signals
Engulfing (EB) detection with ATR filtering and body % thresholds.
Long Tail Body (LTB) detection with optional body % filter for precise swing points.
Both EB and LTB signals show clear labels above/below the candle for instant recognition.
ATR-Based Dynamic Offsets
Uses ATR (configurable length) to scale labels and flush dot offsets dynamically.
Ensures signals are proportionate to volatility.
Daily Pivot & Session Lines
Daily pivot plotted automatically.
Option to show daily session high-low lines and day labels.
Easily configurable label sizes and colors.
Bias Summary Table
Top-right table shows:
D1 bias
H1 bias
LTB allowed (Yes/No)
Color-coded for easy reference: green = Bull, red = Bear, gray = Neutral.
Alerts
H1 flush and D+H1 flush alerts.
LTB active alerts when bias is aligned.
Perfect for keeping an eye on actionable swings.
⚙️ User Inputs
Moving Average Lengths: EMA7, EMA40, SMA150, SMA200
Show/Hide MAs: Toggle to declutter the chart
ATR Settings: Length and % threshold for EB/LTB sizing
Signal Toggles: Show/Hide EBull, EBear, LTB Bull, LTB Bear, Flush Dots
Daily Pivot & Label Settings: Toggle visibility, label size, line/text colors
✅ Advantages for Users
Lightweight and fast — minimal lag on H1 charts.
Clear visualization of market bias and swing points.
Free access to core H1 Bias Rhythmic methodology.
Serves as a learning tool for traders who want to upgrade later.
⚠️ Limitations
No automatic entries, stops, or take profits (manual trade execution required).
Lite version only offers simplified signals and bias visualization.
Advanced rhythm and multi-timeframe alerts are reserved for the Premium version.
📢 Short Promo for Premium
For traders who want full power, check out H1 Bias Rhythmic Premium V1.0 by SRT — complete multi-phase alerts, advanced LTB & EB filters, EMA/SMA flip confirmations, and professional-level rhythm signals. Upgrade to premium for the full H1 trading experience.

Opposite Candle Zone Identifier (v6) - Extended🔍 Opposite Candle Zone Identifier (Extended)
Opposite Candle Zone Identifier is a price-action based indicator designed to identify potential reversal or absorption zones by detecting candles that move against the surrounding trend.
The indicator highlights a central opposite candle (or group of candles) that is surrounded by candles moving in the opposite direction, both before and after the central candle.
This structure often represents areas where institutional activity, absorption, or supply/demand imbalance may occur.
📌 How the Indicator Works
The indicator analyzes price action using three configurable blocks:
1️⃣ Candles Before (Backward)
A user-defined number of candles before the central candle(s) must follow a consistent trend:
Bullish candles for a bearish zone
Bearish candles for a bullish zone
2️⃣ Central Candle(s)
The core of the pattern:
Default: 1 opposite candle
Can be increased (up to 5) to adapt the indicator to lower timeframes or noisier markets
This central block must move against the previous trend, signaling a potential shift or absorption area.
3️⃣ Candles After (Forward)
A user-defined number of candles after the central candle(s) must resume the original trend, confirming the pattern.
⚠️ The signal is confirmed only after the “after” candles are completed.
This avoids repainting and ensures structural confirmation.
📐 Zone Concept
The highlighted central candle (or candles) can be used to define a price zone:
The high and low of the central candle(s) represent a potential supply or demand zone
These zones can be used for:
Reversal areas
Reaction zones
Entry refinement
Stop placement
⚙️ Inputs & Customization
Number of candles before
Controls how many candles must follow the initial trend.
Number of candles after
Defines how many candles are required for confirmation.
Central candles count
Default is 1, but can be increased (e.g. 2) for:
Lower timeframes
More reliable structure
Reduced noise
ATR-based offset
Labels are positioned using a dynamic ATR offset to improve chart readability across different markets and timeframes.
📈 Bullish & Bearish Zones
🟢 Bullish Zone
Bearish candles before
Bullish central candle(s)
Bearish candles after
Indicates potential demand or accumulation zone
🔴 Bearish Zone
Bullish candles before
Bearish central candle(s)
Bullish candles after
Indicates potential supply or distribution zone
🧠 Best Use Cases
Works best on 15m and higher timeframes
Effective on:
Indices
Forex majors
Liquid cryptocurrencies
Can be combined with:
Trend filters (EMA, VWAP)
Support & resistance
Market structure analysis
⚠️ Notes
This indicator is confirmation-based, not predictive
Signals appear only after pattern completion
It does not repaint
Best used as a confluence tool, not as a standalone trading system
🎯 Summary
Opposite Candle Zone Identifier helps traders:
Detect opposite-direction candles within strong trends
Identify potential supply and demand zones
Adapt the pattern to different timeframes
Improve price-action based decision making

FMT_TRENDFOLLOWiNGThis indicator is developed based on the Average Directional Index (ADX) , which is used to measure the strength of a trend, regardless of price direction. It has been custom-modified and optimized specifically for the FCPO market, with the following usage structure:
• 30-Minute Timeframe (HTF)
Used to identify the major market movement.
When the ADX value is above 25, it indicates that the market is entering a strong trending phase.
• 5-Minute Timeframe (LTF)
Acts as a confirmation for trend change or continuation, indicated by color changes (Green/Red) and the appearance of a Reconnect Dot when momentum becomes active again.
• 1-Minute Timeframe
Used for Buy or Sell entries at the nearest trading zones, aligned with the trend direction and strength from higher timeframes.
This indicator is suitable for Day Trading and Momentum Trading strategies, especially for FCPO traders who focus on market structure and momentum confirmation.
⚠️ DISCLAIMER: This indicator is provided for educational and technical analysis purposes only and does not constitute financial advice or a trading recommendation. All signals are derived from technical calculations and may produce false signals depending on market conditions. Users are fully responsible for their trading decisions, including risk management and position sizing. Past performance does not guarantee future results, and users are encouraged to conduct paper trading or backtesting before using it in live trading.

XAU Multi-Timeframe Market Context FrameworkOverview
XAU Multi-Timeframe Market Context Framework is designed as a visual market structure and environment analysis framework.
It focuses on providing contextual awareness, structural alignment, and volatility conditions across multiple timeframes, rather than generating trade signals.
This script is intended for traders who already operate with their own execution logic and wish to enhance market reading and risk context visualization.
Methodology Overview
This script identifies market structure by detecting relative swing highs and lows, which are projected as extended structural reference levels.
Multi-timeframe context is derived by comparing price positioning and directional bias across predefined timeframes (15m, 30m, 1H, 4H, 1D).
Market environment conditions are evaluated using a combination of price momentum behavior, volume participation, and ATR-based volatility regimes.
These components are integrated into a unified framework for observing overall market context and structural conditions.
The script does not provide entry or exit rules and is intended solely for contextual market analysis.
Core Components
LLR Structure Levels (current + previous)
Swing-based structural reference levels projected to visualize recent market structure transitions.
Multi-Timeframe Context Engine
Directional and positional alignment across 15m / 30m / 1H / 4H / 1D timeframes.
Market Environment Classification
Contextual evaluation using momentum behavior, volume participation, and ATR volatility ranges.
Structural State Markers (Normal / Strong)
Visual state markers derived from the interaction of structure, momentum, and volatility.
(These are environment states, not trade signals.)
Volatility-Based Projection Zones (TP1 / TP2 / TP3)
ATR-derived reference zones used purely for visual context when observing potential price extension behavior.
Risk Framework Visualization
Dynamic stop reference ranges and ATR-based trailing behavior for contextual risk visualization.
Market State Summary Panel
Consolidated view of trend, pullback, and no-trade environments.
Exit Context Panel
Distance, percentage movement, and R-multiple visualization relative to a user-defined entry reference.
User Interface Language Note
Some input labels and on-chart texts are displayed in Chinese.
An English explanation of these inputs and visual elements is provided below for reference.
LLR Left Length: Defines the number of bars used to evaluate swing structure on the left side.
LLR Right Buffer: Defines the number of bars reserved on the right side to confirm structural points.
Disclaimer
This script provides visual market structure and market environment analysis only.
It does not include strategy logic, trade execution rules, recommendations, or educational content.
中文說明(補充)
本腳本為一套多週期市場結構與環境分析框架,
透過擺動高低點辨識結構位置,並比較不同時間週期的價格相對位置,
結合動能、量能與 ATR 波動區間,用於觀察市場情境與風險結構。
本工具僅提供視覺化分析,不構成任何交易建議或操作指引。

JK Scalp - Nishith RajwarJK Scalp Nishith Rajwar
Multi-Stochastic Rotation & Momentum Scalping Framework
JK Scalp is a rule-based momentum and rotation oscillator designed for short-term scalping and intraday execution.
It focuses on how momentum rotates across multiple stochastic speeds, instead of relying on a single oscillator or lagging averages.
This is an execution aid, not a predictive indicator.
🧠 Concept & Originality
Unlike standard stochastic tools, JK Scalp uses four synchronized stochastic layers:
• Fast (9,3) → execution timing
• Medium (14,3) → structure confirmation
• Slow (44,3) → swing context
• Trend (60,10,10) → dominant momentum regime
The core idea is quad-rotation:
High-probability trades occur when all momentum layers rotate together after reaching an extreme.
This script combines:
• Momentum rotation
• Divergence logic
• Flag continuation logic
• Trend-state filtering
into a single cohesive framework, not a simple indicator mashup.
📊 How to Use (Step-by-Step)
1️⃣ Best Timeframes
• Scalping: 1m – 3m
• Intraday: 5m – 15m
• Avoid higher timeframes (not designed for swing holding)
Works best on:
• Index options
• Index futures
• Highly liquid stocks
• Crypto majors
2️⃣ Understanding the Signals
🔁 Quad Rotation (Core Signal)
A valid rotation requires:
• Fast, Medium, Slow, and Trend stochastic moving in the same direction
• Momentum exiting Overbought / Oversold zones
• Trend stochastic supporting the move
This filters out random oscillator noise.
3️⃣ Entry Conditions
🟢 LONG Setup
• Bullish quad rotation
• Either:
– Bullish divergence OR
– Bullish flag pullback
• Fast stochastic turning up
🔴 SHORT Setup
• Bearish quad rotation
• Either:
– Bearish divergence OR
– Bearish flag pullback
• Fast stochastic turning down
⚠️ Signals are confirmation-based, not anticipatory.
4️⃣ SUPER LONG / SUPER SHORT
These appear only when:
• Quad rotation
• Divergence confirmation
They represent high-confidence momentum inflection zones, not guaranteed reversals.
5️⃣ Stop-Loss Visualization
Optional SL zones are plotted using:
• Recent swing high / low
• ATR-based buffer (configurable)
This helps traders visualize risk, not automate exits.
🎨 Visual System (Why It Looks Different)
• Multi-layer glow effects → momentum strength
• Dynamic cloud → fast vs trend dominance
• Color-shifting fast line → acceleration vs decay
• Chart overlays → execution clarity without clutter
Everything is designed for speed and readability during live trading.
⭐ Unique Selling Points (USP)
✅ Multi-speed stochastic rotation (not single-line signals)
✅ Context-first, not signal spam
✅ Built-in divergence + continuation logic
✅ Non-repainting logic
✅ Designed for scalpers, not hindsight analysis
✅ Works across indices, options, crypto, and futures
⚠️ Important Notes
• Not a standalone trading system
• Best combined with:
– Market structure
– Key levels
– Session timing
• Avoid low-liquidity or news-spike candles
This indicator guides execution, it does not replace discretion.
👤 Who This Is For
• Scalpers & intraday traders
• Options traders needing precise timing
• Traders who understand momentum & structure
• Users who want fewer but higher-quality signals
🏁 Summary
JK Scalp helps you trade momentum rotation, not overbought/oversold myths.
Wait for alignment. Execute with discipline.

CRT - Candle Range TheoryCRT - Candle Range Theory is an indicator that identifies CRT patterns based on the concept of liquidity sweeps and price rejection.
WHAT IS CRT?
A CRT (Candle Range Theory) pattern occurs when:
- A "Parent" candle establishes a range (High/Low)
- The next candle sweeps beyond one side of that range (liquidity grab)
- But closes back INSIDE the parent range (rejection)
This creates a potential reversal signal as liquidity has been taken and price rejected continuation.
PATTERN TYPES
BEARISH CRT
- CRT candle sweeps above Parent High
- Does NOT sweep below Parent Low
- Closes inside Parent range
BULLISH CRT
- CRT candle sweeps below Parent Low
- Does NOT sweep above Parent High
- Closes inside Parent range
ALERT TYPES
The indicator offers three alert filters based on the strength of rejection:
1. Close NOT Reach 50%
Strongest rejection - Close doesn't even retrace to the 50% level of the parent range.
Bearish: Close > 50% | Bullish: Close < 50%
2. Price NOT Reach 50%
Price (wick) doesn't reach the 50% level at all.
Bearish: Low > 50% | Bullish: High < 50%
3. Basic CRT
Any valid CRT pattern without the 50% filter.
VISUAL ELEMENTS
- PH / PL lines: Parent candle High and Low
- 50% line: Middle of the parent range
- 25% / 75% lines: Quarter levels of the parent range
- Labels: Appear on CRT candle showing pattern type and conditions met
HOW TO USE
1. Set your preferred chart timeframe
2. Enable the alert types you want to monitor
3. Create alerts via the TradingView alert menu
4. Labels will automatically appear when conditions are met
SETTINGS
Visual Settings
- Colors for PH/PL, 50%, and 25%/75% lines
- Line widths for each level type
- Toggle visibility for 50% and quarter lines
CRT Alerts
- Show/hide labels on chart
- Customize bearish/bullish label colors
- Enable/disable each alert type independently
NOTES
- This indicator works on any timeframe
- Multiple conditions can be displayed in one label if enabled
- Outside bars (sweep both sides) are excluded from CRT detection
- Close must be inside parent range for valid pattern

CRT+ Advance Engulfing | @stefandimovCRT+ Lite implements institutional-style Candle Range Theory logic to identify displacement-driven engulfing structures with precision.
The script focuses on wick-based liquidity grabs, strict body closes, and optional higher-timeframe confirmation to highlight structurally valid bullish and bearish reversals.
Includes a Daily-only multi-market scanner and a compact dashboard for fast top-down analysis.
Designed for traders who prioritize structure, execution precision, and HTF alignment.

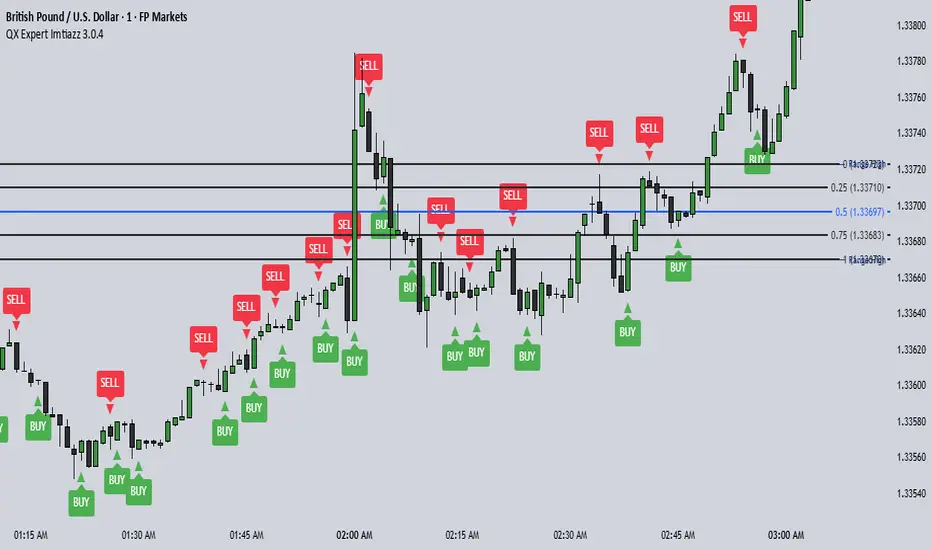
QX Expert Imtiazz 3.0.4 PROQX Expert Imtiazz 3.0.4 (qx_expert_imtiaz)
is a high-precision 1-minute binary scalping indicator, built using a hybrid trading strategy that combines momentum, structure, volume, and zone-based logic.
This indicator is specially designed for fast decision-making and short expiry trades in volatile market conditions.
---
🔹 Core Concepts Used
This indicator integrates multiple professional trading concepts into a single system:
QQE (Quantitative Qualitative Estimation)
Identifies momentum shifts and trend strength with reduced noise.
EMA Trend Filter
Confirms market direction and avoids counter-trend entries.
Smart Zones (Base & Reaction Zones)
Detects key price areas where reversals or continuations are most likely.
Volume Confirmation
Filters weak signals and confirms real market participation.
Footprint Logic (Price Acceptance / Rejection)
Analyzes candle behavior to validate buy/sell pressure.
---
STOC DMA Ribbon, Trend, Volume & Structure Dashboard v1.5This indicator is the intellectual property of Systematic Traders Club.
Distribution, modification, or commercial use without permission is prohibited.
This indicator is provided for educational and informational purposes only.
It does not constitute financial advice, investment recommendations, or trade signals.
The creator and Systematic Traders Club are not responsible for any financial losses resulting from the use of this indicator.
Trading and investing involve risk. Always do your own analysis and use proper risk management.

Rolling VWAP Structure [MTF]Core Logic: Rolling VWAP & MTF**
* **Rolling VWAP (Volume-Weighted Average Price):** Unlike a simple Moving Average, this centerline weighs price by volume. It represents the true "Institutional Cost Basis" over the rolling period (default 20).
* **MTF (Multi-Timeframe) Capability:** The indicator is locked to the **Daily (1D)** timeframe by default. This acts as a stable "Lighthouse," ensuring that intraday noise does not distort the major structural levels.
* *Stepped Lines:* On lower timeframes, the lines appear stepped. This is intentional. It shows that the structural value remains constant throughout the day until the daily close shifts the calculation.
**3. Market Profile Logic: Balance vs. Imbalance**
This indicator visually decodes the market cycle using Auction Market Theory:
* **Orange Zone (Squeeze) = Balance:** When the bands contract (and turn Orange), the market is in equilibrium. This is a high-volume node where price is accepted. **Note:** Historical Orange Zones often act as strong Support/Resistance upon retest.
* **Grey Cloud (Expansion) = Imbalance:** When price breaks into the Grey "Highway" (1.0 - 2.0 StdDev), the market enters Price Discovery mode (Trending).
**4. Key Features & Settings**
* **Fixed Timeframe:** Select the timeframe you want to monitor (e.g., "1D" for Daily structure, "1W" for Weekly).
* **Clean Visuals:** The bottom signal dots have been removed for a cleaner chart.
* **Squeeze Toggle:** You can now **hide the Orange Squeeze color** in the settings if you prefer a unified Grey look for strictly structural analysis.
---
### **中文说明**
核心逻辑:Rolling VWAP 与 跨周期 (MTF)**
* **Rolling VWAP (滚动成交量加权均价):** 与简单移动平均线不同,中轨根据成交量对价格进行加权。它代表了滚动周期内(默认20)真实的“机构持仓成本”。
* **MTF (跨周期) 能力:** 指标默认锁定在 **日线 (1D)** 周期。这就像一座稳定的“灯塔”,确保日内的短期噪音不会扭曲主要的结构性点位。
* *阶梯状线条:* 在小周期图表上,轨道呈现阶梯状。这是有意设计的,代表当天的结构价值是固定的,不会随秒级波动而改变。
**3. 市场轮廓逻辑:平衡与失衡**
本指标利用拍卖市场理论可视化解码市场周期:
* **橙色区域 (挤压) = 平衡 (Balance):** 当布林带收缩(并变橙色)时,市场处于均衡状态。这是筹码密集的高成交量区。**注意:** 历史上的橙色区域在未来回踩时往往起到强力的 支撑/阻力 作用。
* **灰色云带 (扩张) = 失衡 (Imbalance):** 当价格突破进入灰色“高速公路”(1.0 - 2.0 标准差)时,市场进入价格发现模式(趋势)。
**4. 主要功能与设置**
* **Fixed Timeframe (锁定时间框架):** 选择你想要监控的周期(例如 "1D" 看日线结构,"1W" 看周线结构)。
* **视觉净化:** 移除了底部的信号圆点,让主图背景更加纯粹干净。
* **Squeeze Toggle (挤压色开关):** 你现在可以在设置中**隐藏橙色挤压显示**。如果你更偏向纯粹的结构分析,可以选择让通道始终保持灰色。

UT3T Stratejisi (Ugur Tufan Trend ve Trade Takip Stratejisi)UT3T Strategy (Trend & Trade Tracking System)
UT3T Strategy is a comprehensive, hybrid trading system designed to capture both long-term trends and short-term trade opportunities. It combines smart cost averaging (DCA), dynamic profit-taking, and Fibonacci-based trade levels into a single, powerful indicator.
This script is ideal for traders looking for a structured approach to managing positions in both trending and ranging markets.
Key Features:
Dual Strategy Engine:
Strategy 1 (Trend Following): Uses EMA crossovers (EMA9/EMA50) to identify trend direction. It includes a smart DCA (Dollar Cost Averaging) mechanism labeled as ADD-LONG to optimize entry prices during corrections.
Strategy 2 (Trade Tracking): Utilizes custom Fibonacci channels to identify potential reversal zones (LONG / SHORT) based on price action and support/resistance levels.
Smart Position Management:
Dynamic Take Profit (TP): Offers an optional "Progressive TP" mode where profit targets increase by 50% after each successful hit (e.g., 10% -> 15% -> 22.5%), allowing you to ride strong trends.
Custom Exit Logic: The SHORT signal is triggered only if a minimum profit threshold (defined by the user) is met, preventing premature exits in small pullbacks.
Visual Clarity:
Clear Labels: Distinguishes between initial entries (LONG) and averaging entries (ADD-LONG) directly on the chart.
Alert System: Includes a fully customizable alert system for every signal type (Trend Entry, DCA, Stop Loss, Take Profit, and Fib Levels).
How to Use:
Symbol Settings: Input your preferred tickers and customize TP/Cost percentages in the settings menu.
Fib Levels: Define custom High/Low prices for Strategy 2 to generate Fib channels automatically.
Alerts: Set alerts based on your trading style (Per Bar Close for trends, Once Per Bar for TP levels).

Call-Put Cross Strike Match [Pro]📊 Call-Put Cross Strike Match - Professional Options Trading Indicator
Advanced NSE Options Analysis with AI-Powered Trading Signals & Dynamic Display
🎯 Overview
The Call-Put Cross Strike Match is an institutional-grade options analysis tool designed exclusively for NSE NIFTY and BANKNIFTY traders. Built on Pine Script v6, this indicator combines sophisticated cross-strike matching algorithms with intelligent trading signal generation to identify optimal options trading opportunities in real-time.
What makes it unique:
Analyzes 25 call-put combinations simultaneously
Generates actionable BUY/SELL signals using professional strategies
Fully customizable display with 9 table positions and 6 size options
Simplified setup with semi-automatic ATM detection
Clean, clutter-free interface with only essential information
Perfect for intraday scalpers, premium sellers, and positional options traders.
✨ Key Features
1. 🔍 Advanced Cross-Strike Matching Algorithm
The indicator calculates price differences for all 25 combinations (5 call strikes × 5 put strikes) and identifies the best matches based on put-call parity.
How it works:
Compares each call option price with every put option price
Calculates absolute difference: |Call - Put |
Ranks all 25 combinations from lowest to highest difference
Highlights top 3 or top 5 matches with visual checkmarks
Visual indicators:
✓✓ (Double check) = Best match (lowest price difference)
✓ (Single check) = Good matches (top 3 or top 5)
Empty cells = No match (significant price difference)
Why this matters:
When Call ≈ Put at same strike, it indicates fair pricing and synthetic position opportunities. The indicator automatically finds these opportunities across different strike combinations.
2. 🎯 Intelligent Trading Signals (Last Column)
The indicator generates professional trading recommendations based on Call-Put price difference analysis:
Signal Types:
BUY CE - Long call opportunity (bullish)
SELL CE - Short call opportunity (premium selling)
BUY PE - Long put opportunity (bearish/hedge)
SELL PE - Short put opportunity (premium selling)
BULL - Moderate bullish bias
BEAR - Moderate bearish bias
ATM - Neutral market (near parity)
NEUTRAL - No clear bias
Color-Coded for Quick Decisions:
🟩 Green = Long opportunities (BUY CE, BULL)
🟥 Red = Short call opportunities (SELL CE)
🟧 Orange = Long put opportunities (BUY PE)
🟫 Maroon = Short put opportunities (SELL PE)
⬛ Gray = Neutral zones (ATM, NEUTRAL)
3. 🤖 Three Professional Signal Modes
SMART Mode (Recommended) 🎯
Context-aware institutional strategy that considers strike position relative to spot price.
Signal Logic:
text
OTM Call Expensive (C-P > threshold, Strike > Spot):
→ SELL CE (Premium selling opportunity)
ITM Call Underpriced (C-P > threshold, Strike < Spot):
→ BUY CE (Synthetic long opportunity)
OTM Put Expensive (C-P < -threshold, Strike < Spot):
→ SELL PE (Premium selling opportunity)
ITM Put Underpriced (C-P < -threshold, Strike > Spot):
→ BUY PE (Protection or synthetic short)
Near Parity (|C-P| < threshold/4):
→ ATM (Neutral market, straddle/strangle zone)
Moderate Imbalance:
→ BULL or BEAR (Directional bias without extreme pricing)
Best for: Professional traders, option writers, synthetic position builders
MOMENTUM Mode 📈
Trend-following strategy that rides market momentum.
Signal Logic:
text
Calls Expensive (C-P > threshold):
→ BUY CE (Follow bullish momentum)
Puts Expensive (C-P < -threshold):
→ BUY PE (Follow bearish momentum)
Near Parity:
→ NEUTRAL (No clear trend)
Best for: Intraday scalpers, directional traders, swing traders
MEAN REVERSION Mode 🔄
Counter-trend strategy focused on premium selling.
Signal Logic:
text
Calls Overpriced (C-P > threshold):
→ SELL CE (Collect inflated premium)
Puts Overpriced (C-P < -threshold):
→ SELL PE (Collect inflated premium)
Near Parity:
→ ATM (Fair value, no edge)
Best for: Option writers, theta decay strategies, credit spread traders
4. 🎨 Fully Customizable Display
Dynamic Table Positioning (9 Options):
Top: left, center, right
Middle: left, center, right
Bottom: left, center, right
Choose position based on your chart layout and other indicators.
Dynamic Table Sizing (6 Options):
Auto - Adapts to content
Tiny - Minimal space (for cluttered charts)
Small - Default, best balance
Normal - Medium size (1080p monitors)
Large - Big text (4K monitors)
Huge - Maximum size (presentations)
Text scales intelligently:
Headers, data, and checkmarks adjust proportionally
Checkmarks remain visible even in tiny mode
Info row stays readable at all sizes
5. ⚙️ Simplified Input System
Auto Mode (Recommended):
Enter just 5 strikes once at market open - used for both calls and puts.
Example for NIFTY at 25,900:
text
Strike 1: 25850 (ATM - 100)
Strike 2: 25900 (ATM - 50)
Strike 3: 25950 (ATM)
Strike 4: 26000 (ATM + 50)
Strike 5: 26050 (ATM + 100)
Manual Mode (Advanced):
Enter separate call and put strikes for cross-strike arbitrage analysis.
Why this matters:
50% fewer inputs compared to traditional indicators
One-time setup at market open
Rarely needs updating (only if market moves 100+ points)
6. 🎛️ Semi-Automatic ATM Detection
The indicator automatically:
Detects current NIFTY/BANKNIFTY spot price
Calculates ATM strike (rounded to nearest 50 or 100)
Marks ATM strikes with *ATM in the table
Displays ATM and spot price in info box
No manual recalculation needed!
7. 📊 Clean Information Display
Main Table (Top/Middle/Bottom):
CE \ PE matrix showing all strike combinations
Checkmarks (✓✓ and ✓) highlighting best matches
SIGNAL column with color-coded trading recommendations
Best Match footer showing optimal combination
Info row displaying symbol, signal mode, and spot price
Info Box (Bottom Left):
Symbol (NIFTY/BANKNIFTY)
Signal Mode (Smart/Momentum/Mean Reversion)
Current Spot Price
Detected ATM Strike
Best Matched Call Strike
Best Matched Put Strike
Match Difference
C-P value for best match
📋 Quick Setup Guide (3 Steps)
Step 1: Add Indicator
Open NIFTY or BANKNIFTY chart on TradingView
Add "Call-Put Cross Strike Match " from indicators
Step 2: Configure Basic Settings
text
Symbol Detection: Auto (reads from chart)
Expiry Date: 251219 (format: YYMMDD for 19-Dec-2025)
Strike Mode: Auto
Strike Interval: 50 (for NIFTY) or 100 (for BANKNIFTY)
Step 3: Enter Strikes
At market open (9:15 AM), check current price and enter 5 strikes:
text
Example: NIFTY at 25,937
Strike 1: 25850 (ATM - 100)
Strike 2: 25900 (ATM - 50)
Strike 3: 25950 (ATM) ← Rounded to nearest 50
Strike 4: 26000 (ATM + 50)
Strike 5: 26050 (ATM + 100)
That's it! The indicator handles everything else automatically.
💡 Real-World Use Cases
1. 📉 Premium Selling (Mean Reversion Mode)
Scenario: Looking for overpriced options to write
How to use:
Set Signal Mode to "Mean Reversion"
Set Threshold: 30 (NIFTY) or 75 (BANKNIFTY)
Look for SELL CE or SELL PE signals with ✓ or ✓✓
Sell naked options or credit spreads at those strikes
Target 30-50% profit or 3-5 days theta decay
Perfect for: Credit spreads, iron condors, covered calls, naked puts
2. 📈 Directional Trading (Momentum Mode)
Scenario: Scalping intraday moves
How to use:
Set Signal Mode to "Momentum"
Set Threshold: 15 (aggressive) or 25 (conservative)
BUY CE signal + ✓✓ = Long call entry
Enter with tight stop (20% of premium)
Target 30-50% gain within 1-2 hours
Perfect for: Intraday scalping, swing trading, trend following
3. 🔄 Synthetic Positions (Smart Mode)
Scenario: Building synthetic long/short with defined risk
How to use:
Set Signal Mode to "Smart"
Look for BUY CE at ITM strike + SELL PE at OTM strike
Both should have ✓ indicator (good parity)
Creates synthetic long position
Lower capital than buying futures
Perfect for: Professional traders, arbitrage, capital efficiency
4. ⚖️ ATM Strategy Optimization (Smart Mode)
Scenario: Finding optimal strikes for straddle/strangle
How to use:
Identify strike marked *ATM
Check if signal shows ATM (balanced market)
If BULL/BEAR → Market has directional bias, adjust accordingly
✓✓ indicates best matched strike for neutral strategies
Perfect for: Volatility trading, earnings plays, event trading
5. 🛡️ Hedging Optimization (Smart Mode)
Scenario: Protecting long equity positions
How to use:
Look for BUY PE signals (protection signals)
Avoid strikes with SELL PE (expensive hedges)
✓✓ shows best value for hedge entry
Optimize hedge timing and strike selection
Perfect for: Portfolio hedging, risk management, protective puts
⚙️ Settings Guide
Symbol Settings
Symbol Detection: Auto (recommended) or Manual
Manual Symbol: NIFTY or BANKNIFTY
Expiry Date: Format YYMMDD (e.g., 251219 = 19-Dec-2025)
Update every Thursday after 3:30 PM for next week's expiry
Strike Settings
Strike Mode: Auto (recommended) or Manual
Strike Interval:
50 for NIFTY
100 for BANKNIFTY
Trading Signals
Signal Mode: Smart / Momentum / Mean Reversion
Smart: Professional institutional strategy (default)
Momentum: Trend-following for scalpers
Mean Reversion: Premium selling for writers
Signal Threshold: Sensitivity in points
NIFTY Recommendations:
Conservative: 30-40 points (fewer, higher quality signals)
Balanced: 20-25 points (default)
Aggressive: 10-15 points (more signals, more noise)
BANKNIFTY Recommendations:
Conservative: 75-100 points
Balanced: 50-60 points (default)
Aggressive: 30-40 points
Algorithm Settings
Matching Mode:
Top 3: Shows 3 best matches (cleaner display)
Top 5: Shows 5 best matches (more opportunities)
Display Settings
Show Matching Table: Enable/disable main table
Table Position: Choose from 9 positions
top_right (default) - Doesn't block price action
middle_right - Centered vertical view
bottom_right - If top is crowded
Table Size: Choose from 6 sizes
small (default) - Best for most users
normal - For 1080p/4K monitors
tiny - If you have many indicators
📊 Understanding The Table
Table Layout Example:
text
CE \ PE | 25950 | 25900 | 25850 | 26000 | 26050 | SIGNAL
---------|-------|-------|-------|-------|-------|--------
25850 | | | | | | SELL PE
25900*ATM| | ✓ | | | | ATM
25950 | ✓✓ | | | | | BULL
26000 | | | | ✓ | | BUY CE
26050 | | | | | | SELL CE
---------|-------|-------|-------|-------|-------|--------
Best Match: 25950 / 25950 (0.25)
Info: NIFTY | Smart | Spot:25881.9
Reading the Table:
Rows (Left): Call option strike prices
Columns (Top): Put option strike prices
Cells: Checkmarks where Call ≈ Put
✓✓: Best match (minimum price difference)
✓: Good matches (top 3 or 5)
Empty: Prices too different (no match)
*ATM: Automatically detected at-the-money strike
SIGNAL Column: Actionable trading recommendation for each call strike
Info Box Metrics:
Symbol: Currently analyzed index
Signal Mode: Active strategy
Spot: Current underlying price
ATM: Calculated at-the-money strike
Best Call: Matched call strike
Best Put: Matched put strike
Match Diff: Price difference (lower = better)
C-P (Best): Call minus Put for best match
📈 Best Practices
Strike Selection & Maintenance
At Market Open (9:15 AM):
Check current price (e.g., NIFTY at 25,937)
Round to nearest interval (25,950 for 50 interval)
Enter 5 strikes: -100, -50, 0, +50, +100 from ATM
Update Frequency:
Usually no update needed entire day
Update only if market moves 100+ points from initial ATM
Typically 0-2 updates per trading session
Signal Interpretation by Confidence Level
High Confidence (✓✓ + Signal):
Best match indicator present
Strongest signal quality
Highest probability setup
Medium Confidence (✓ + Signal):
Good match present
Reliable signal
Acceptable risk/reward
Low Confidence (Signal without ✓):
No match indicator
Strike far from parity
Requires additional confirmation
Risk Management Rules
Never trade signals blindly. Always:
✅ Confirm with price action and support/resistance
✅ Check overall market trend (NIFTY/BANKNIFTY direction)
✅ Consider time decay (theta) for your position
✅ Monitor IV changes (implied volatility)
✅ Use proper position sizing (1-2% risk per trade)
✅ Set stop losses (20-30% of premium for longs)
✅ Have profit targets (30-50% for scalps)
Timeframe Selection
Intraday Trading:
Use 5-minute or 15-minute chart
Momentum or Smart mode
Lower threshold (aggressive)
Quick entries and exits
Positional Trading:
Use hourly or daily chart
Smart or Mean Reversion mode
Higher threshold (conservative)
Swing trade positions
Combining with Other Tools
Recommended complements:
Support/resistance levels (horizontal lines)
Trend indicators (EMA 20/50, SuperTrend)
Volume analysis (confirm breakouts)
India VIX (volatility context)
Option chain data (open interest)
🎓 Strategy Examples
Strategy 1: Professional Premium Selling
text
Mode: Mean Reversion
Threshold: 30 (NIFTY) / 75 (BANKNIFTY)
Timeframe: Daily
Rules:
1. Wait for SELL CE or SELL PE signal
2. Verify strike has ✓ or ✓✓ (good parity)
3. Check if OTM (Strike away from spot)
4. Sell option or create credit spread
5. Target: 30-50% profit or 3-5 days theta
6. Stop: If signal changes to BUY
Position: Naked short or credit spreads
Risk: Define with spreads or capital allocation
Strategy 2: Intraday Momentum Scalping
text
Mode: Momentum
Threshold: 15 (aggressive)
Timeframe: 5-minute
Rules:
1. Wait for BUY CE signal + ✓✓
2. Enter long call immediately
3. Stop loss: 20% of premium paid
4. Target 1: 30% gain (partial exit)
5. Target 2: 50% gain (full exit)
6. Exit if signal changes or 2 hours pass
Position: Long calls or long puts only
Risk: 1-2% of capital per trade
Strategy 3: Synthetic Long Position
text
Mode: Smart
Threshold: 25 (NIFTY) / 60 (BANKNIFTY)
Timeframe: Hourly
Rules:
1. Identify BUY CE signal at ITM strike
2. Identify SELL PE signal at OTM strike
3. Both should have ✓ indicator
4. Buy ITM call + Sell OTM put = Synthetic Long
5. Lower capital than futures
6. Defined risk (width of strikes)
Position: Call debit + Put credit
Risk: Net debit paid (defined risk)
Strategy 4: ATM Straddle Entry
text
Mode: Smart
Threshold: 20 (default)
Timeframe: Daily
Rules:
1. Find strike marked *ATM
2. Check signal shows "ATM" (neutral)
3. Verify ✓✓ at that strike
4. Sell ATM call + Sell ATM put
5. Collect maximum premium
6. Exit at 30% profit or before expiry
Position: Short straddle or iron condor
Risk: Use defined risk (iron condor recommended)
🔔 Important Notes
Data Accuracy
Indicator uses TradingView's NSE options data feed
Always verify prices independently before trading
Ensure market is open (9:15 AM - 3:30 PM IST)
Check for "-" in cells indicating missing data
Expiry Management
Update expiry date every week on Thursday post-closing
Format: YYMMDD (6 digits)
Weekly expiry: Every Thursday
Monthly expiry: Last Thursday of month
Strike Format
NIFTY: Multiples of 50 (25850, 25900, 25950...)
BANKNIFTY: Multiples of 100 (51800, 51900, 52000...)
Wrong strikes = No data in table
Performance Optimization
Indicator updates every bar close
No lag or performance issues
Works on all timeframes (1m to 1D)
Maximum 5 calls + 5 puts = 10 security calls (within limits)
⚠️ Disclaimer
Trading options involves substantial risk of loss and is not suitable for all investors. This indicator is provided for educational and informational purposes only. It does not constitute financial advice, investment advice, or trading advice.
Important disclaimers:
Options can expire worthless, resulting in 100% loss
Past performance of signals is not indicative of future results
Accuracy depends on TradingView's NSE data feed
Signals are mathematical analysis, not predictions
You are solely responsible for your trading decisions
The developer is not liable for any trading losses incurred while using this indicator.
Before trading, ensure you understand:
Options Greeks (Delta, Gamma, Theta, Vega, Rho)
Implied volatility and its impact
Time decay and expiration risks
Assignment risk for short positions
Liquidity and slippage considerations
Margin requirements and capital needs
Always:
Use proper risk management (1-2% per trade)
Trade with capital you can afford to lose
Paper trade before live trading
Consult with a licensed financial advisor
Start with small position sizes
Never risk more than you can afford to lose
📊 Technical Specifications
Platform: TradingView Pine Script v6
Exchanges: NSE (National Stock Exchange of India)
Instruments: NIFTY, BANKNIFTY options
Timeframes: All (1m, 5m, 15m, 1h, 1D)
Strikes Analyzed: 5 calls × 5 puts = 25 combinations
Security Calls: 10 (5 calls + 5 puts)
Table Positions: 9 (all corners and centers)
Table Sizes: 6 (auto to huge)
Signal Modes: 3 (Smart, Momentum, Mean Reversion)
Performance: Optimized, minimal lag
🎯 Who Should Use This?
✅ Perfect For:
Options Traders: Intraday and positional
Premium Sellers: Option writers and theta strategists
Arbitrage Traders: Synthetic position builders
Straddle/Strangle Traders: ATM strategy traders
Professional Traders: Institutional-grade analysis
Volatility Traders: IV imbalance exploiters
Scalpers: Quick intraday moves
❌ Not Suitable For:
Stock options traders (NSE index-specific)
Equity-only traders (requires options knowledge)
International markets (NSE format only)
Complete beginners (requires basic options understanding)
💬 FAQ
Q: Why manual strike entry? Why not fully automatic?
A: Pine Script's type system limits fully automatic strike generation from live data. However, setup takes just 30 seconds once at market open, and the indicator handles all analysis automatically throughout the day.
Q: How often should I update strikes?
A: Rarely! Only when market moves 100+ points from initial ATM. Usually 0-2 times per day, even in volatile markets.
Q: Which Signal Mode is best?
A: Smart mode (default) for professional trading. Use Momentum for intraday scalping, Mean Reversion for premium selling.
Q: Can I use this for stock options?
A: No. The indicator is designed specifically for NSE index options (NIFTY and BANKNIFTY) with NSE format.
Q: Does it work on mobile?
A: Yes, but table display is optimized for desktop/tablet screens. Use "tiny" or "small" size on mobile.
Q: What if I see "-" in cells?
A: Check expiry format (YYMMDD), verify strikes match NSE strikes, and ensure market is open.
Q: What's the difference between ✓✓ and ✓?
A: ✓✓ = Best match (lowest price difference), highest quality. ✓ = Good matches (top 3-5), reliable quality.
Q: Can I backtest this indicator?
A: The indicator shows live analysis. For backtesting options strategies, you'll need historical options data and separate backtesting tools.
Q: What does the info box show?
A: Bottom-left box shows key metrics: symbol, signal mode, spot price, ATM strike, best matched strikes, match difference, and C-P value.
Q: Why no chart plotting?
A: v1.0 focuses on clean table display with maximum information density. Chart plotting may be added in future versions based on user feedback.
🙏 Credits
Developed by a professional options trader for the Indian trading community. Inspired by institutional trading desks and market makers who use call-put parity for daily trading decisions.
Found This Helpful?
⭐ Rate 5 stars if it improved your trading
💬 Comment with your strategy results
🔔 Follow for updates and new indicators
📢 Share with fellow options traders
Feature Requests
Continuous improvement based on trader feedback. Suggest features in comments!
Planned Features (v2.0):
Multi-expiry comparison
Greeks display (Delta, Theta, Vega)
Historical signal performance stats
Custom signal formulas
Export to CSV functionality
🏷️ Tags for Search
#Options #OptionsTrading #NIFTY #BANKNIFTY #NSE #India #OptionChain #CallPut #PutCallParity #Straddle #Strangle #ATM #TradingSignals #OptionsStrategy #PremiumSelling #OptionsScanner #Derivatives #IntradayTrading #VolatilityTrading #Arbitrage #SyntheticPosition #OptionsGreeks #OptionsSelling #OptionsWriting #IndianStockMarket #NSEOptions #OptionsAnalysis #TechnicalAnalysis #AlgoTrading #QuantTrading #ProfessionalTrading #TradingIndicator #PineScript #TradingView
📝 Version History
v1.0 (Current - Dec 2025)
Pine Script v6 implementation
Cross-strike matching (5×5 matrix, 25 combinations)
Three signal modes (Smart, Momentum, Mean Reversion)
Trading signal generation with color coding
Dynamic table positioning (9 positions)
Dynamic table sizing (6 sizes)
Intelligent text scaling
Semi-automatic ATM detection
Auto symbol detection
Simplified input system (50% fewer inputs in Auto mode)
Clean information display
Info box with key metrics
NSE NIFTY & BANKNIFTY support
Start trading smarter with institutional-grade options analysis! 📈💰🚀
Disclaimer: Options trading is subject to market risk. Please read all scheme-related documents carefully before investing.

Manipulation Candle SystemThis indicator is based on One Candle Scalping Strategy by ProRealAlgos
## **Manipulation Candle System – Simple Explanation**
This indicator helps traders identify **potential market manipulation** during the **US stock market session (New York)** and highlights **key reversal signals**.
---
### **1. Daily ATR (Average True Range)**
* Measures the **average price movement** of the day.
* Helps determine if a move is **normal** or **abnormally large**.
* The indicator calculates **daily ATR** automatically.
* If 15 minute opening candle is more than 25% of Daily ATR, we can call it manipulation is happen .
---
### **2. 15-Minute Opening Candle Box**
* Highlights the **first 15-minute candle** of the US session.
* The box **extends for 2 hours** after the market opens.
* **Color indicates market condition**:
* **Red box** → the opening candle range is bigger than 25% of the daily ATR → potential **manipulation**.
* **Blue box** → the opening candle range is normal → **neutral session**.
* Helps traders visually spot when the market might be trying to **trap traders**.
---
### **3. 5-Minute Reversal Detection**
* Looks for **reversal candle patterns** on the 5-minute chart:
* Bullish engulfing or strong bullish pin → **buy reversal**.
* Bearish engulfing or strong bearish pin → **sell reversal**.
* Only checks during the **US session**, after 15 minute opening candle.
* Helps traders **time entries** in the direction of potential market reversals.
---
### **4. Buy / Sell Signals**
* Shows **triangle markers** on the chart:
* **Green triangle below candle** → buy signal.
* **Red triangle above candle** → sell signal.
* The signal text also indicates:
* `"BUY (Trap Reversal)"` → if the reversal occurs during manipulation.
* `"BUY (Normal Reversal)"` → if the reversal occurs during a neutral session.
* `"SELL (Trap Reversal)"` → if a sell reversal occurs during manipulation.
* `"SELL (Normal Reversal)"` → otherwise.
---
### **5. Info Table**
* Appears at the **top-right** of the chart.
* Shows:
1. Daily ATR value.
2. 15-minute opening candle range.
3. Session condition → `"MANIPULATION"` or `"NEUTRAL"`.
4. Current reversal signal text.
---
### **How a New Trader Can Use It**
1. Look at the **color of the opening box**:
* Red → be cautious, price may trap traders.
* Blue → normal market behavior.
2. Watch for **reversal signals** on the 5-minute chart.
3. Use the **info table** to confirm ATR, session bias, and signals.
4. Combine this with **risk management** before entering trades.

Buy the dips StrategyThis strategy getting in long position only after the price drop- Buy the dips
The % of the drop is Determined by SMA for the first trade
The inputs of SMA and % of the drop can be adjust from the User
After that Strategy start taking safe trades if not take profit from the first trade
The safe trades are Determined by step down deviation % and by quantity
There is no Stop loss is not for one with small tolerance to getting under
if any question ask

Momentum Engine: Stage AnalysisOverview: This dashboard is a comprehensive momentum analysis tool designed for the Indian stock market (adaptable to others). It evaluates a stock's health by analyzing its trend structure, relative strength against a benchmark, volume activity, and price volatility.
Dashboard Metrics & Interpretation: Each row in the dashboard provides a specific diagnostic check for the stock.
Trend Structure: Identifies the current phase of the stock's life cycle.
✅ Power Trend (Stage 2): The strongest bullish signal. The stock is in a confirmed uptrend indicating powerful momentum.
⚠️ Stage 2 (Developing): The stock price is rising, but the momentum alignment is not yet perfect. It is positive but may be in the early stages or correcting.
❌ Mixed / Stage 4: The stock is either in a downtrend (falling price) or moving sideways without clear direction. It is technically weak.
RS vs BenchmarkCompares the stock's performance against a selected market index (e.g., Nifty 50, Sensex, Smallcap).
💪 Beating : The stock is outperforming the market. Even if the market is flat, this stock is rising. This indicates market leadership.
⚠️ Lagging : The stock is underperforming. It is weaker than the general market, suggesting a lack of institutional interest.
Tightness (VCP) Checks if the price action is "tightening" (Volatility Contraction Pattern).
✅ Tight (VCP): The price swings are getting smaller and calmer. This "calm before the storm" often precedes a major breakout.
❌ Loose: The price action is wide and choppy. The stock is "noisy," making it difficult to manage risk effectively.
The Final Verdict: The "Verdict" synthesizes all metrics into a single actionable status.Verdict 🚀 A+ BREAKOUT🟩 Green: The Perfect Setup. The stock is in a Power Trend, beating the market, has tightened up (VCP), and is sitting just below the breakout point. High probability.
💪 VOL MOMENTUM🟦 Blue High Velocity. The stock has strong trend and volume but might be imperfect (e.g., a bit loose or volatile). Suitable for aggressive traders riding momentum.👀
WATCH LIST🟧 Orange Getting Ready. The stock has a great structure but is not ready to buy yet (e.g., price is too far from the pivot). Keep it on your radar.
WAIT⬜ Gray No Setup. The stock is weak, lagging, or broken. Ignore it for now.
⚠️ WARNING & DISCLAIMER
Trading involves substantial risk of loss. This tool is a technical analysis aid only and does not guarantee future performance.
No Guarantees: A "Power Trend" or "A+ Breakout" signal does not ensure the stock will rise. Market conditions can change instantly due to news, earnings, or global events.
Not Financial Advice: This script is for educational and analytical purposes only. It is not a recommendation to buy or sell any specific security.
Use Caution: Always perform your own research (DYOR) and use strict risk management (Stop Losses) regardless of what the indicator says. The indicator is based on historical data, which may not predict future movements.

Futures Risk-Based Position CalculatorFutures Risk‑Based Position Calculator — Description
This TradingView indicator automatically calculates and displays Entry, Stop Loss (SL), and Take Profit (TP) levels for futures trades based on a fixed dollar‑risk amount.
What it does
Uses your account balance, dollar risk, number of contracts, point value, and tick size to compute how far the stop should be from the entry.
Determines the take‑profit level using a chosen risk‑to‑reward ratio.
Draws three lines on the chart:
Entry line
Stop loss line
Take profit line
Places labels next to the SL and TP lines showing prices and point distances.
Key features
Supports long or short calculation mode.
Configurable line styling:
Width, style (solid/dashed/dotted), color, opacity.
Separate styling for entry, SL, and TP.
Configurable label behavior:
Optional background.
Text color choices.
Adjustable vertical offset to avoid overlapping the lines.
Lines extend left/right by user‑defined bar amounts.
Values are always rounded to the market's tick size.
How levels are calculated
Entry = current close rounded to tick size.
Stop distance (points) = dollarRisk / (contracts × pointValue).
SL = entry − distance (long) or entry + distance (short).
TP = entry + distance × RR (long) or entry − distance × RR (short).
Visual behavior
Lines and labels update only on the last bar to avoid clutter.
Labels show:
SL: price, point distance, and contract count.
TP: price and point distance.

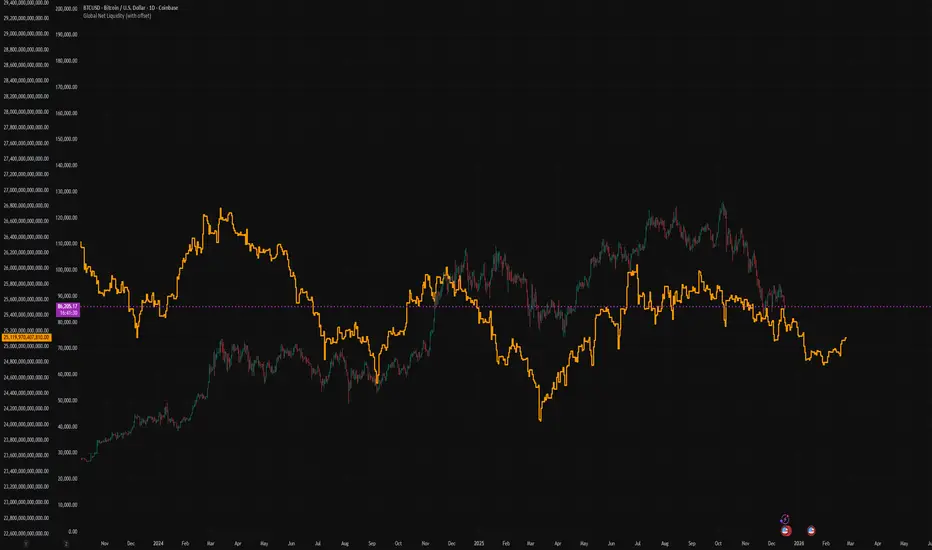
Global Net Liquidity (with offset Trail2Crypto)Click settings and set the offset to 70 days to have the perfect fit.
Smart MA Zone Crossover [HMA-EMA]Smart MA Zone Crossover is a trend-following indicator designed to capture early momentum shifts using the crossover between Hull Moving Average (HMA) and Exponential Moving Average (EMA).
The indicator visually highlights trend direction using a dynamic colored zone, making it easy to identify bullish and bearish market phases at a glance.
🔸 Step 1: Moving Average Calculation
HMA (Hull Moving Average) → Faster, smoother, reacts quickly to price
EMA (Exponential Moving Average) → Stable trend reference
Both MA lengths are **fully adjustable** from the settings panel.
🔸 Step 2: Trend Detection
Bullish Trend: HMA is above EMA
Bearish Trend: HMA is below EMA
The area between the two averages is filled with color to visually represent the current trend state.
Step 3: Signal Generation (Non-Repainting)
Signals are generated **only on confirmed crossovers**:
✅ BUY Signal- HMA crosses above EMA
❌ SELL Signal-HMA crosses belowEMA
Signals do **not repaint** and appear only once per crossover.
🔸 Step 4: Visual Customization
Users can enable or disable:
* Moving average lines
* Colored MA zone fill
* Buy/Sell arrows
* Buy/Sell text labels
This allows the indicator to remain **minimal or detailed**, depending on user preference.
🔹 Key Features
✔ Non-repainting logic
✔ Clean crossover-based signals
✔ Customizable HMA & EMA lengths
✔ Optional MA zone fill
✔ Buy/Sell arrows & labels
✔ Works on all timeframes
✔ Beginner-friendly & scalper-ready
🔹 Best Use Cases
* Trend confirmation
* Momentum trading
* Scalping & intraday trading
* Swing trend filtering
For best results, combine with:
* Support & resistance
* Volume
* Higher-timeframe trend
🔹 Disclaimer
This indicator is provided for **educational purposes only**.
It is **not financial advice**. Always backtest and use proper risk management before trading live markets.
