TrueOpens [AY]¹ See how price reacts to key multi-day and monthly open levels—perfect for S/R-focused traders.
Experimental indicator for tracking multi-day openings and ICT True Month Open levels, ideal for S/R traders.
TrueOpens ¹ – Multi-Day & True Month Open Levels
This indicator is experimental and designed to help traders visually track opening price levels across multiple days, along with the ICT True Month Open (TMO).
Key Features:
Supports up to 12 configurable multi-day opening sessions, each with independent color, style, width, and label options.
Automatically detects the True Month Open using the ICT method (2nd Monday of each month) and plots it on the chart.
Lines can extend dynamically and are limited to a user-defined number of historical bars for clarity.
Fully customizable timezones, label sizes, and display options.
This indicator is ideal for observing how price interacts with key levels, especially for traders who favor support and resistance-based strategies.
Disclaimer: This is an analytical tool for observation purposes. It does not provide buy or sell signals. Users should combine it with their own analysis and risk management.
Indicadores e estratégias

MA Suite | Lyro RSMA Suite | Lyro RS
Overview
The MA Suite is a versatile moving average visualization tool designed for traders who demand clarity, flexibility, and actionable market signals. With support for over 16 different moving average types, built-in trend detection, dynamic coloring, and optional support/resistance & rejection markers, it transforms the humble MA into a fully-featured decision-making aid.
Key Features
Multi-Type Moving Averages
Choose from 16 MA calculations including SMA, EMA, WMA, VWMA, HMA, LSMA, FRAMA, KAMA, JMA, T3, and more.
Tailor responsiveness vs. smoothness to your strategy.
Trend Logic Modes
Source Above MA – Colors and signals are based on price position relative to the MA.
Rising MA – Colors and signals are determined by MA slope direction.
Support & Resistance Markers
Plots ▲ for potential support touches.
Plots ▼ for potential resistance touches when price interacts with the MA.
Rejection Signals
Flags bullish rejection when price bounces upward after an MA test.
Flags bearish rejection when price reverses downward after an MA test.
Plotted directly on the chart as labeled markers.
Customizable Color Palettes
Select from Classic, Mystic, Accented, or Royal themes.
Define custom bullish/bearish colors for complete visual control.
Glow & Styling Effects
Multi-layer glow lines around the MA enhance visibility.
Keeps charts clean while improving clarity.
How It Works
MA Calculation – Applies the chosen MA type to your selected price source.
Trend Coloring – Colors switch based on price position or MA slope logic.
Support/Resistance Detection – Identifies MA “touch” events with ▲ or ▼ markers.
Rejection Logic – Detects reversals after MA touches, adding bullish/bearish labels.
Practical Use
Trend Following – In “Source Above MA” mode, use color changes and crossovers to confirm bias.
Dynamic S/R – Use ▲ / ▼ markers to identify support or resistance in trending or ranging markets.
Reversal Opportunities – Monitor rejection labels for potential turning points against prevailing trend.
Customization
Select MA type and length to fine-tune indicator behavior.
Switch between trend modes for different trading styles.
Enable or disable S/R and rejection markers.
Personalize visuals with palette selection or custom colors.
⚠️Disclaimer
This indicator is a tool for technical analysis and does not provide guaranteed results. It should be used in conjunction with other analysis methods and proper risk management practices. The creators of this indicator are not responsible for any financial decisions made based on its signals.

Volume Profile Grid [Alpha Extract]A sophisticated volume distribution analysis system that transforms market activity into institutional-grade visual profiles, revealing hidden support/resistance zones and market participant behavior. Utilizing advanced price level segmentation, bullish/bearish volume separation, and dynamic range analysis, the Volume Profile Grid delivers comprehensive market structure insights with Point of Control (POC) identification, Value Area boundaries, and volume delta analysis. The system features intelligent visualization modes, real-time sentiment analysis, and flexible range selection to provide traders with clear, actionable volume-based market context.
🔶 Dynamic Range Analysis Engine
Implements dual-mode range selection with visible chart analysis and fixed period lookback, automatically adjusting to current market view or analyzing specified historical periods. The system intelligently calculates optimal bar counts while maintaining performance through configurable maximum limits, ensuring responsive profile generation across all timeframes with institutional-grade precision.
// Dynamic period calculation with intelligent caching
get_analysis_period() =>
if i_use_visible_range
chart_start_time = chart.left_visible_bar_time
current_time = last_bar_time
time_span = current_time - chart_start_time
tf_seconds = timeframe.in_seconds()
estimated_bars = time_span / (tf_seconds * 1000)
range_bars = math.floor(estimated_bars)
final_bars = math.min(range_bars, i_max_visible_bars)
math.max(final_bars, 50) // Minimum threshold
else
math.max(i_periods, 50)
🔶 Advanced Bull/Bear Volume Separation
Employs sophisticated candle classification algorithms to separate bullish and bearish volume at each price level, with weighted distribution based on bar intersection ratios. The system analyzes open/close relationships to determine volume direction, applying proportional allocation for doji patterns and ensuring accurate representation of buying versus selling pressure across the entire price spectrum.
🔶 Multi-Mode Volume Visualization
Features three distinct display modes for bull/bear volume representation: Split mode creates mirrored profiles from a central axis, Side by Side mode displays sequential bull/bear segments, and Stacked mode separates volumes vertically. Each mode offers unique insights into market participant behavior with customizable width, thickness, and color parameters for optimal visual clarity.
// Bull/Bear volume calculation with weighted distribution
for bar_offset = 0 to actual_periods - 1
bar_high = high
bar_low = low
bar_volume = volume
// Calculate intersection weight
weight = math.min(bar_high, next_level) - math.max(bar_low, current_level)
weight := weight / (bar_high - bar_low)
weighted_volume = bar_volume * weight
// Classify volume direction
if bar_close > bar_open
level_bull_volume += weighted_volume
else if bar_close < bar_open
level_bear_volume += weighted_volume
else // Doji handling
level_bull_volume += weighted_volume * 0.5
level_bear_volume += weighted_volume * 0.5
🔶 Point of Control & Value Area Detection
Implements institutional-standard POC identification by locating the price level with maximum volume accumulation, providing critical support/resistance zones. The Value Area calculation uses sophisticated sorting algorithms to identify the price range containing 70% of trading volume, revealing the market's accepted value zone where institutional participants concentrate their activity.
🔶 Volume Delta Analysis System
Incorporates real-time volume delta calculation with configurable dominance thresholds to identify significant bull/bear imbalances. The system visually highlights price levels where buying or selling pressure exceeds threshold percentages, providing immediate insight into directional volume flow and potential reversal zones through color-coded delta indicators.
// Value Area calculation using 70% volume accumulation
total_volume_sum = array.sum(total_volumes)
target_volume = total_volume_sum * 0.70
// Sort volumes to find highest activity zones
for i = 0 to array.size(sorted_volumes) - 2
for j = i + 1 to array.size(sorted_volumes) - 1
if array.get(sorted_volumes, j) > array.get(sorted_volumes, i)
// Swap and track indices for value area boundaries
// Accumulate until 70% threshold reached
for i = 0 to array.size(sorted_indices) - 1
accumulated_volume += vol
array.push(va_levels, array.get(volume_levels, idx))
if accumulated_volume >= target_volume
break
❓How It Works
🔶 Weighted Volume Distribution
Implements proportional volume allocation based on the percentage of each bar that intersects with price levels. When a bar spans multiple levels, volume is distributed proportionally based on the intersection ratio, ensuring precise representation of trading activity across the entire price spectrum without double-counting or volume loss.
🔶 Real-Time Profile Generation
Profiles regenerate on each bar close when in visible range mode, automatically adapting to chart zoom and scroll actions. The system maintains optimal performance through intelligent caching mechanisms and selective line updates, ensuring smooth operation even with maximum resolution settings and extended analysis periods.
🔶 Market Sentiment Analysis
Features comprehensive volume analysis table displaying total volume metrics, bullish/bearish percentages, and overall market sentiment classification. The system calculates volume dominance ratios in real-time, providing immediate insight into whether buyers or sellers control the current price structure with percentage-based sentiment thresholds.
🔶 Visual Profile Mapping
Provides multi-layered visual feedback through colored volume bars, POC line highlighting, Value Area boundaries, and optional delta indicators. The system supports profile mirroring for alternative perspectives, line extension for future reference, and customizable label positioning with detailed price information at critical levels.
Why Choose Volume Profile Grid
The Volume Profile Grid represents the evolution of volume analysis tools, combining traditional volume profile concepts with modern visualization techniques and intelligent analysis algorithms. By integrating dynamic range selection, sophisticated bull/bear separation, and multi-mode visualization with POC/Value Area detection, it provides traders with institutional-quality market structure analysis that adapts to any trading style. The comprehensive delta analysis and sentiment monitoring system eliminates guesswork while the flexible visualization options ensure optimal clarity across all market conditions, making it an essential tool for traders seeking to understand true market dynamics through volume-based price discovery.

Transfer Function Filter [theUltimator5]The Transfer Function Filter is an engineering style approach to transform the price action on a chart into a frequency, then filter out unwanted signals using Butterworth-style filter approach.
This indicator allows you to analyze market structure by isolating or removing different frequency components of price movement—similar to how engineers filter signals in control systems and electrical circuits.
🔎 Features
Four Filter Types
1) Low Pass Filter – Smooths price data, highlighting long-term trends while filtering out short-term noise. This filter acts similar to an EMA, removing noisy signals, resulting in a smooth curve that follows the price of the stock relative to the filter cutoff settings.
Real world application for low pass filter - Used in power supplies to provide a clean, stable power level.
2) High Pass Filter – Removes slow-moving trends to emphasize short-term volatility and rapid fluctuations. The high pass filter removes the "DC" level of the chart, removing the average price moves and only outputting volatility.
Real world application for high pass filter - Used in audio equalizers to remove low-frequency noise (like rumble) while allowing higher frequencies to pass through, improving sound clarity.
3) Band Pass Filter – Allows signals to plot only within a band of bar ranges. This filter removes the low pass "DC" level and the high pass "high frequency noise spikes" and shows a signal that is effectively a smoothed volatility curve. This acts like a moving average for volatility.
Real world application for band pass filter - Radio stations only allow certain frequency bands so you can change your radio channel by switching which frequency band your filter is set to.
4) Band Stop Filter – Suppresses specific frequency bands (cycles between two cutoffs). This filter allows through the base price moving average, but keeps the high frequency volatility spikes. It allows you to filter out specific time interval price action.
Real world application for band stop filter - If there is prominent frequency signal in the area which can cause unnecessary noise in your system, a band stop filter can cancel out just that frequency so you get everything else
Configurable Parameters
• Cutoff Periods – Define the cycle lengths (in bars) to filter. This is a bit counter-intuitive with the numbering since the higher the bar count on the low-pass filter, the lower the frequency cutoff is. The opposite holds true for the high pass filter.
• Filter Order – Adjust steepness and responsiveness (higher order = sharper filtering, but with more delay).
• Overlay Option – Display Low Pass & Band Stop outputs directly on the price chart, or in a separate pane. This is enabled by default, plotting the filters that mimic moving averages directly onto the chart.
• Source Selection – Apply filters to close, open, high, low, or custom sources.
Histograms for Comparison
• BS–LP Histogram – Shows distance between Band Stop and Low Pass filters.
• BP–HP Histogram – Highlights differences between Band Pass and High Pass filters.
Histograms give the visualization of a pseudo-MACD style indicator
Visual & Informational Aids
• Customizable colors for each filter line.
• Optional zero-line for histogram reference.
• On-chart info table summarizing active filters, cutoff settings, histograms, and filter order.
📊 Use Cases
Trend Detection – Use the Low Pass filter to smooth noise and follow underlying market direction.
Volatility & Cycle Analysis – Apply High Pass or Band Pass to capture shorter-term patterns.
Noise Suppression – Deploy Band Stop to remove specific choppy frequencies.
Momentum Insight – Watch the histograms to spot divergences and relative filter strength.

QFisher-R™ [ParadoxAlgo]QFISHER-R™ (Regime-Aware Fisher Transform)
A research/education tool that helps visualize potential momentum exhaustion and probable inflection zones using a quantitative, non-repainting Fisher framework with regime filters and multi-timeframe (MTF) confirmation.
What it does
Converts normalized price movement into a stabilized Fisher domain to highlight potential turning points.
Uses adaptive smoothing, robust (MAD/quantile) thresholds, and optional MTF alignment to contextualize extremes.
Provides a Reversal Probability Score (0–100) to summarize signal confluence (extreme, slope, cross, divergence, regime, and MTF checks).
Key features
Non-repainting logic (bar-close confirmation; security() with no lookahead).
Dynamic exhaustion bands (data-driven thresholds vs fixed ±2).
Adaptive smoothing (efficiency-ratio based).
Optional divergence tags on structurally valid pivots.
MTF confirmation (same logic computed on a higher timeframe).
Compact visuals with subtle plotting to reduce chart clutter.
Inputs (high level)
Source (e.g., HLC3 / Close / HA).
Core lookback, fast/slow range blend, and ER length.
Band sensitivity (robust thresholding).
MTF timeframe(s) and agreement requirement.
Toggle divergence & intrabar previews (default off).
Signals & Alerts
Turn Candidate (Up/Down) when multiple conditions align.
Trade-Grade Turn when score ≥ threshold and MTF agrees.
Divergence Confirmed when structural criteria are met.
Alerts are generated on confirmed bar close by default. Optional “preview” mode is available for experimentation.
How to use
Start on your preferred timeframe; optionally enable an HTF (e.g., 4×) for confirmation.
Look for RPS clusters near the exhaustion bands, slope inflections, and (optionally) divergences.
Combine with your own risk management, liquidity, and trend context.
Paper test first and calibrate thresholds to your instrument and timeframe.
Notes & limitations
This is not a buy/sell signal generator and does not predict future returns.
Readings can remain extreme during strong trends; use HTF context and your own filters.
Parameters are intentionally conservative by default; adjust carefully.
Compliance / Disclaimer
Educational & research tool only. Not financial advice. No recommendation to buy/sell any security or derivative.
Past performance, backtests, or examples (if any) are not indicative of future results.
Trading involves risk; you are responsible for your own decisions and risk management.
Built upon the Fisher Transform concept (Ehlers); all modifications, smoothing, regime logic, scoring, and visualization are original work by Paradox Algo.

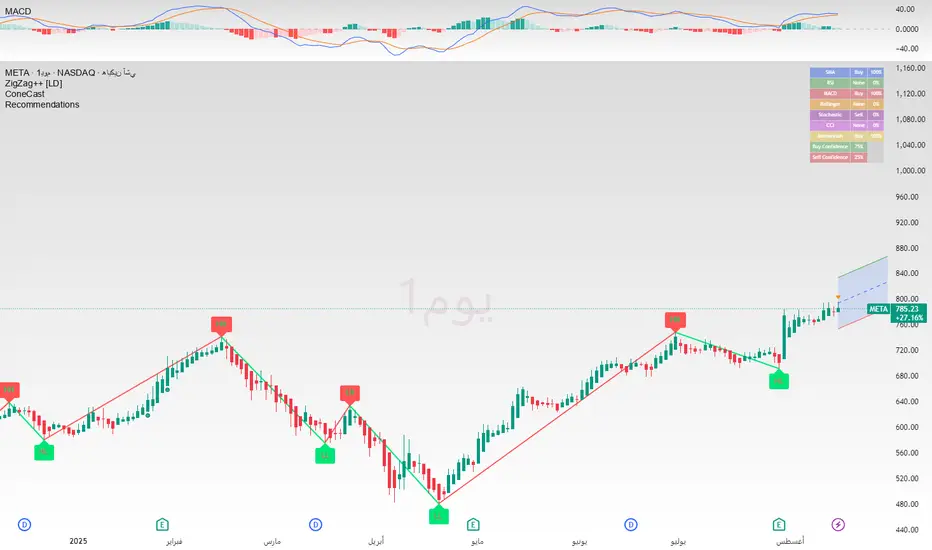
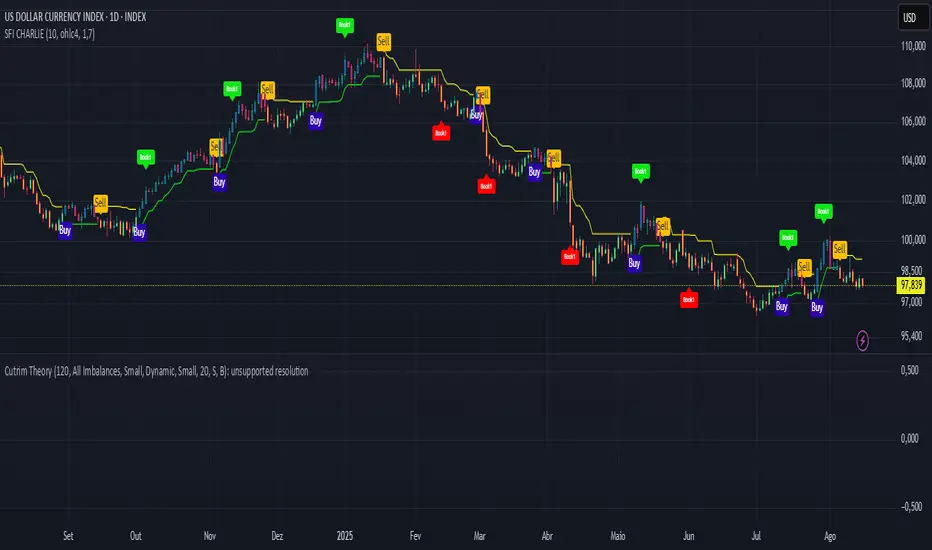
Recommendation Indicatorالوصف بالعربية
استراتيجية تداول مبنية على ٦ مؤشرات تأكيدية لرصد حركة السوق واتجاهه.
تعتمد على عدّ الشموع الصاعدة والهابطة المتتالية كعامل أساسي، وتدمج معها مؤشرات إضافية للتأكيد.
عند توافق المؤشرات معًا، يتم توليد إشارة شراء (BUY) أو بيع (SELL) واضحة على الرسم البياني.
هذا يعزز دقة الإشارات ويقلل من التذبذبات أو الإشارات الكاذبة، مما يجعلها مناسبة للمتداولين الباحثين عن قوة الاتجاه وتأكيده قبل الدخول في الصفقة.
🔎 ملاحظات الاستخدام
الاستراتيجية تحتوي على ٦ أدوات تأكيد مجتمعة لضمان إشارات أدق.
يُفضل استخدامها مع اختبار رجعي (Backtesting) قبل التداول الفعلي.
يمكن تعديل إعدادات المؤشرات لتناسب السوق أو الإطار الزمني المستخدم.
لا تعتبر توصية مالية مباشرة، وإنما أداة تعليمية وتجريبية.
---
📌 Description in English
A trading strategy built on 6 confirmation indicators to track market movements and trends.
It uses consecutive up and down bars as the core logic, combined with additional indicators for confirmation.
When all confirmations align, the strategy generates clear BUY or SELL signals on the chart.
This approach improves signal accuracy, reduces noise, and helps traders confirm market direction before entering a trade.
🔎 Usage Notes
The strategy incorporates 6 confirmation tools working together for higher accuracy.
Backtesting is recommended before applying it to live trading.
Indicator parameters can be adjusted to fit different markets and timeframes.
This is not financial advice, but an educational and experimental tool.
Body & Volume-Based Buy/Sell Signals (5min 1.5M Vol)Only for 5 min and Volume 1.5M
Conditions (Summarized)
🔹 BUY Signal
Previous candle is red: close < open
Current candle is green: close > open
Previous candle body is smaller than current:
abs(close - open ) < abs(close - open)
Previous candle body size ≥ 10 points
Both candles' volume ≥ minVolume (default: 2,000,000)
➜ Plot BUY below green candle
🔸 SELL Signal
Previous candle is green: close > open
Current candle is red: close < open
Previous candle body is smaller than current:
abs(close - open ) < abs(close - open)
Previous candle body size ≥ 10 points
Both candles' volume ≥ minVolume
➜ Plot SELL above red candle

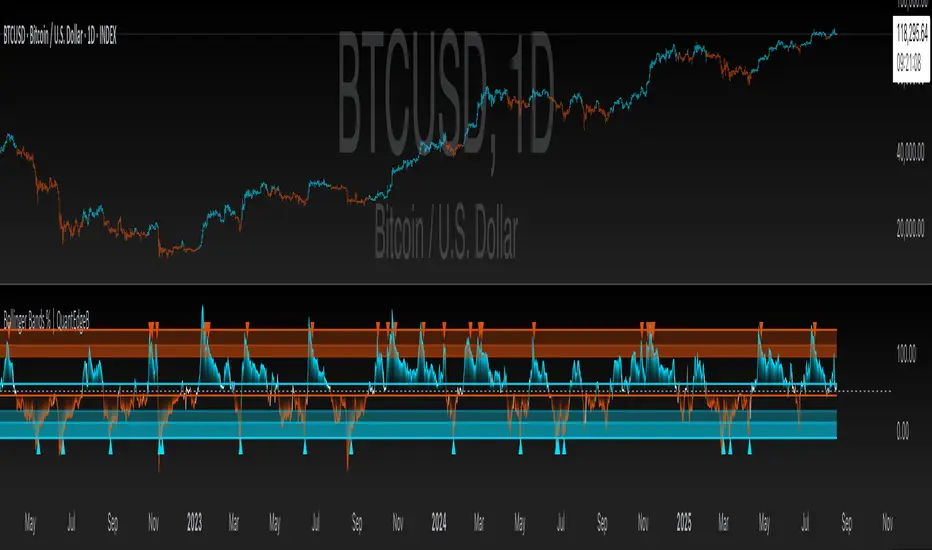
Bollinger Bands % | QuantEdgeB📊 Introducing Bollinger Bands % (BB%) by QuantEdgeB
🛠️ Overview
BB% | QuantEdgeB is a volatility-aware momentum tool that maps price within a Bollinger envelope onto a normalized scale. By letting you choose the base moving average (SMA, EMA, DEMA, TEMA, HMA, ALMA, EHMA, THMA, RMA, WMA, VWMA, T3, LSMA) and even Heikin-Ashi sources, it adapts to your style while keeping readings consistent across symbols and timeframes. Clear thresholds and color-coded visuals make it easy to spot emerging strength, fading moves, and potential mean-reversions.
✨ Key Features
• 🔹 Flexible Baseline
Pick from 12 MA types (plus Heikin-Ashi source option) to tailor responsiveness and smoothness.
• 🔹 Normalized Positioning
Price is expressed as a percentage of the band range, yielding an intuitive 0–100 style read (can exceed in extreme trends).
• 🔹 Actionable Thresholds
Default Long 55 / Short 45 levels provide simple, objective triggers.
• 🔹 Visual Clarity
Color-coded candles, shaded OB/OS zones, and adaptive color themes speed up decision-making.
• 🔹 Ready-to-Alert
Built-in alerts for long/short transitions.
📐 How It Works
1️⃣ Band Construction
A moving average (your choice) defines the midline; volatility (standard deviation) builds upper/lower bands.
2️⃣ Normalization
The indicator measures where price sits between the lower and upper band, scaling that into a bounded oscillator (BB%).
3️⃣ Signal Logic
• ✅ Long when BB% rises above 55 (strength toward the top of the envelope).
• ❌ Short when BB% falls below 45 (weakness toward the bottom).
4️⃣ OB/OS Context
Shaded regions above/below typical ranges highlight exhaustion and potential snap-backs.
⚙️ Custom Settings
• Base MA Type: SMA, EMA, DEMA, TEMA, HMA, ALMA, EHMA, THMA, RMA, WMA, VWMA, T3, LSMA
• Source Mode: Classic price or Heikin-Ashi (close/open/high/hlc3)
• Base Length: default 40
• Band Width: standard deviation-based (2× SD by default)
• Long / Short Thresholds: defaults 55 / 45
• Color Mode: Alpha, MultiEdge, TradingSuite, Premium, Fundamental, Classic, Warm, Cold, Strategy
• Candles & Labels: optional candle coloring and signal markers
👥 Ideal For
✅ Trend Followers — Ride strength as price compresses near the upper band.
✅ Swing/Mean-Reversion Traders — Fade extremes when BB% stretches into OB/OS zones.
✅ Multi-Timeframe Analysts — Compare band position consistently across periods.
✅ System Builders — Use BB% as a normalized feature for strategies and filters.
📌 Conclusion
BB% | QuantEdgeB delivers a clean, normalized read of price versus its volatility envelope—adaptable via rich MA/source options and easy to automate with thresholds and alerts.
🔹 Key Takeaways:
1️⃣ Normalized view of price inside the volatility bands
2️⃣ Flexible baseline (12+ MA choices) and Heikin-Ashi support
3️⃣ Straightforward 55/45 triggers with clear visual context
📌 Disclaimer: Past performance is not indicative of future results. No strategy guarantees success.
📌 Strategic Advice: Always backtest, tune parameters, and align with your risk profile before live trading.
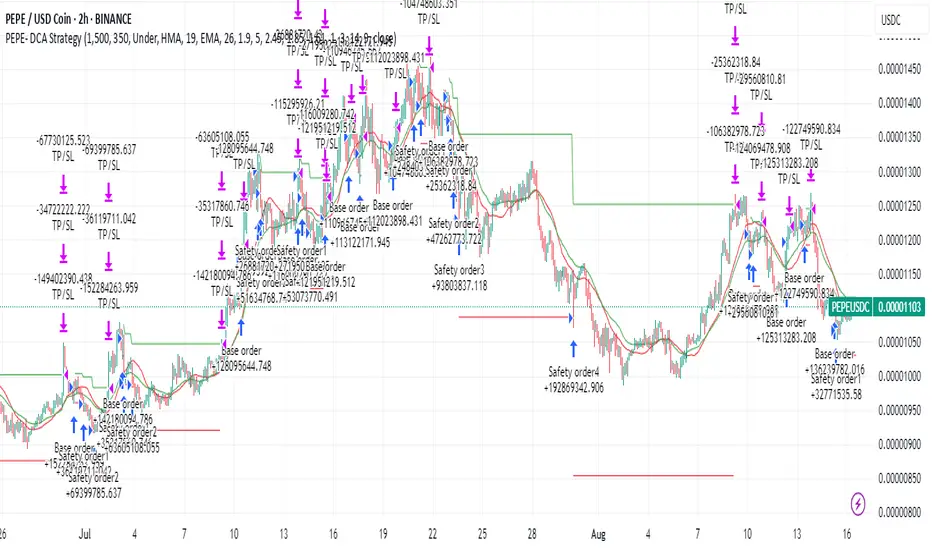
DCA Strategy on Steroids for CryptoThis strategy getting only in Long position for Crypto
Using Fast and Slow moving Averages and Stochastic RSI to get in Long position
Fast and Slow moving Averages - cross-under - I Prefer - or opposite for Bull Market
Stochastic RSI cross-over - 5 and Trend Determined by the Fast moving Average
There is no Stop loss is not for one with small tolerance to getting under
Fast and Slow moving Averages and Stochastic RSI Parameters can be adjust
The bot Use Safe Trades and Price Deviation Determined from the User
Max Safe Trades = 10
Take profit Parameters can be adjust in %
Pepe-USDC is just a example What the bot Can do
Ultimate Rejection BlocksThis indicator finds rejection blocks according to ICT concepts and marks out the equalibrium of the wick. Best used during killzone times and macro windows for top and bottom ticking.

Market Slayer Model 1.0This indicator only prints when a change in the state of delivery and breaker overlaps usually signaling a reversal if printed at the end of a swing high or swing low. Also added is standard deviation take profit projections which can be toggled on or off.

GrayZone Sniper [CHE] — Breakout Validation System GrayZone Sniper — Breakout Validation System
Trade only the clean breakouts. Detect the sideways “gray zone,” wait for a confirmed breach, and act only when momentum (TFRSI) and range expansion (Mean Deviation) align. Clear long/short triggers, one-shot exit signals, and persistent levels keep your manual trading disciplined and repeatable.
Why it boosts manual trading
* No guesswork: Grey box marks consolidation; you trade the validated break.
* Fewer fakeouts: Triggers require momentum + volatility—not just a wick through a level.
* Rules > bias: Optional close-only signals stop intrabar noise.
* Built-in exits: One-shot LS/SS (Long/Short Stop) when conditions degrade.
* Actionable visuals: Gray-zone boxes, persistent highs/lows, and a smooth T3 trendline.
What it does (short + precise)
1. Maps consolidation as a gray box (running high/low while state is neutral).
2. Validates breakouts only when:
* Mean Deviation filter says current range expands vs. its own baseline, and
* TFRSI momentum is above 50 + deadzone (long) or below 50 − deadzone (short), and
* Price closes beyond the last gray high/low (optional close-only).
→ You get L (long) or S (short).
3. Manages exits with a smooth T3 trendline plus MD trend: when MD weakens and T3 turns against the prior side, you get a single LS/SS stop signal.
4. Extends structure: Last gray-zone H/L can persist as right-extended levels for retests/targets.
5. Ready for alerts: Prebuilt alert conditions for L, S, LS, SS.
Signals at a glance
* L – Long Trigger (validated breakout up)
* S – Short Trigger (validated breakout down)
* LS – Long Stop (exit hint for open long)
* SS – Short Stop (exit hint for open short)
Why TFRSI + Mean Deviation is a killer combo
They measure different, complementary things—and that reduces correlated errors.
* Mean Deviation (MD) = range expansion filter. It checks whether current absolute deviation of Typical Price from its SMA (|TP − SMA(TP)|) is greater than its own historical mean deviation baseline. In plain English: *is the market actually moving beyond its usual wiggle?* If not, most breakouts are noise.
* TFRSI = directional momentum around a 50 baseline, normalized and smoothed to react fast while avoiding raw RSI twitchiness.
* Synergy:
* MD confirms there’s energy (volatility regime has expanded).
* TFRSI confirms where that energy points (bull or bear).
* Requiring both gives you high-quality, directional expansion—the exact condition that tends to produce follow-through, while filtering the classic “thin break, immediate snap-back.”
Result: Fewer trades, better quality. You skip most range breaks without momentum or momentum pops without real expansion.
Inputs & Functions (clean overview)
Core: TFRSI & MD
* TFRSI Length (`tfrsiLen`, default 6): Longer = smoother, slower.
* TFRSI Smoothing (`tfrsiSignalLen`, default 2): SMA on TFRSI for cleaner signals.
* Mean Deviation Period (`mdLen`, default 20): Baseline for expansion filter.
* Use classical MD (`useTaDev`, default off):
* Off: MD vs current SMA (warning-free internal baseline).
* On: Classical `ta.dev` implementation.
* TFRSI Deadzone ± around 50 (`tfrsiDeadzone`, default 1.0): Wider deadzone = stricter momentum confirmation (less chop).
Triggers & Logic
* Trigger only on bar close (`fireOnCloseOnly`, default on): Confirmed signals only; no intrabar flicker.
* Reset gray bounds after trigger (`resetGrayBoundsAfterTrigger`, default on): Clears last gray H/L once a trade triggers.
* Auto-deactivate on neutral (`autoDeactivateOnNeutral`, default off): Strict disarm when state flips back to neutral.
Gray-Zone Boxes
* Show boxes (`showGrayBoxes`, default on): Draws the neutral consolidation box.
* Max boxes (`maxGrayBoxes`, default 10): How many historic boxes to keep.
* Transparency (`boxFillTransp`/`boxBorderTransp`, defaults 85/30): Visual tuning.
Trendline (T3)
* T3 Length (`t3Length`, default 3): Smoothing depth (higher = smoother).
* T3 Volume Factor (`t3VolumeFactor`, default 0.7): Controls responsiveness of the T3 curve.
Persistent Levels
* Persist gray H/L (`saveGrayLevels`, default on): Extend last gray high/low to the right.
* Max saved level pairs (`maxSavedGrayLvls`, default 1): How many H/L pairs to keep.
* Reset levels on trigger (`resetLevelsOnTrig`, default off): Clean slate after new trigger.
Debug & Visuals
* Show debug markers (`showDebugMarkers`, default on): Display L/S/LS/SS in the pane.
* Show legend (`showLegend`, default on): Compact legend (top-right).
How to trade it (practical)
1. Keep close-only on. Let the market finish the candle.
2. Wait for a clean gray box. Let the range define itself.
3. Take only L/S triggers where MD filter passes and TFRSI confirms.
4. Use persistent levels for retests/partials/targets.
5. Respect LS/SS. When expansion fades and T3 turns, exit without debate.
Tuning tips:
* More chop? Increase `tfrsiDeadzone` or `mdLen`.
* Want faster entries? Slightly reduce `t3Length` or deadzone, but expect more noise.
* Works across assets/timeframes (crypto/FX/indices/equities).
Bottom line
GrayZone Sniper enforces a simple, robust rule: Don’t touch the market until it breaks a defined range with real expansion and aligned momentum. That’s why TFRSI + Mean Deviation is hard to beat—and why your manual breakout trades get cleaner, calmer, and more consistent.
Disclaimer:
The content provided, including all code and materials, is strictly for educational and informational purposes only. It is not intended as, and should not be interpreted as, financial advice, a recommendation to buy or sell any financial instrument, or an offer of any financial product or service. All strategies, tools, and examples discussed are provided for illustrative purposes to demonstrate coding techniques and the functionality of Pine Script within a trading context.
Any results from strategies or tools provided are hypothetical, and past performance is not indicative of future results. Trading and investing involve high risk, including the potential loss of principal, and may not be suitable for all individuals. Before making any trading decisions, please consult with a qualified financial professional to understand the risks involved.
By using this script, you acknowledge and agree that any trading decisions are made solely at your discretion and risk.
Enhance your trading precision and confidence with Triple Power Stop (CHE)! 🚀
Happy trading
Chervolino
GEXStrik BarS EUR USDGEX strike bars on the left side measure the prevailing amount of positive or negative gamma. On the right side, the volume of calls and puts traded in the region.

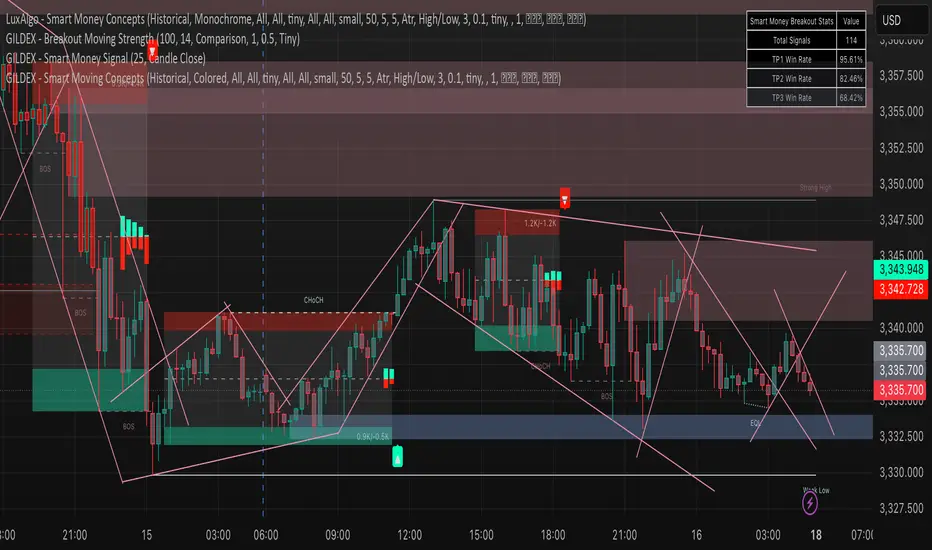
Smart Moving Concepts [GILDEX]This all-in-one indicator displays real-time market structure (internal & swing BOS / CHoCH), order blocks, premium & discount zones, equal highs & lows, and much more...allowing traders to automatically mark up their charts with widely used price action methodologies. Following the release of our Fair Value Gap script, we received numerous requests from our community to release more features in the same category.
"Smart Money Concepts" (SMC) is a fairly new yet widely used term amongst price action traders looking to more accurately navigate liquidity & find more optimal points of interest in the market. Trying to determine where institutional market participants have orders placed (buy or sell side liquidity) can be a very reasonable approach to finding more practical entries & exits based on price action.
The indicator includes alerts for the presence of swing structures and many other relevant conditions.
Features
This indicator includes many features relevant to SMC, these are highlighted below:
Full internal & swing market structure labeling in real-time
Break of Structure (BOS)
Change of Character (CHoCH)
Order Blocks (bullish & bearish)
Equal Highs & Lows
Fair Value Gap Detection
Previous Highs & Lows
Premium & Discount Zones as a range
Options to style the indicator to more easily display these concepts
Settings
Mode: Allows the user to select Historical (default) or Present, which displays only recent data on the chart.
Style: Allows the user to select different styling for the entire indicator between Colored (default) and Monochrome.
Color Candles: Plots candles based on the internal & swing structures from within the indicator on the chart.
Internal Structure: Displays the internal structure labels & dashed lines to represent them. (BOS & CHoCH).
Confluence Filter: Filter non-significant internal structure breakouts.
Swing Structure: Displays the swing structure labels & solid lines on the chart (larger BOS & CHoCH labels).
Swing Points: Displays swing points labels on chart such as HH, HL, LH, LL.
Internal Order Blocks: Enables Internal Order Blocks & allows the user to select how many most recent Internal Order Blocks appear on the chart.
Swing Order Blocks: Enables Swing Order Blocks & allows the user to select how many most recent Swing Order Blocks appear on the chart.
Equal Highs & Lows: Displays EQH/EQL labels on chart for detecting equal highs & lows.
Bars Confirmation: Allows the user to select how many bars are needed to confirm an EQH/EQL symbol on chart.
Fair Value Gaps: Displays boxes to highlight imbalance areas on the chart.
Auto Threshold: Filter out non-significant fair value gaps.
Timeframe: Allows the user to select the timeframe for the Fair Value Gap detection.
Extend FVG: Allows the user to choose how many bars to extend the Fair Value Gap boxes on the chart.
Highs & Lows MTF: Allows the user to display previous highs & lows from daily, weekly, & monthly timeframes as significant levels.
Premium/Discount Zones: Allows the user to display Premium, Discount, and Equilibrium zones on the chart
Intraday Spark Chart [AstrideUnicorn]The Intraday Spark Chart (ISC) is a minimalist yet powerful tool designed to track an asset’s performance relative to its daily opening price. Inspired by Nasdaq's trading-floor analog dashboards, it visualizes intraday percentage changes as a color-coded sparkline, helping traders quickly gauge momentum and session bias.
Ideal for: Day trading, scalping, and multi-asset monitoring.
Best paired with: 1m to 4H timeframes (auto-warns on higher TFs).
Key metrics:
Real-time % change from daily open.
Final daily % change (updated at session close).
Daily open price labels for orientation.
HOW TO USE
Visual Guide
Sparkline Plot:
A green area/line indicates price is above the daily open (bullish).
A red area/line signals price is below the daily open (bearish).
The baseline (0%) represents the daily open price.
Session Markers:
The dotted vertical lines separate trading days.
Gray labels near the baseline show the exact daily open price at the start of each session.
Dynamic Labels:
The labels in the upper left corner of each session range display the current (or final) daily % change. Color matches the trend (green/red) for instant readability.
Practical Use Cases
Opening Range Breakouts: Spot early momentum by observing how price reacts to the daily open.
Multi-Asset Screening: Compare intraday strength across symbols by choosing an asset in the indicator settings panel.
Session Close Prep: Anticipate daily settlement by tracking the final % change (useful for futures/swing traders).
SETTINGS
Asset (Input Symbol) : Defaults to the current chart symbol. Choose any asset to monitor its price action without switching charts - ideal for intermarket analysis or correlation tracking.

Recommendation Indicatorالوصف بالعربية
استراتيجية تداول مبنية على ٦ مؤشرات تأكيدية لرصد حركة السوق واتجاهه.
تعتمد على عدّ الشموع الصاعدة والهابطة المتتالية كعامل أساسي، وتدمج معها مؤشرات إضافية للتأكيد.
عند توافق المؤشرات معًا، يتم توليد إشارة شراء (BUY) أو بيع (SELL) واضحة على الرسم البياني.
هذا يعزز دقة الإشارات ويقلل من التذبذبات أو الإشارات الكاذبة، مما يجعلها مناسبة للمتداولين الباحثين عن قوة الاتجاه وتأكيده قبل الدخول في الصفقة.
🔎 ملاحظات الاستخدام
الاستراتيجية تحتوي على ٦ أدوات تأكيد مجتمعة لضمان إشارات أدق.
يُفضل استخدامها مع اختبار رجعي (Backtesting) قبل التداول الفعلي.
يمكن تعديل إعدادات المؤشرات لتناسب السوق أو الإطار الزمني المستخدم.
لا تعتبر توصية مالية مباشرة، وإنما أداة تعليمية وتجريبية.
---
📌 Description in English
A trading strategy built on 6 confirmation indicators to track market movements and trends.
It uses consecutive up and down bars as the core logic, combined with additional indicators for confirmation.
When all confirmations align, the strategy generates clear BUY or SELL signals on the chart.
This approach improves signal accuracy, reduces noise, and helps traders confirm market direction before entering a trade.
🔎 Usage Notes
The strategy incorporates 6 confirmation tools working together for higher accuracy.
Backtesting is recommended before applying it to live trading.
Indicator parameters can be adjusted to fit different markets and timeframes.
This is not financial advice, but an educational and experimental tool.

Becak I-series: Indicator Floating Panels v.80Becak I-series: Floating Panels v.80th (Indonesia Independence Days)
What it does:
This indicator creates three floating overlay panels that display MACD, RSI, and Stochastic oscillators directly on your price chart. Unlike traditional separate panes, these panels hover over your chart with customizable positioning and transparency, providing a clean, space-efficient way to monitor multiple technical indicators simultaneously.
When to use:
When you need to monitor momentum, trend strength, and overbought/oversold conditions without cluttering your workspace
Perfect for traders who want quick visual access to multiple oscillators while maintaining focus on price action
Ideal for any timeframe and asset class (stocks, crypto, forex, commodities)
How it works:
The script calculates standard MACD (12,26,9), RSI (14), and Stochastic (14,3,3) values, then renders them as floating panels with:
MACD Panel: Shows MACD line (blue), Signal line (orange), and histogram (green/red bars)
RSI Panel: Displays RSI line (purple) with overbought (70) and oversold (30) reference levels
Stochastic Panel: Shows %K (blue) and %D (orange) lines with optional buy/sell signals and highlighted overbought/oversold zones
Customization options:
Position: Choose Top, Bottom, or Auto-Center placement
Size: Adjust panel height (15-35% of chart) and spacing between panels
Positioning: Fine-tune vertical center offset and horizontal positioning
Appearance: Toggle panel backgrounds and adjust transparency (50-95%)
Parameters: Modify all indicator lengths and overbought/oversold levels
Signals: Enable/disable Stochastic crossover signals
Display: Control lookback period (30-100 bars) and right margin spacing
Universal compatibility: Works seamlessly across all asset types with automatic range detection and scaling.
DIRGAHAYU HARI KEMERDEKAAN KE 80 - INDONESIA ... MERDEKA!!!!!

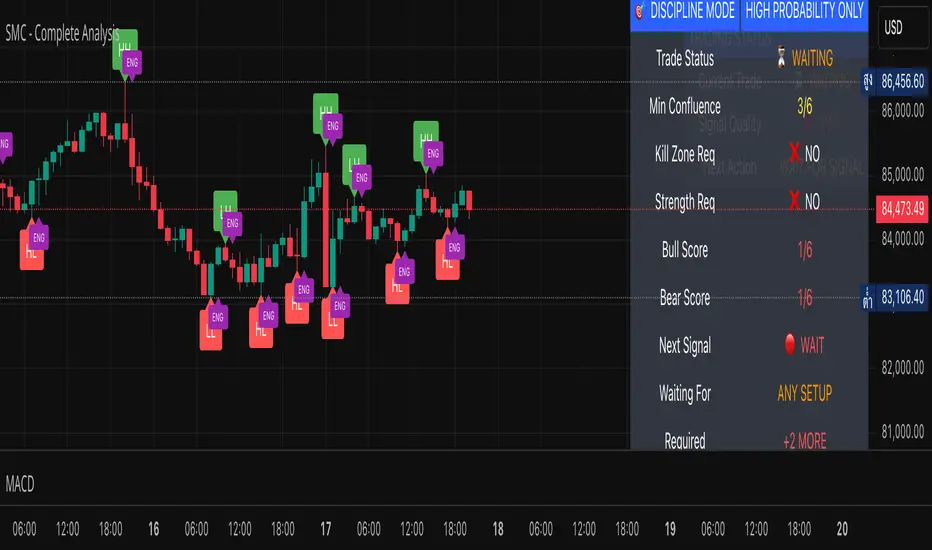
SMC - Complete AnalysisMC COMPLETE TRADING SYSTEM
📊 OVERVIEW
Professional Smart Money Concepts indicator with automated BUY/SELL signals, Entry/SL/TP prices, and 4-level market analysis for disciplined trading.
🎯 MAIN FEATURES
🟢 BUY/🔴 SELL Signals - Clear entry signals with exact prices
📍 ENTRY/SL/TP - Automated price calculations
🎪 Discipline Mode - High-probability setups only
⚡ Confluence Scoring - 6-factor signal validation
🏗️ 4 ANALYSIS LEVELS
Level 1: Market Structure
BOS/CHoCH/MSS detection
Displacement & Range analysis
Internal structure mapping
Level 2: Time-Based
Kill Zones (Asian/London/NY)
Session tracking
Daily/Weekly levels
Level 3: Entry & Risk
Smart entry triggers
Auto risk calculator
Target projections
Level 4: Advanced Analytics
Auto Fibonacci levels
Trend line detection
Smart money flow analysis
Strength meter
⚙️ SETTINGS
Default (Relaxed for more signals):
Minimum Confluence: 3/6
Kill Zone Required: OFF
Strength Bias Required: OFF
Risk per Trade: 2%
Risk:Reward: 3:1
📈 RECOMMENDED PAIRS
EURUSD (Beginners)
GBPUSD (Experienced)
XAUUSD (Best SMC signals)
EURJPY (Good structure)
⏰ BEST TIMEFRAMES
H1 - Recommended balance
H4 - High quality signals
M30 - More frequent signals
🎯 TRADING RULES
Trade ONLY on BUY/SELL signals
Use exact ENTRY/SL/TP prices
Set orders immediately
Wait for SL HIT or TP HIT
No modifications allowed
🔒 DISCIPLINE MODE
Shows signals only when confluence ≥3/6
All other features hidden by default
Simple status table
Forces disciplined trading
💡 USAGE
Wait for BUY or SELL signal
Note ENTRY/SL/TP prices
Execute trade exactly as shown
Hold until exit signal
Repeat
⚠️ IMPORTANT
No signal = No trading
2% risk maximum per trade
London/NY sessions preferred
Patience is key to success
🚀 Professional SMC system for consistent profitability through disciplined trading!
The Barking Rat LiteMomentum & FVG Reversion Strategy
The Barking Rat Lite is a disciplined, short-term mean-reversion strategy that combines RSI momentum filtering, EMA bands, and Fair Value Gap (FVG) detection to identify short-term reversal points. Designed for practical use on volatile markets, it focuses on precise entries and ATR-based take profit management to balance opportunity and risk.
Core Concept
This strategy seeks potential reversals when short-term price action shows exhaustion outside an EMA band, confirmed by momentum and FVG signals:
EMA Bands:
Parameters used: A 20-period EMA (fast) and 100-period EMA (slow).
Why chosen:
- The 20 EMA is sensitive to short-term moves and reflects immediate momentum.
- The 100 EMA provides a slower, structural anchor.
When price trades outside both bands, it often signals overextension relative to both short-term and medium-term trends.
Application in strategy:
- Long entries are only considered when price dips below both EMAs, identifying potential undervaluation.
- Short entries are only considered when price rises above both EMAs, identifying potential overvaluation.
This dual-band filter avoids counter-trend signals that would occur if only a single EMA was used, making entries more selective..
Fair Value Gap Detection (FVG):
Parameters used: The script checks for dislocations using a 12-bar lookback (i.e. comparing current highs/lows with values 12 candles back).
Why chosen:
- A 12-bar displacement highlights significant inefficiencies in price structure while filtering out micro-gaps that appear every few bars in high-volatility markets.
- By aligning FVG signals with candle direction (bullish = close > open, bearish = close < open), the strategy avoids random gaps and instead targets ones that suggest exhaustion.
Application in strategy:
- Bullish FVGs form when earlier lows sit above current highs, hinting at downward over-extension.
- Bearish FVGs form when earlier highs sit below current lows, hinting at upward over-extension.
This gives the strategy a structural filter beyond simple oscillators, ensuring signals have price-dislocation context.
RSI Momentum Filter:
Parameters used: 14-period RSI with thresholds of 80 (overbought) and 20 (oversold).
Why chosen:
- RSI(14) is a widely recognized momentum measure that balances responsiveness with stability.
- The thresholds are intentionally extreme (80/20 vs. the more common 70/30), so the strategy only engages at genuine exhaustion points rather than frequent minor corrections.
Application in strategy:
- Longs trigger when RSI < 20, suggesting oversold exhaustion.
- Shorts trigger when RSI > 80, suggesting overbought exhaustion.
This ensures entries are not just technically valid but also backed by momentum extremes, raising conviction.
ATR-Based Take Profit:
Parameters used: 14-period ATR, with a default multiplier of 4.
Why chosen:
- ATR(14) reflects the prevailing volatility environment without reacting too much to outliers.
- A multiplier of 4 is a pragmatic compromise: wide enough to let trades breathe in volatile conditions, but tight enough to enforce disciplined exits before mean reversion fades.
Application in strategy:
- At entry, a fixed target is set = Entry Price ± (ATR × 4).
- This target scales automatically with volatility: narrower in calm periods, wider in explosive markets.
By avoiding discretionary exits, the system maintains rule-based discipline.
Visual Signals on Chart
Blue “▲” below candle: Potential long entry
Orange/Yellow “▼” above candle: Potential short entry
Green “✔️”: Trade closed at ATR take profit
Blue (20 EMA) & Orange (100 EMA) lines: Dynamic channel reference
⚙️Strategy report properties
Position size: 25% equity per trade
Initial capital: 10,000.00 USDT
Pyramiding: 10 entries per direction
Slippage: 2 ticks
Commission: 0.055% per side
Backtest timeframe: 1-minute
Backtest instrument: HYPEUSDT
Backtesting range: Jul 28, 2025 — Aug 17, 2025
Note on Sample Size:
You’ll notice the report displays fewer than the ideal 100 trades in the strategy report above. This is intentional. The goal of the script is to isolate high-quality, short-term reversal opportunities while filtering out low-conviction setups. This means that the Barking Rat Lite strategy is very selective, filtering out over 90% of market noise. The brief timeframe shown in the strategy report here illustrates its filtering logic over a short window — not its full capabilities. As a result, even on lower timeframes like the 1-minute chart, signals are deliberately sparse — each one must pass all criteria before triggering.
For a larger dataset:
Once the strategy is applied to your chart, users are encouraged to expand the lookback range or apply the strategy to other volatile pairs to view a full sample.
💡Why 25% Equity Per Trade?
While it's always best to size positions based on personal risk tolerance, we defaulted to 25% equity per trade in the backtesting data — and here’s why:
Backtests using this sizing show manageable drawdowns even under volatile periods.
The strategy generates a sizeable number of trades, reducing reliance on a single outcome.
Combined with conservative filters, the 25% setting offers a balance between aggression and control.
Users are strongly encouraged to customize this to suit their risk profile.
What makes Barking Rat Lite valuable
Combines multiple layers of confirmation: EMA bands + FVG + RSI
Adaptive to volatility: ATR-based exits scale with market conditions
Clear, actionable visuals: Easy to monitor and manage trades

Mutanabby_AI | ATR+ | Trend-Following StrategyThis document presents the Mutanabby_AI | ATR+ Pine Script strategy, a systematic approach designed for trend identification and risk-managed position entry in financial markets. The strategy is engineered for long-only positions and integrates volatility-adjusted components to enhance signal robustness and trade management.
Strategic Design and Methodological Basis
The Mutanabby_AI | ATR+ strategy is constructed upon a foundation of established technical analysis principles, with a focus on objective signal generation and realistic trade execution.
Heikin Ashi for Trend Filtering: The core price data is processed via Heikin Ashi (HA) methodology to mitigate transient market noise and accentuate underlying trend direction. The script offers three distinct HA calculation modes, allowing for comparative analysis and validation:
Manual Calculation: Provides a transparent and deterministic computation of HA values.
ticker.heikinashi(): Utilizes TradingView's built-in function, employing confirmed historical bars to prevent repainting artifacts.
Regular Candles: Allows for direct comparison with standard OHLC price action.
This multi-methodological approach to trend smoothing is critical for robust signal generation.
Adaptive ATR Trailing Stop: A key component is the Average True Range (ATR)-based trailing stop. ATR serves as a dynamic measure of market volatility. The strategy incorporates user-defined parameters (
Key Value and ATR Period) to calibrate the sensitivity of this trailing stop, enabling adaptation to varying market volatility regimes. This mechanism is designed to provide a dynamic exit point, preserving capital and locking in gains as a trend progresses.
EMA Crossover for Signal Generation: Entry and exit signals are derived from the interaction between the Heikin Ashi derived price source and an Exponential Moving Average (EMA). A crossover event between these two components is utilized to objectively identify shifts in momentum, signaling potential long entry or exit points.
Rigorous Stop Loss Implementation: A critical feature for risk mitigation, the strategy includes an optional stop loss. This stop loss can be configured as a percentage or fixed point deviation from the entry price. Importantly, stop loss execution is based on real market prices, not the synthetic Heikin Ashi values. This design choice ensures that risk management is grounded in actual market liquidity and price levels, providing a more accurate representation of potential drawdowns during backtesting and live operation.
Backtesting Protocol: The strategy is configured for realistic backtesting, employing fill_orders_on_standard_ohlc=true to simulate order execution at standard OHLC prices. A configurable Date Filter is included to define specific historical periods for performance evaluation.
Data Visualization and Metrics: The script provides on-chart visual overlays for buy/sell signals, the ATR trailing stop, and the stop loss level. An integrated information table displays real-time strategy parameters, current position status, trend direction, and key price levels, facilitating immediate quantitative assessment.
Applicability
The Mutanabby_AI | ATR+ strategy is particularly suited for:
Cryptocurrency Markets: The inherent volatility of assets such as #Bitcoin and #Ethereum makes the ATR-based trailing stop a relevant tool for dynamic risk management.
Systematic Trend Following: Individuals employing systematic methodologies for trend capture will find the objective signal generation and rule-based execution aligned with their approach.
Pine Script Developers and Quants: The transparent code structure and emphasis on realistic backtesting provide a valuable framework for further analysis, modification, and integration into broader quantitative models.
Automated Trading Systems: The clear, deterministic entry and exit conditions facilitate integration into automated trading environments.
Implementation and Evaluation
To evaluate the Mutanabby_AI | ATR+ strategy, apply the script to your chosen chart on TradingView. Adjust the input parameters (Key Value, ATR Period, Heikin Ashi Method, Stop Loss Settings) to observe performance across various asset classes and timeframes. Comprehensive backtesting is recommended to assess the strategy's historical performance characteristics, including profitability, drawdown, and risk-adjusted returns.
I'd love to hear your thoughts, feedback, and any optimizations you discover! Drop a comment below, give it a like if you find it useful, and share your results.

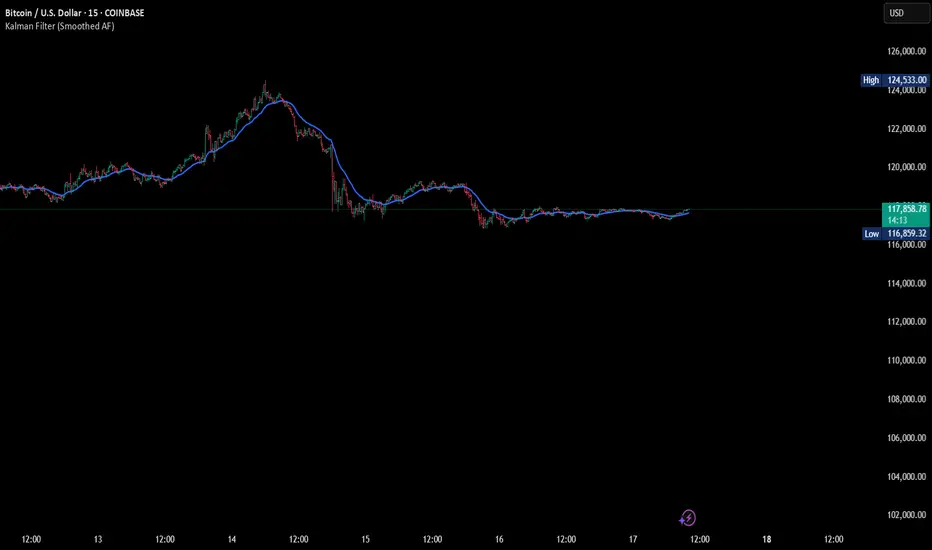
Kalman Filter (Smoothed)The Kalman Filter is a recursive statistical algorithm that smooths noisy price data while adapting dynamically to new information. Unlike simple moving averages or EMAs, it minimizes lag by balancing measurement noise (R) and process noise (Q), giving traders a clean, adaptive estimate of true price action.
🔹 Core Features
Real-time recursive estimation
Adjustable noise parameters (R = sensitivity to price, Q = smoothness vs. responsiveness)
Reduces market noise without heavy lag
Overlay on chart for direct comparison with raw price
🔹 Trading Applications
Smoother trend visualization compared to traditional MAs
Spotting true direction during volatile/sideways markets
Filtering out market “whipsaws” for cleaner signals
Building blocks for advanced quant/trading models
⚠️ Note: The Kalman Filter is a state-space model; it doesn’t predict future price, but smooths past and present data into a more reliable signal.
Smart Pattern Scanner ProSmart Pattern Scanner Pro — Trainer’s Guide (Step-by-Step)
1) What this tool does
Smart Pattern Scanner Pro (SPS Pro) scans multiple timeframes at once for classic candlestick patterns, filters them by trend, and presents everything in a clean table with price, signal direction, volume context, a “Vol Strength” progress bar, and a human-friendly timestamp. It also composes a single alert message when one or more patterns are found on the latest bar close.
________________________________________
2) The table at a glance (how to read one row)
Each row = one timeframe (e.g., 5m, 15m, 1h, 4h, Daily, Weekly)
• Timeframe – Shown with a readable name (“5 Minutes”, “1 Hour”, “Daily”, etc.).
• Price – The latest close at the moment the pattern is confirmed on that timeframe.
• Pattern – The first qualifying pattern detected on the last confirmed bar of that timeframe (or “—” if none).
• Signal –
o 🟢 ▲ = Bullish
o 🔴 ▼ = Bearish
o 🔵 ◆ = Neutral (e.g., Doji/Spinning Top)
• Buy Vol / Sell Vol (optional) – A rough split of volume for the most recent closed candle on that timeframe (up-close volume vs. down-close volume).
• Vol Strength (optional) – A 10-block text bar showing Total Volume ÷ SMA(Volume); quick read:
o ~0–1.0: muted activity
o 1.0: above average
o 1.5: notably elevated
• Time – The end time of the bar in your selected Timezone (Exchange by default).
If a timeframe shows “—” under Pattern, it simply means no eligible pattern was confirmed on the last completed candle for that TF.
________________________________________
3) Inputs & customization (what each section controls)
📊 Table Settings
• Table Position – Choose where the table sits on the chart (Top/Middle/Bottom + Left/Center/Right).
• Table Size – Controls the text size for all table cells.
• Show Volume Analysis – Toggles Buy Vol / Sell Vol columns.
• Show Progress Indicators – Toggles the Vol Strength column.
• Timezone – Set to Exchange, or override it to view timestamps in your local preference.
🎨 Color Theme
• Bullish / Bearish / Neutral colors – Control signal and highlight accents.
• Volume Up / Volume Down colors – Control the colors of the volume numbers and the Vol Strength bar.
• Backgrounds, borders, and text use a professional dark palette for contrast and readability.
⏱️ Timeframes
• Timeframes (comma-separated) – e.g., 5,15,60,240,1D,1W
Valid entries: 1,3,5,15,30,60,120,240,480,720,1D/D,1W/W,1M/M,3M
The scanner will create one row per timeframe.
📈 Technical Analysis
• Detect Trend Based on SMA – If on, patterns are trend-qualified using an SMA gate:
o Uptrend (uTrd) = close > SMA(maLen)
o Downtrend (dTrd) = close < SMA(maLen)
• SMA Length (maLen) – Length for the trend SMA gate (default 50).
• Volume MA Length (volMaLen) – SMA length used to compute Vol Strength.
🕯️ Pattern Selection
• Pattern Type – Scan Bullish, Bearish, or Both.
• Checkboxes – Turn specific patterns on/off (Engulfing, Morning/Evening Stars, Three Soldiers/Crows, Doji family, Hammers, Tasuki Gaps, Windows, Harami, Piercing/Dark Cloud, etc.).
Tip: For faster performance, disable patterns you don’t use.
________________________________________
4) How detection actually works (under the hood)
1. Per-timeframe scanning
The script iterates through your list of timeframes. For each TF it calls the detection engine via request.security(…tf…, main(true)) so that the logic runs natively on that timeframe.
2. Trend qualifier (optional)
If Detect Trend Based on SMA is enabled:
o Bullish patterns often require the recent context to be at/after downtrend (e.g., a reversal) or during an uptrend depending on the pattern.
o Bearish patterns similarly check for uTrd/dTrd.
You’ll notice some checks use offsets like , , to ensure the trend context existed before the current bar, making signals more realistic.
3. First-match wins
Inside each TF scan, patterns are checked in a fixed order. The code assigns the first eligible pattern to the row and ignores subsequent ones for that bar. This keeps rows clean and avoids double-signaling.
4. Confirmed bar only
The script saves a pattern only when the bar is confirmed (barstate.isconfirmed), reducing the “painting” of signals that vanish before close.
Important: For higher TFs, the table won’t update that TF’s row until its bar closes. E.g., a Daily pattern appears only after the daily candle closes.
5. Volume context
o BuyVol = TF volume if that TF bar closed up, else 0
o SellVol = TF volume if that TF bar closed down, else 0
o VolRatio = TF total volume ÷ SMA(volume, volMaLen)
That ratio feeds the Vol Strength bar for quick “is today active?” context.
6. Time formatting
The time shown is the end time of the TF bar, formatted to your Timezone input (Exchange by default). Intraday TFs show HH:mm; higher TFs show a clean date or time per your settings.
________________________________________
5) Alerts — how they’re built and how to use them
• On each bar close, SPS Pro assembles one multiline alert if any timeframe reported a pattern.
Example format:
• 🎯 Pattern Alert - NIFTY
• ├ 15: Engulfing (Bull) @ 24650.20
• ├ 60: Dark Cloud (Bear) @ 24580.90
• └─────────────
• To receive alerts in TradingView:
1. Add the indicator to your chart.
2. Click Create Alert.
3. In the Condition, choose “Any alert() function call” for this script.
4. Set “Once per bar close” (recommended, matches the script).
5. Choose your delivery channels and save.
________________________________________
6) Practical workflows (for new traders)
A) Intraday momentum trade (scalp/day trade)
1. Set TFs to 5,15,60.
2. Enable Engulfing, Hammer/Hanging Man, Morning/Evening Star, Shooting Star, Doji.
3. Keep Trend Based on SMA ON (SMA 50).
4. Wait for 5m + 15m to align in the same direction (both 🟢 or both 🔴).
5. Prefer entries when Vol Strength > 1.0 on the entry TF.
6. Place stop beyond the pattern’s invalidation (e.g., below Hammer low for long).
7. Scale out near prior intraday S/R; trail stops.
B) Swing reversal trade
1. Use higher TFs: 60,240,1D,1W.
2. Focus on Rising/Falling Three Methods, Morning/Evening (Doji) Stars, Three Soldiers/Crows.
3. Look for a fresh pattern on 4h or Daily, ideally with Vol Strength > 1.3.
4. Confirm confluence with structure (trendlines, weekly levels).
5. Plan wider stops and multi-day hold; review news/catalysts.
C) News avoidance & confirmation
• If Vol Strength spikes without a clean pattern, consider standing aside or waiting for the next bar to avoid whipsaw.
• When a pattern appears with a strong Vol Strength bar, it often signals attention-worthy activity—still validate with your own plan.
________________________________________
7) Best-practice interpretation tips
• Confluence beats single signals. Two TFs pointing the same way + decent Vol Strength is more reliable than a lone 5m signal.
• Neutral patterns (Doji/Spinning Top) are context markers, not trade triggers by themselves. Wait for follow-through.
• Trend gate matters. Keeping SMA gating ON reduces counter-trend noise.
• Bars must close. Remember: higher-TF rows only change after that TF bar closes.
• “First-match wins” means the order of checks matters. You can reorder or disable patterns to fit your style.
________________________________________
8) Performance & limits (TradingView realities)
• You’re scanning several TFs, running many pattern checks. Disable unused patterns or trim TFs if you hit resource limits.
• dynamic_requests=true helps, but extreme combinations (lots of TFs + all patterns + small chart TF) can still be heavy.
• If an exchange symbol’s volume behaves oddly, re-check Volume MA Length and your Timezone for clarity.
________________________________________
9) Common FAQs & troubleshooting
• “Why do I see ‘—’ on some rows?”
No qualifying pattern on the last closed bar of that TF, or your trend gate filtered it out.
• “Why are some signals late?”
Signals appear only on bar close (by design). That’s deliberate to avoid premature triggers.
• “My alert didn’t fire.”
Make sure the chart has an active alert set to “Any alert() function call” for this script and your alert frequency is Once per bar close.
• “Can I change the strength thresholds?”
Yes—edit the line that colors Vol Strength (currently >1.5 = stronger). Adjust to your preference.
• “I want more than one pattern per TF.”
This version stores one (the first match). You can adapt the logic to collect multiple, but keep the UI readable.
________________________________________
10) Suggested training exercises for new traders
1. Replay Mode drill – On a liquid symbol, step through 2 weeks of 5m/15m data. Log which SPS signals would you take/skip and why.
2. Confluence journal – Require at least two TFs aligned. Track outcomes for 20 trades.
3. Vol Strength filter – Only act when Vol Strength > 1.2. Compare results vs. no filter.
4. Pattern-specific week – Trade only Engulfing setups for one week (paper trading), then only Stars next week. Learn the nuances.
5. Risk practice – Fix risk at 0.5–1R per trade. Journal adherence to stops and take-profits.
________________________________________
11) Advanced customization ideas (optional)
• Re-order pattern checks to favor your preferred setups.
• Tighten/loosen trend gates (e.g., require uTrd and uTrd around breakout patterns).
• Add a score column (e.g., +2 for multi-TF alignment, +1 for Vol Strength >1.3, −1 if Neutral on higher TF).
• Map “Body/Header/Title” text sizes to table sizes if you want more granular typography (current code uses the overall Table Size).
________________________________________
12) Strict disclaimer (aiTrendview)
aiTrendview Educational Notice & Risk Warning
• This scanner is provided strictly for education and research. It is not investment advice, a recommendation, or a solicitation to buy/sell any security, derivative, or cryptocurrency.
• Candlestick patterns and volume context are imperfect and can fail. Past performance does not guarantee future results.
• Markets involve substantial risk. You can lose more than your principal, especially with margin, options, or leveraged products.
• Signals are generated after bar close and may be delayed at higher timeframes or due to data/vendor issues.
• Always validate with your own analysis, risk management rules, and, where appropriate, consult a qualified financial advisor.
• By using this tool, you agree not to misuse it for unlawful activity, spam alerts, or to represent it as a guaranteed system. You accept full responsibility for any trades taken and outcomes incurred.
________________________________________
13) Quick setup checklist
• Add SPS Pro to your chart.
• Configure Timeframes you actually trade.
• Toggle Show Volume and Vol Strength as desired.
• Keep SMA Trend Gate ON for cleaner signals (tune maLen to your market).
• Create a TradingView alert for “Any alert() function call” → Once per bar close.
• Paper-trade a sample of signals before going live.

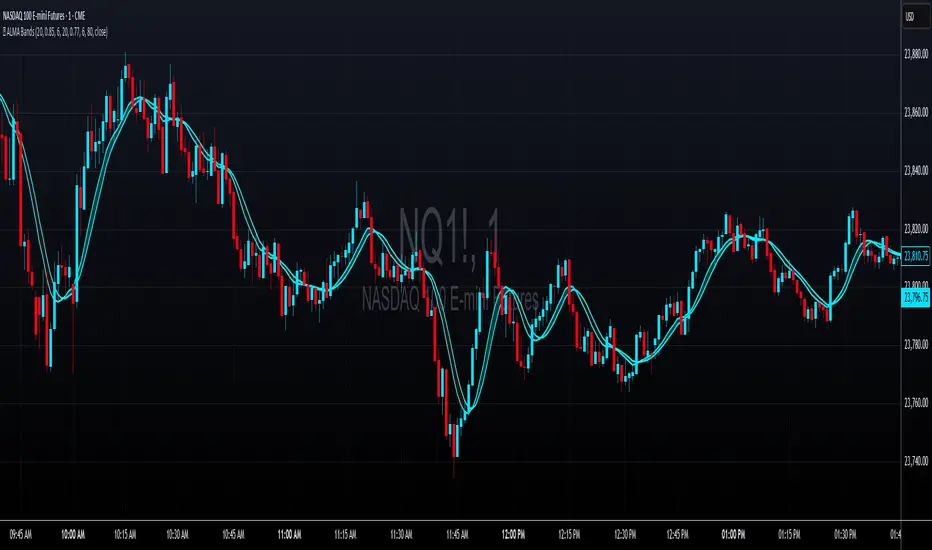
🌊 ALMA BandsTrend Architect Suite Lite - ALMA Bands - Adaptive Moving Average System
Simple implementation of ALMA (Arnaud Legoux Moving Average) bands from the Trend Architect Suite.
Why ALMA over Traditional EMA Bands?
Superior Smoothness: ALMA combines the best of both SMA and EMA by using Gaussian filters to reduce noise while maintaining responsiveness
Reduced Lag: The offset parameter allows fine-tuning between minimal lag and maximum smoothness
Advanced Weighting: Uses a sophisticated weighted algorithm that reduces false signals compared to traditional moving averages
Configurable Phase: The offset parameter (0-1) controls the phase shift, allowing you to balance between smoothness and responsiveness
Features:
Dual ALMA lines with customizable periods, offsets, and sigma values
Dynamic fill coloring (cyan for bullish, red for bearish trends)
Clean crossover alerts for trend changes
Fully customizable appearance and sensitivity
Settings:
Default configuration uses 20-period ALMAs with different offset values (0.85 vs 0.77)
All parameters are adjustable to fit your trading style
Use Case:
Trend-following system suitable for any timeframe. Best used in conjunction with other analysis for confirmation.