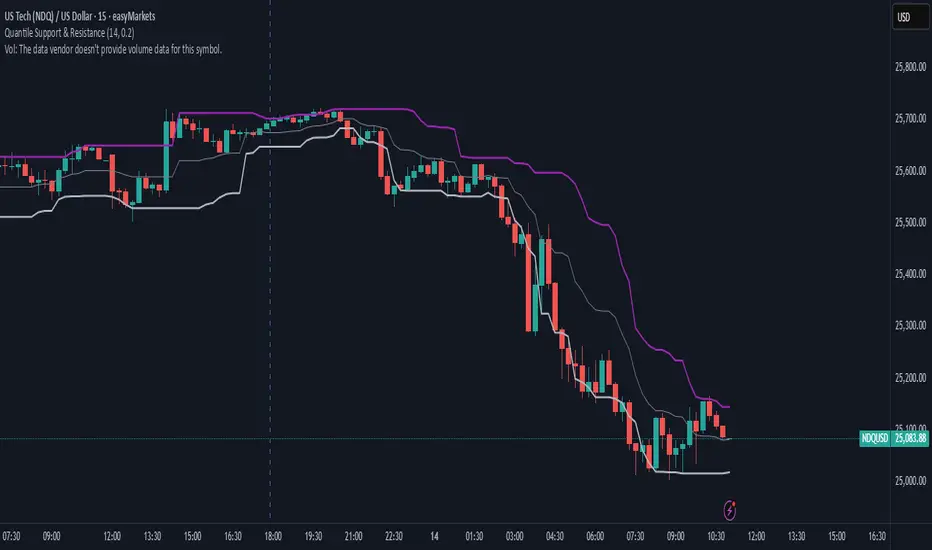
Quantile Support & ResistanceThis indicator plots dynamic support and resistance zones based on quantile logic — a statistically grounded method for identifying structural price boundaries.
Support Level: The price below which only a small percentage of lows fall (default: 10%). This approximates a strong demand zone.
Resistance Level: The price above which only a small percentage of highs rise (default: 10%). This approximates a strong supply zone.
Volatility-Adaptive: Levels adjust automatically to changing market conditions using a configurable lookback window.
Quantile Interpolation: Uses sorted price data and fractional indexing to estimate percentile thresholds with precision.
This tool is ideal for traders who want to visualize statistically significant price zones without relying on subjective drawing or fixed levels. It pairs well with breakout strategies, retest logic, and compression overlays.
Bandas e Canais
ORB Pro SuiteOverview
ORB Pro with Filters + Debug Overlay is an advanced Opening Range Breakout indicator designed for precision intraday trading. It defines a configurable ORB window, automatically builds the breakout range, and triggers long or short signals only when all active filters align. The script also includes a built-in debug overlay that explains why each breakout is accepted or blocked, allowing traders to fine-tune entries with transparency.
What Makes It Unique
• Modular filter stack – close-confirmation vs. instant breaks, retest confirmation with adjustable tolerance %, volume-spike and EMA-trend filters, ORB-size range, session cutoff, and cooldown logic.
• Non-blocking debug overlay – inline or corner display of the exact rejection reason (“Too late,” “Low volume,” “Trend mismatch,” etc.).
• Fully customizable visuals – choose shaded, outline, or line-only ORB styles; set opacity, border color, and right-edge offset so the box never hides current candles.
• Integrated reversal engine – detects doji, hammer, and engulfing structures within a time-filtered window and optional VWAP/EMA confluence.
How It Works
During the defined opening window (default 9:30 – 9:45 NY), the indicator records the session high and low.
After the box closes, it looks for breakouts confirmed by candle close or retest (per user settings).
Each signal passes through range, volume, trend, time-delay, and session filters before printing.
Visual stop-loss / take-profit levels appear for reference using either R:R multiples or fixed %.
The optional reversal layer marks short-term exhaustion zones for counter-scalp setups.
Usage Guidelines
• Apply to standard candlestick charts (not Heikin Ashi, Renko, or Range).
• Select your local ORB start / end time, then enable or disable filters based on your playbook.
• Use the “Outline only” or “Corner table” debug modes for a cleaner chart.
• The script provides visual and alert-based confirmations only; it does not execute orders or backtest performance.
Inputs at a Glance
– ORB window (start/end time)
– Close-confirm toggle
– Retest tolerance %
– Volume SMA length
– EMA length for trend filter
– Min/Max range % filter
– Cooldown bars and session cutoff
– Visual R:R ratio or fixed SL/TP %
– Box style, opacity, border width / color
– Debug overlay mode (inline or table) and leader lines
Notes & Disclaimers
• This script is for analysis and educational purposes only. It does not constitute financial advice or guarantee performance.
• Signals are calculated on completed bars without lookahead.
• Invite-only access ensures version integrity and controlled distribution.
© Trades with B – Original development in Pine v6. Reuse of this code requires explicit permission from the author.

TraderDemircan Auto Fibonacci RetracementDescription:
What This Indicator Does:This indicator automatically identifies significant swing high and swing low points within a customizable lookback period and draws comprehensive Fibonacci retracement and extension levels between them. Unlike the manual Fibonacci tool that requires you to constantly redraw levels as price action evolves, this automated version continuously updates the Fibonacci grid based on the most recent major swing points, ensuring you always have current and relevant support/resistance zones displayed on your chart.Key Features:
Automatic Swing Detection: Continuously scans the specified lookback period to find the most significant high and low points, eliminating manual drawing errors
Comprehensive Level Coverage: Plots 16 Fibonacci levels including 7 retracement levels (0.0 to 1.0) and 9 extension levels (1.115 to 3.618)
Top-Down Methodology: Draws from swing high to swing low (right-to-left), following the traditional Fibonacci retracement convention where 100% is at the top
Dual Labeling System: Shows both exact price values and Fibonacci percentages for easy reference
Complete Customization: Individual toggle controls and color selection for each of the 16 levels
Flexible Display Options: Adjust line thickness (1-5), style (solid/dashed/dotted), and extension direction (left/right/both)
Visual Swing Markers: Red diamond at the swing high (starting point) and green diamond at the swing low (ending point)
Optional Trend Line: Connects the two swing points to visualize the overall price movement direction
How It Works:The indicator employs a sophisticated swing point detection algorithm that operates in two stages:Stage 1 - Find the Swing Low (Support Base):
Scans the entire lookback period to identify the lowest low, which becomes the anchor point (0.0 level in traditional retracement terms, though displayed at the bottom of the grid).Stage 2 - Find the Swing High (Resistance Peak):
After identifying the swing low, searches for the highest high that occurred after that low point, establishing the swing range. This creates a valid price movement range for Fibonacci analysis.Fibonacci Calculation Method:
The indicator uses the top-down approach where:
1.0 Level = Swing High (100% retracement, the top)
0.0 Level = Swing Low (0% retracement, the bottom)
Retracement Levels (0.236 to 0.786) = Potential support zones during pullbacks from the high
Extension Levels (1.115 to 3.618) = Potential target zones below the swing low
Formula: Price = SwingHigh - (SwingHigh - SwingLow) × FibonacciLevelThis ensures that 0.0 is at the bottom and extensions (>1.0) plot below the swing low, following standard Fibonacci retracement convention.Fibonacci Levels Explained:Retracement Levels (0.0 - 1.0):
0.0 (Gray): Swing low - the base support level
0.236 (Red): Shallow retracement, first minor support
0.382 (Orange): Moderate retracement, commonly watched support
0.5 (Purple): Psychological midpoint, significant support/resistance
0.618 (Blue - Golden Ratio): The most important retracement level, high-probability reversal zone
0.786 (Cyan): Deep retracement, last defense before full reversal
1.0 (Gray): Swing high - the initial resistance level
Extension Levels (1.115 - 3.618):
1.115 (Green): First extension, minimal downside target
1.272 (Light Green): Minor extension, common profit target
1.414 (Yellow-Green): Square root of 2, mathematical significance
1.618 (Gold - Golden Extension): Primary downside target, most watched extension level
2.0 (Orange-Red): 200% extension, psychological round number
2.382 (Pink): Secondary extension target
2.618 (Purple): Deep extension, major target zone
3.272 (Deep Purple): Extreme extension level
3.618 (Blue): Maximum extension, rare but powerful target
How to Use:For Retracement Trading (Buying Pullbacks in Uptrends):
Wait for price to make a significant move up from swing low to swing high
When price starts pulling back, watch for reactions at key Fibonacci levels
Most common entry zones: 0.382, 0.5, and especially 0.618 (golden ratio)
Enter long positions when price shows reversal signals (candlestick patterns, volume increase) at these levels
Place stop loss below the next Fibonacci level
Target: Return to swing high or higher extension levels
For Extension Trading (Profit Targets):
After price breaks below the swing low (0.0 level), use extensions as profit targets
First target: 1.272 (conservative)
Primary target: 1.618 (golden extension - most commonly reached)
Extended target: 2.618 (for strong trends)
Extreme target: 3.618 (only in powerful trending moves)
For Counter-Trend Trading (Fading Extremes):
When price reaches deep retracements (0.786 or below), look for exhaustion signals
Watch for divergences between price and momentum indicators at these levels
Enter reversal trades with tight stops below the swing low
Target: 0.5 or 0.382 levels on the bounce
For Trend Continuation:
In strong uptrends, shallow retracements (0.236 to 0.382) often hold
Use these as low-risk entry points to join the existing trend
Failure to hold 0.5 suggests weakening momentum
Breaking below 0.618 often indicates trend reversal, not just retracement
Multi-Timeframe Strategy:
Use daily timeframe Fibonacci for major support/resistance zones
Use 4H or 1H Fibonacci for precise entry timing within those zones
Confluence between multiple timeframe Fibonacci levels creates high-probability zones
Example: Daily 0.618 level aligning with 4H 0.5 level = strong support
Settings Guide:Lookback Period (10-500):
Short (20-50): Captures recent swings, more frequent updates, suited for day trading
Medium (50-150): Balanced approach, good for swing trading (default: 100)
Long (150-500): Identifies major market structure, suited for position trading
Higher values = more stable levels but slower to adapt to new trends
Pivot Sensitivity (1-20):
Controls how many candles are required to confirm a swing point
Low (1-5): More sensitive, identifies minor swings (default: 5)
High (10-20): Less sensitive, only major swings qualify
Use higher sensitivity on lower timeframes to filter noise
Individual Level Toggles:
Enable only the levels you actively trade to reduce chart clutter
Common minimalist setup: Show only 0.382, 0.5, 0.618, 1.0, 1.618, 2.618
Comprehensive setup: Enable all levels for maximum information
Visual Customization:
Line Thickness: Thicker lines (3-5) for presentation, thinner (1-2) for trading
Line Style: Solid for primary levels (0.5, 0.618, 1.618), dashed/dotted for secondary
Price Labels: Essential for knowing exact entry/exit prices
Percent Labels: Helpful for quickly identifying which Fibonacci level you're looking at
Extension Direction: Extend right for forward-looking analysis, left for historical context
What Makes This Original:While Fibonacci indicators are common on TradingView, this script's originality comes from:
Intelligent Two-Stage Detection: Unlike simple high/low finders, this uses a sequential approach (find low first, then find the high that occurred after it), ensuring logical price flow representation
Comprehensive Level Set: Includes 16 levels spanning from retracement to extreme extensions, more than most Fibonacci tools
Top-Down Methodology: Properly implements the traditional Fibonacci retracement convention (high to low) rather than the reverse
Automatic Range Validation: Only draws Fibonacci when both swing points are valid and in the correct temporal order
Dual Extension Options: Separate controls for extending lines left (historical context) and right (forward projection)
Smart Label Positioning: Places percentage labels on the left and price labels on the right for clarity
Visual Swing Confirmation: Diamond markers at swing points help users understand why levels are positioned where they are
Important Considerations:
Historical Nature: Fibonacci retracements are based on past price swings; they don't predict future moves, only suggest potential support/resistance
Self-Fulfilling Prophecy: Fibonacci levels work partly because many traders watch them, creating actual support/resistance at those levels
Not All Levels Hold: In strong trends, price may slice through multiple Fibonacci levels without pausing
Context Matters: Fibonacci works best when aligned with other support/resistance (previous highs/lows, moving averages, trendlines)
Volume Confirmation: The most reliable Fibonacci reversals occur with volume spikes at key levels
Dynamic Updates: The levels will redraw as new swing highs/lows form, so don't rely solely on static screenshots
Best Practices:
Don't Trade Blindly: Fibonacci levels are zones, not exact prices. Look for confirmation (candlestick patterns, indicators, volume)
Combine with Price Action: Watch for pin bars, engulfing candles, or doji at key Fibonacci levels
Use Stop Losses: Place stops beyond the next Fibonacci level to give trades room but limit risk
Scale In/Out: Consider entering partial positions at 0.5 and adding more at 0.618 rather than all-in at one level
Check Multiple Timeframes: Daily Fibonacci + 4H Fibonacci convergence = high-probability zone
Respect the 0.618: This golden ratio level is historically the most reliable for reversals
Extensions Need Strong Trends: Don't expect extensions to be hit unless there's clear momentum beyond the swing low
Optimal Timeframes:
Scalping (1-5 minutes): Lookback 20-30, watch 0.382, 0.5, 0.618 only
Day Trading (15m-1H): Lookback 50-100, all retracement levels important
Swing Trading (4H-Daily): Lookback 100-200, focus on 0.5, 0.618, 0.786, and extensions
Position Trading (Daily-Weekly): Lookback 200-500, all levels relevant for long-term planning
Common Fibonacci Trading Mistakes to Avoid:
Wrong Swing Selection: Choosing insignificant swings produces meaningless levels
Premature Entry: Entering as soon as price touches a Fibonacci level without confirmation
Ignoring Trend: Fighting the main trend by buying deep retracements in downtrends
Over-Reliance: Using Fibonacci in isolation without confirming with other technical factors
Static Analysis: Not updating your Fibonacci as market structure evolves
Arbitrary Lookback: Using the same lookback period for all assets and timeframes
Integration with Other Tools:Fibonacci + Moving Averages:
When 0.618 level aligns with 50 or 200 EMA, confluence creates stronger support
Price bouncing from both Fibonacci and MA simultaneously = high-probability trade
Fibonacci + RSI/Stochastic:
Oversold indicators at 0.618 or deeper retracements = strong buy signal
Overbought indicators at swing high (1.0) = potential reversal warning
Fibonacci + Volume Profile:
High-volume nodes aligning with Fibonacci levels create robust support/resistance
Low-volume areas near Fibonacci levels may see rapid price movement through them
Fibonacci + Trendlines:
Fibonacci retracement level + ascending trendline = double support
Breaking both simultaneously confirms trend change
Technical Notes:
Uses ta.lowest() and ta.highest() for efficient swing detection across the lookback period
Implements dynamic line and label arrays for clean redraws without memory leaks
All calculations update in real-time as new bars form
Extension options allow customization without modifying core code
Format.mintick ensures price labels match the symbol's minimum price increment
Tooltip on swing markers shows exact price values for precision

No.2 DeadwoodDeadwood AJC Turtle strong arm
waffles
tacos
lettuce
all of the above is needed to understand

NQ Daily Standard Deviation Levels. (That work).Standard deviation levels to help provide structure to market. Also can be used for reversal levels.

P-Ichimoku MTF++English:
Ichimoku indicator on the 4-hour and weekly timeframes is a powerful tool for analyzing market trends and potential reversals. The weekly chart highlights the long-term trend and major support-resistance levels, while the 4-hour chart is ideal for spotting short-term trading opportunities. Crosses of the Tenkan-sen and Kijun-sen lines, as well as the price position relative to the cloud, provide specific signals. Using Ichimoku on multiple timeframes helps traders see both the big picture and short-term opportunities.

Braid Filter StrategyAnother of TradeIQ's youtube strategies. It looks a little messy but it combines all the indicators into one so there are no extra panes. This strategy is like a sophisticated set of traffic lights and speed limit signs for trading. It only allows a trade when multiple indicators line up to confirm a strong move, giving it its "Braid Filter" name—it weaves together several conditions.
The strategy is set up to use 100% of your account equity (your trading funds) on a trade and does not "pyramid" (it won't add to an existing trade).
1. The Main Trend Check (The Traffic Lights)
The strategy uses three main filters that must agree before it considers a trade.
A. The "Braid Filter" (Direction & Strength)
This is the heart of the strategy, a custom combination of three different Moving Averages
These averages have fast, medium, and slow settings (3, 7, and 14 periods).
Go Green (Buy Signal): The fastest average is higher than the medium average, AND the three averages are sufficiently separated (not tangled up, which indicates a strong move).
Go Red (Sell Signal): The medium average is higher than the fastest average, AND the three averages are sufficiently separated.
Neutral (Wait): If the averages are tangled or the separation isn't strong enough.
Key Trigger: A primary condition for a signal is when the Chad Filter changes color (e.g., from Red/Grey to Green).
B. The EMA Trend Bars (Secondary Confirmation)
This is a simpler, longer-term filter using a 34-period Exponential Moving Average (EMA). It checks if the current candle's average price is above or below this EMA.
Green Bars: The price is above the 34 EMA (Bullish Trend).
Red Bars: The price is below the 34 EMA (Bearish Trend).
Trades only happen if the signal direction matches the bar color. For a Buy, the bar must be Green. For a Sell, the bar must be Red.
C. ADX/DI Filter (The Speed Limit Sign)
This uses the Average Directional Index (ADX) and Directional Movement Indicators (DI) to check if a trend is actually in motion and getting stronger.
Must-Have Conditions:
The ADX value must be above 20 (meaning there is a trend, not just random movement).
The ADX line must be rising (meaning the trend is accelerating/getting stronger).
The strategy will only trade when the trend is strong and building momentum.
2. The Trading Action (Entry and Exit)
When all three filters (Chad Filter color change, EMA Trend Bar color, and ADX strength/slope) align, the strategy issues a signal, but it doesn't enter immediately.
Entry Strategy (The "Wait-for-Confirmation" Approach):
When a Buy Signal appears, the strategy sets a "Buy Stop" order at the signal candle's closing price.
It then waits for up to 3 candles (Candles Valid for Entry). The price must move up and hit that Buy Stop price within those 3 candles to confirm the move and enter the trade.
A Sell Signal works the same way but uses a "Sell Stop" at the closing price, waiting for the price to drop and hit it.
Risk Management (Stop Loss and Take Profit):
Stop Loss: To manage risk, the strategy finds a recent significant low (for a Buy) or high (for a Sell) over the last 20 candles and places the Stop Loss there. This is a logical place where the current move would be considered "broken" if the price reaches it.
Take Profit: It uses a fixed Risk:Reward Ratio (set to 1.5 by default). This means the potential profit (Take Profit distance) is $1.50 for every $1.00 of risk (Stop Loss distance).
3. Additional Controls
Time Filter: You can choose to only allow trades during specific hours of the day.
Visuals: It shows a small triangle on the chart where the signal happens and colors the background to reflect the Chad Filter's trend (Green/Red/Grey) and the candle bars to show the EMA trend (Lime/Red).
🎯 Summary of the Strategy's Goal
This strategy is designed to capture strong, confirmed momentum moves. It uses a fast, custom indicator ("Chad Filter") to detect the start of a new move, confirms that move with a slower trend filter (34 EMA), and then validates the move's strength with the ADX. By waiting a few candles for the price to hit the entry level, it aims to avoid false signals.

Slippage Liquidity IndicatorSlippage's Proprietary Indicator - find and mark out resting liquidity before NY Market Open.

TraderDemircan (Triz Global) Automatic Extend FibonacciDescription
What This Indicator Does:
This indicator automatically identifies the most significant swing low and swing high points within a customizable lookback period and plots comprehensive Fibonacci retracement and extension levels between them. Unlike manual Fibonacci tools, this script continuously updates the levels based on the most recent price action, making it ideal for traders who want to identify key support/resistance zones without constantly redrawing Fibonacci levels.
Key Features:
Automatic Swing Point Detection: Scans the specified lookback period to find the lowest low (starting point) and the highest high (ending point) to establish the Fibonacci range
Comprehensive Level Coverage: Plots 18 Fibonacci levels ranging from 0.0 (minimum) to 3.618 (maximum extension), including standard retracement levels (0.236, 0.382, 0.5, 0.618, 0.786) and popular extension levels (1.272, 1.414, 1.618, 2.0, 2.272, 2.382, 2.618, 3.0, 3.272, 3.618)
Visual Clarity: Each level is color-coded and can be individually toggled on/off for cleaner charts
Price and Percentage Labels: Shows both the actual price level and the Fibonacci percentage for easy reference
Flexible Display Options: Customize line width, style (solid/dashed/dotted), and extension direction
Dynamic Updates: Automatically recalculates levels as new price data becomes available
How It Works:
The indicator uses a left-to-right methodology, starting from the swing low (marked as 0.0 with a green diamond) and extending to the swing high (marked as 1.0 with a blue diamond). This approach follows natural price movement and makes the Fibonacci levels intuitive to read. The algorithm:
Identifies the lowest point within the lookback period (this becomes the 0.0 level)
Finds the highest point that occurred after the low point (this becomes the 1.0 level)
Calculates all retracement levels (0.0-1.0) and extension levels (above 1.0) based on this range
Plots horizontal lines with customizable styling and labels
How to Use:
For Retracement Trading: Watch for price reactions at key levels like 0.382, 0.5, and 0.618 (the Golden Ratio) during pullbacks in an uptrend
For Extension Targets: Use levels above 1.0 (especially 1.272, 1.414, and 1.618) to project potential profit targets
Adjust Sensitivity: Increase the "Pivot Sensibility" parameter for major swings only, or decrease it to capture more frequent price movements
Customize Lookback: Shorter periods (50-100 bars) work well for intraday trading, while longer periods (200-500 bars) suit swing trading and position trading
Settings:
Lookback Period: Controls how many candles back to search (10-500)
Pivot Sensibility: Determines the strength required to identify swing points (1-20)
Individual Level Toggles: Enable/disable any of the 18 Fibonacci levels
Visual Customization: Change colors, line thickness (1-5), and line style for each level
Label Options: Toggle price labels and percentage labels independently
Extension Controls: Choose to extend lines left, right, or both directions
What Makes This Original:
This indicator combines automatic swing detection with an extensive range of Fibonacci levels (18 total) that go well beyond the standard retracement tool. The left-to-right calculation methodology ensures logical level placement, while the comprehensive customization options allow traders to adapt the visual presentation to their specific trading style and chart setup.
Note: This indicator is designed for visual analysis and does not generate buy/sell signals. It's a tool to help identify potential support/resistance zones based on Fibonacci ratios. Always combine with other technical analysis methods and proper risk management.

NQ Daily STDV Bands (Market Structure)Plots standard deviation levels off of market open, based upon the previous day's 1m average standard deviation (volatility). The levels can be used to help provide a structure to your trading, and can be especially used as reversal levels. Good for futures trading, I personally use for NQ.
Below is an image shown of it working. It updates each day at 9:31am NY session.

Exponential Moving Average + ATR MTF [YSFX]Description:
This indicator is a reupload of a previously published EMA + ATR tool, updated and enhanced after a house rule violation to provide additional features and a cleaner, more versatile experience for traders.
It combines trend analysis and volatility measurement into one intuitive tool, allowing traders to visualize market direction, dynamic support and resistance, and adaptive risk levels—all in a clean, minimal interface.
The indicator calculates a customizable moving average (MA) type—EMA, SMA, WMA, HMA, RMA, DEMA, TEMA, VWMA, LSMA, or KAMA—and surrounds it with ATR-based bands that expand and contract with market volatility. This creates a dynamic envelope around price, helping traders identify potential breakouts, pullbacks, or high-probability entry/exit zones.
Advanced Features:
Multiple MA types: Supports all major moving averages, including advanced options like KAMA, DEMA, and TEMA.
KAMA customization: Adjustable fast and slow lengths for precise tuning.
Dual timeframe support: Optionally use separate timeframes for the MA and ATR, or a global timeframe for both.
Dynamic ATR bands: Automatically adjust to market volatility, useful for setting adaptive stop-loss levels.
Optional fill: Shade the area between upper and lower ATR bands for a clear visual representation of volatility.
Flexible for all markets: Works across any timeframe or asset class.
Who It’s For:
This indicator is ideal for trend-following traders, swing traders, and volatility-focused analysts who want to:
Confirm trend direction while accounting for volatility
Identify high-probability trade entries and exits
Implement dynamic, ATR-based stop-loss strategies
Keep charts clean and uncluttered while still capturing key market information
This reuploaded version ensures compliance with platform rules while offering enhanced flexibility and clarity for modern trading workflows.


J&C indicator📊 Indicators Used
10 MA (Fast) - Short-term trend direction
40 MA (Slow) - Long-term trend direction
🟢 LONG Signal Conditions (ALL must be true)
10 MA is rising (uptrend)
40 MA is rising (strong uptrend)
10 MA > 40 MA (fast above slow = bullish)
Price action: Low touched below 10 MA, but close is above 40 MA
This means price dipped but found support

EMA 50/100/200 Trend BandsEMA Trend Bands is a clean and powerful trend-structure tool built around the classic 50/100/200 EMA stack.
It provides an intuitive, color-coded view of market conditions by identifying when the trend is bullish, bearish, or neutral based on EMA alignment.
This indicator is designed for traders who want a simple, objective trend filter without the clutter of extra signals or repainting logic.

RSI with Zone Colors//@version=6
indicator(title="RSI with Zone Colors", shorttitle="RSI+", format=format.price, precision=2, timeframe="", timeframe_gaps=true)
//// ==== INPUT SETTINGS ====
rsiLength = input.int(14, title="RSI Length", minval=1)
source = input.source(close, title="Source")
ob_level = input.int(70, title="Overbought Level")
os_level = input.int(30, title="Oversold Level")
//// ==== RSI CALCULATION ====
change = ta.change(source)
up = ta.ma(math.max(change, 0), rsiLength)
down = ta.ma(-math.min(change, 0), rsiLength)
rsi = down == 0 ? 100 : 100 - (100 / (1 + up / down))
//// ==== COLOR BASED ON ZONES ====
rsiColor = rsi > ob_level ? color.red : rsi < os_level ? color.green : #2962FF
//// ==== PLOT RSI ====
plot(rsi, title="RSI", color=rsiColor, linewidth=2)
//// ==== ZONE LINES ====
hline(ob_level, "Overbought", color=#787B86)
hline(50, "Middle", color=color.new(#787B86, 50))
hline(os_level, "Oversold", color=#787B86)
//// ==== FILL ZONES ====
zoneColor = rsi > ob_level ? color.new(color.red, 85) : rsi < os_level ? color.new(color.green, 85) : na
fill(plot(ob_level, display=display.none), plot(rsi > ob_level ? rsi : ob_level, display=display.none), color=zoneColor, title="OB Fill")
fill(plot(os_level, display=display.none), plot(rsi < os_level ? rsi : os_level, display=display.none), color=zoneColor, title="OS Fill")
//// ==== COLOR CANDLE WHEN RSI IN ZONE ====
barcolor(rsi > ob_level ? color.red : rsi < os_level ? color.green : na)

RSI with Zone ColorsRSI with zone cooler highlight for everyone
🔹 Short description (for the “Description” box)
RSI with Zone Colors
This indicator plots a classic RSI and highlights the overbought / oversold zones with clear colors.
The RSI line changes color when it enters each zone, the zones are softly filled in the RSI pane, and the price candles on the main chart are recolored whenever RSI is overbought or oversold.
It’s designed to make momentum shifts easy to see at a glance on any symbol or timeframe.
⸻
🔹 What the script does (explanation)
1. Custom RSI calculation
• Uses the price source you choose (close by default) and the RSI length you set.
• Calculates average up-moves and down-moves, then builds a classic RSI value from 0–100.
2. Configurable levels
• Overbought Level (default 70)
• Oversold Level (default 30)
• Midline at 50 is drawn automatically.
3. RSI line color by zone
• Above OB level → RSI line becomes red (overbought zone).
• Below OS level → RSI line becomes green (oversold zone).
• Between the two levels → blue (normal zone).
4. Zone lines
• Horizontal lines at Overbought, Oversold, and 50 are plotted to clearly mark each region.
5. Zone fills
• The space around the overbought area is filled with a soft red background.
• The space around the oversold area is filled with a soft green background.
• Transparency is used so the RSI line stays visible.
6. Candle colors on the main chart
• When RSI is overbought, price candles are colored red.
• When RSI is oversold, price candles are colored green.
• In the normal zone, candles keep their default color.
→ This lets you see RSI conditions directly on the price chart without looking down at the indicator pane all the time.
⸻
🔹 How to use (for “How to use / Strategy idea” section)
You can copy-paste and tweak this:
How to use
• Apply this indicator to any symbol and timeframe.
• Adjust RSI Length, Overbought Level, and Oversold Level to match your trading style (for example 14 / 80 / 20 for stronger filters).
• Use the red overbought zone to look for potential exhaustion after strong up moves.
• Use the green oversold zone to look for potential exhaustion after strong down moves.
• Candle colors on the main chart help you see when RSI is extended without taking your eyes off price.
• This script is meant as a visual aid, not a complete trading system. Combine it with your own trend, structure, and risk-management rules.
⸻
🔹 Optional disclaimer (short)
This script is for educational and informational purposes only and is not financial advice. Always test any idea on a demo account before using it with real capital.

3SD BB Exhaustion + Bias Zone Reversal🚀 Exciting Update!
I’m thrilled to announce the release of the Premium Bollinger Band with Bias Zone Reversal Indicator!
The Bias Zone is a simple yet powerful concept that helps identify potential turning points in price with remarkable precision.
When combined with the 3 Standard Deviation Bollinger Band extremes, this upgraded tool delivers high-probability reversal signals—helping traders anticipate trend shifts before they happen.
📈 Whether you’re trading reversals or managing entries around exhaustion zones, this indicator gives you a clearer edge with structured, multi-timeframe insights.

Triad Oscillator°Triad Oscillator° - Proprietary Momentum Analysis
The Triad Oscillator° is a sophisticated momentum indicator designed to identify trend strength, reversals, and low-volatility consolidation zones. Built with algorithmic precision, this oscillator provides traders with clear visual signals for optimal entry and exit timing.
Key Features:
6 Smoothness Levels: Adjustable sensitivity from fast/responsive to ultra-smooth, allowing adaptation to any trading style or timeframe
Multi-Zone Analysis: Identifies extreme momentum (60/36), standard quadrants (25/50/75), and low-volatility compression zones (45-55)
Clean Visual Design: Minimal clutter with customizable colors and togglable reference levels
Universal Application: Works across all instruments and timeframes - futures, forex, crypto, and equities
How to Use:
Above 50: Bullish momentum dominance
Below 50: Bearish momentum dominance
60+ Zone: Extreme overbought - potential reversal or continuation signal
36- Zone: Extreme oversold - potential reversal or continuation signal
45-55 Range: Low volatility compression - breakout imminent
Trading Applications:
Perfect for swing traders, day traders, and scalpers seeking confirmation of momentum shifts, divergence analysis, and volatility-based entries. Combine with price action and market structure for highest probability setups.
Customization:
Fully customizable colors, line widths, and visibility toggles allow you to tailor the indicator to your exact preferences and trading system.

ATRSPYLIFEIts just plotting horizontal levels, I am publishing it to start publishing my ideas. thats all nothing special

TraderDemircan Fibonacci + XABCD Formation v1.0This indicator automatically identifies the most recent significant swing low (Point X) and the subsequent swing high (Point A) to plot a comprehensive set of Fibonacci extension levels.
Beyond a standard Fibonacci tool, this script also projects a potential harmonic XABCD pattern. It identifies a retracement level (Point B) and projects a "C" target based on the XA=BC price projection. This provides traders with a complete visual framework of key support/resistance levels and potential price targets based on the last significant impulse move.
How It Works
Swing Detection (X & A Points): The script scans the previous Lookback Bars (user-defined) to find the lowest low, which it labels as Point X. It then finds the highest high that occurred after Point X, labeling it as Point A.
Fibonacci Levels: The price range between X and A (the "XA leg") is used as the basis (0.0 to 1.0) to draw 18 different Fibonacci levels, including key extensions (1.272, 1.618, 2.618, etc.) and retracements.
XABCD Projection (B & C Points):
Point B: The script dynamically identifies Point B at either the 0.382 or 0.5 retracement level of the XA leg, depending on the current price action. This shows the level that is currently acting as support.
Point C (Target): A target (Point C) is projected by adding the price range of the XA leg to the B point. This creates a classic XA=BC (or AB=CD, where the first leg is XA) price projection, offering a potential target for the next upward move.
Key Features
Automatic Swing Detection: Automatically finds and plots the X and A points, adapting to the latest price action.
Comprehensive Fibonacci Suite: Includes 18 toggleable Fibonacci levels (from 0.0 to 4.618) to cover all common retracement and extension targets.
XABCD Pattern & Target: Visually plots the X-A, A-B, and the projected B-C legs, clearly highlighting the C target.
Dynamic "B" Point: The B point label (0.382 or 0.5) updates to reflect which retracement level is currently in play.
On-Screen Info Table: A clean table in the top-right corner displays the exact price values for X, A, B, and the C Target for quick reference.
Full Customization: Users can control the visibility, color, width, and style of every Fibonacci level and pattern line.
Label Options: Toggle price labels (on the right) and percentage/level labels (on the left) for a clean or detailed chart.

Mickey's Breaker Engine⚡ Breaker Engine | Auto Retest + Smart R:R Targets
A precision-grade breaker-block detection system built for traders who live and breathe clean structure.
This indicator automatically detects Breaker Candles, confirms them, marks their zones, and executes intelligent retest-based entry logic — complete with Stop-Loss and Risk-to-Reward (R:R) tracking up to 3R (or any custom ratio).
🧠 Core Concept
A Breaker Block is a structural shift where price violates liquidity from a failed order block and flips the zone’s polarity — turning a former supply into demand (or vice-versa).
This script identifies those setups automatically, confirms them only after a valid structure break, and waits for a clean retest to trigger a trade signal.
🚀 Key Features
⚙️ Smart Zone Detection
Detects both Bullish Breakers and Bearish Breakers.
Zones are drawn precisely using the breaker’s middle candle body (or full wick range if enabled).
Fully configurable transparency, width, and extension for better visual context.
🎯 Auto Retest Entry Logic
Entry triggers only on a clean retest, not on immediate breakout.
Includes logical filters to ensure retests are structurally valid and not overlapping candles.
Works in any timeframe or market — crypto, forex, indices, or commodities.
💡 Dynamic Risk–Reward Tracking
Automatically plots 1R, 2R, 3R, ...R targets based on your defined stop range.
Risk is calculated from entry to zone boundary or ATR offset.
Each target label appears precisely when hit.
Targets automatically stop updating once Stop-Loss is triggered.
🧱 Visual Clarity
BUY 🟢 / SELL 🔴 bubbles at entries.
SL ❌ marker when stop is hit.
🎯 1R / 2R / 3R labels dynamically plotted when each reward level is reached.
Non-overlapping placement using ATR-based spacing.
⚡ Real-Time Alerts - Instant alerts for:
✅ “Breaker BUY” – Clean retest confirmed (Long setup)
✅ “Breaker SELL” – Clean retest confirmed (Short setup)
❌ “Breaker BUY SL” – Stop hit for Long
❌ “Breaker SELL SL” – Stop hit for Short
🧩 Customization Panel
| Setting | Description |
| :-------------------------- | :------------------------------------------------------------------------------ |
| **ATR Length** | Controls volatility-based offset sizing. |
| **Entry / SL Offset × ATR** | Adjusts label spacing and dynamic positioning. |
| **Risk-Reward Ratio** | Define default R:R (e.g. 1:3). |
| **Multiple Retests** | Enable if you want the same breaker zone to allow multiple retests/entries. |
| **Banner Design** | Control opacity, extension, and wick usage for the breaker block visualization. |
| **Color Controls** | Choose your BUY/SELL/SL bubble colors to match your chart theme. |
⚙️ Underlying Logic (At a Glance)
Pattern Detection:
Identifies a 5-bar sequence that forms a valid Breaker Candle (the middle bar flips structure).
Confirmation:
Requires a follow-through candle to validate a real liquidity break.
Zone Registration:
Stores the breaker zone’s body range in arrays for tracking.
Clean Retest Entry:
Waits for price to retest the zone from the opposite side and close cleanly inside.
Stop Loss / Target Projection:
Defines stop loss just beyond the zone and plots up to 3 × reward targets dynamically.
Monitoring & Alerts:
Tracks each setup independently until either an R-target or SL is reached.
💬 Recommended Usage
Works best with market-structure traders, smart-money concepts, or liquidity-based systems.
Combine it with an external displacement confirmation or BOS/CHOCH tool for best precision.
Ideal for backtesting breaker-based R:R consistency or forward-testing retest entries.
Compatible with any asset / timeframe.
🧭 Disclaimer
This script is for educational and analytical purposes only.
It is not financial advice and should not be used to make trading decisions without independent confirmation or risk management.
Always test on demo data before deploying live.

Auto Fibonacci Retracement (Labeled Swings, Rounded Prices)This tool automatically detects the latest confirmed swing high and swing low on your chart, using a user-settable pivot length. It then plots standard Fibonacci retracement levels between these confirmed pivots, labeling each retracement line with its percentage and rounded price for instant reference. All levels update only on swing confirmation, ensuring strict non-repainting logic and transparency.
How it works
Swing Detection:
Uses Pine Script’s native ta.pivothigh and ta.pivotlow functions to locate swing pivots after full confirmation, reducing noise and false signals.
Fibonacci Calculation:
Once two confirmed swings are found, the script draws standard Fibonacci retracement levels (0%, 23.6%, 38.2%, 50%, 61.8%, 78.6%, 100%) between these anchors. The levels adapt to both uptrends and downtrends, based on swing position.
Customization and Clarity:
Users can choose which retracement levels to display and adjust colors, line thickness, styles, and label sizes for chart clarity. All price labels are rounded for improved visibility.
Non-Repainting:
All levels are plotted only after a swing is confirmed by the market; nothing redraws retroactively.
How To Use It
Add the indicator to any chart and timeframe.
Select your preferred pivot length:
Smaller values yield more frequent swings, larger values wait for major structure.
Toggle each Fibonacci level you wish to see in the settings.
Adjust line and label appearance to fit your style.
Interpret retracement levels as potential support/resistance zones, awareness for pullbacks, and context for trend direction.
Combine the indicator with your technical, price action, or volume analysis to plan entries, stops, and targets.
What Traders Should Look For
Visual retracement map between confirmed swings:
Fib lines auto-update as new swings are confirmed, keeping your chart relevant.
Price reaction at Fib levels:
Watch for reversals, consolidations, or continuations near labeled percentages and prices.
Trend assessment:
Quickly spot whether market structure is showing shallow or deep retracements by the distance between levels.
Confluence:
Use retracement levels along with other indicators or market structure for more robust trade setups.
Key Features
Strict non-repainting logic (confirmed swings only)
Configurable retracement levels: Enable/disable each Fib line.
Rounded price & percentage labels
Visual customization: Colors, thickness, line style, label size
Automatic detection of direction (uptrend/downtrend pivots)
Disclaimer
This indicator is a technical analysis and educational tool. It does not provide buy/sell signals, nor guarantee future price movements. Please use in conjunction with your trading plan and risk management.

Dhanesh_CustomTrendlineLogicUsed framma in getting the trades.
You can also define the custom horizontal and an inclined trendline breaking of which can trigger the trade. Enjoy the script.