ssdv%v2ssdv%v2 is a probabilistic trading indicator that learns from historical price behavior to predict where price is likely to move during today's trading session. Instead of using fixed values, it adapts based on what actually happened in past sessions.
Bandas e Canais

Anchored VWAP with Bandsthis lets you instantly see whether price is trading at fair value, stretched, or unusually extended relative to all the volume traded since your chosen event.

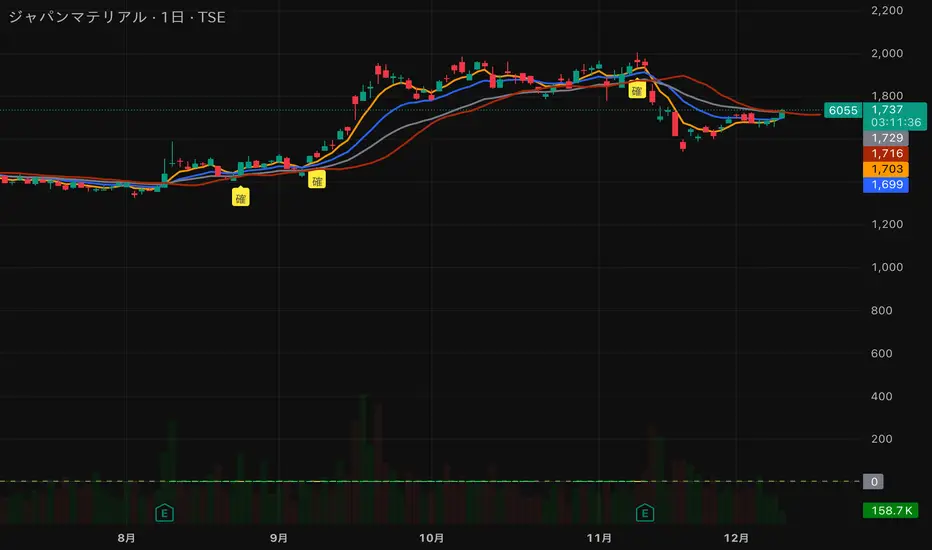
猛の掟・初動スクリーナー v3//@version=5
indicator("猛の掟・初動スクリーナー v3", overlay=true)
// ===============================
// 1. 移動平均線(EMA)設定
// ===============================
ema5 = ta.ema(close, 5)
ema13 = ta.ema(close, 13)
ema26 = ta.ema(close, 26)
plot(ema5, title="EMA5", color=color.orange, linewidth=2)
plot(ema13, title="EMA13", color=color.new(color.blue, 0), linewidth=2)
plot(ema26, title="EMA26", color=color.new(color.gray, 0), linewidth=2)
// ===============================
// 2. MACD(10,26,9)設定
// ===============================
fast = ta.ema(close, 10)
slow = ta.ema(close, 26)
macd = fast - slow
signal = ta.ema(macd, 9)
macdBull = ta.crossover(macd, signal)
// ===============================
// 3. 初動判定ロジック
// ===============================
// ゴールデン並び条件
goldenAligned = ema5 > ema13 and ema13 > ema26
// ローソク足が26EMAより上
priceAbove26 = close > ema26
// 3条件すべて満たすと「確」
bullEntry = goldenAligned and priceAbove26 and macdBull
// ===============================
// 4. スコア(0=なし / 1=猛 / 2=確)
// ===============================
score = bullEntry ? 2 : (goldenAligned ? 1 : 0)
// ===============================
// 5. スコアの色分け
// ===============================
scoreColor = score == 2 ? color.new(color.yellow, 0) : score == 1 ? color.new(color.lime, 0) : color.new(color.gray, 80)
// ===============================
// 6. スコア表示(カラム)
// ===============================
plot(score,
title="猛スコア (0=なし,1=猛,2=確)",
style=plot.style_columns,
color=scoreColor,
linewidth=3)
// 目安ライン
hline(0, "なし", color=color.new(color.gray, 80))
hline(1, "猛", color=color.new(color.lime, 60))
hline(2, "確", color=color.new(color.yellow, 60))
// ===============================
// 7. チャート上に「確」ラベル
// ===============================
plotshape(score == 2,
title="初動確定",
style=shape.labelup,
text="確",
color=color.yellow,
textcolor=color.black,
size=size.tiny,
location=location.belowbar)
KC/BB Squeeze Scanner (10/20>50 EMA, $10–$500, Vol > 1M)High volume, up trending, and compression occurring.

CRR Nemesis Fear & Greed ProIt measures 4 market indicators:
ATR → volatility.
Relative Volume (rVOL) → whether there is more or less volume than average.
Price distance from the moving average (SMA 50) in ATR → how much the trend has extended.
Candlestick shape → size of the body and wicks (who is dominating, bulls or bears).
It calculates two scores (0–100):
Greed → when:
The candlestick is bullish,
The price is above the SMA 50 (uptrend),
There is a good body, good rVOL, the price is far from the average, high volatility,
A longer upper wick adds a little more.
Fear → when:
The candlestick is bearish,
The price is below the SMA 50 (downtrend),
Similarly: strong body, rVOL, distance from the average, volatility,
A longer lower wick adds a little more.
Both scores are smoothed with a 3-period EMA (greedSmoothed and fearSmoothed).
It determines the overall market sentiment (HUD):
ANGEL (greed dominates):
Greed ≥ 55 and Greed − Fear ≥ 10.
DEVIL (fear dominates):
Fear ≥ 55 and Fear − Greed ≥ 10.
If neither condition is met → NEUTRAL.
HUD on screen (table in the upper right corner):
Displays:
STATUS: ANGEL / DEVIL / NEUTRAL (with color).
FEAR: smoothed fear value.
GREED: smoothed greed value.
🧠 In simple terms:
It's a market sentiment engine: it combines volume, ATR, distance from the trend, and candlestick shape to tell you if the market is experiencing strong fear, strong greed, or is neutral, and displays it clearly in a HUD.

VV Moving Average Convergence Divergence # VMACDv3 - Volume-Weighted MACD with A/D Divergence Detection
## Overview
**VMACDv3** (Volume-Weighted Moving Average Convergence Divergence Version 3) is a momentum indicator that applies volume-weighting to traditional MACD calculations on price, while using the Accumulation/Distribution (A/D) line for divergence detection. This hybrid approach combines volume-weighted price momentum with volume distribution analysis for comprehensive market insight.
## Key Features
- **Volume-Weighted Price MACD**: Traditional MACD calculation on price but weighted by volume for earlier signals
- **A/D Divergence Detection**: Identifies when A/D trend diverges from MACD momentum
- **Volume Strength Filtering**: Distinguishes high-volume confirmations from low-volume noise
- **Color-Coded Histogram**: 4-color system showing momentum direction and volume strength
- **Real-Time Alerts**: Background colors and alert conditions for bullish/bearish divergences
## Difference from ACCDv3
| Aspect | VMACDv3 | ACCDv3 |
|--------|---------|---------|
| **MACD Input** | **Price (Close)** | **A/D Line** |
| **Volume Weighting** | Applied to price | Applied to A/D line |
| **Primary Signal** | Volume-weighted price momentum | Volume distribution momentum |
| **Use Case** | Price momentum with volume confirmation | Volume flow and accumulation/distribution |
| **Sensitivity** | More responsive to price changes | More responsive to volume patterns |
| **Best For** | Trend following, breakouts | Volume analysis, smart money tracking |
**Key Insight**: VMACDv3 shows *where price is going* with volume weight, while ACCDv3 shows *where volume is accumulating/distributing*.
## Components
### 1. Volume-Weighted MACD on Price
Unlike standard MACD that uses simple price EMAs, VMACDv3 weights each price by its corresponding volume:
```
Fast Line = EMA(Price × Volume, 12) / EMA(Volume, 12)
Slow Line = EMA(Price × Volume, 26) / EMA(Volume, 26)
MACD = Fast Line - Slow Line
```
**Benefits of Volume Weighting**:
- High-volume price movements have greater impact
- Filters out low-volume noise and false moves
- Provides earlier trend change signals
- Better reflects institutional activity
### 2. Accumulation/Distribution (A/D) Line
Used for divergence detection, measuring buying/selling pressure:
```
A/D = Σ ((2 × Close - Low - High) / (High - Low)) × Volume
```
- **Rising A/D**: Accumulation (buying pressure)
- **Falling A/D**: Distribution (selling pressure)
- **Doji Handling**: When High = Low, contribution is zero
### 3. Signal Lines
- **MACD Line** (Blue, #2962FF): The fast-slow difference showing momentum
- **Signal Line** (Orange, #FF6D00): EMA or SMA smoothing of MACD
- **Zero Line**: Reference for bullish (above) vs bearish (below) bias
### 4. Histogram Color System
The histogram uses 4 distinct colors based on **direction** and **volume strength**:
| Condition | Color | Meaning |
|-----------|-------|---------|
| Rising + High Volume | **Dark Green** (#1B5E20) | Strong bullish momentum with volume confirmation |
| Rising + Low Volume | **Light Teal** (#26A69A) | Bullish momentum but weak volume (less reliable) |
| Falling + High Volume | **Dark Red** (#B71C1C) | Strong bearish momentum with volume confirmation |
| Falling + Low Volume | **Light Pink** (#FFCDD2) | Bearish momentum but weak volume (less reliable) |
Additional shading:
- **Light Cyan** (#B2DFDB): Positive but not rising (momentum stalling)
- **Bright Red** (#FF5252): Negative and accelerating down
### 5. Divergence Detection
VMACDv3 compares A/D trend against volume-weighted price MACD:
#### Bullish Divergence (Green Background)
- **Condition**: A/D is trending up BUT MACD is negative and trending down
- **Interpretation**: Volume is accumulating while price momentum appears weak
- **Signal**: Smart money accumulation, potential bullish reversal
- **Action**: Look for long entries, especially at support levels
#### Bearish Divergence (Red Background)
- **Condition**: A/D is trending down BUT MACD is positive and trending up
- **Interpretation**: Volume is distributing while price momentum appears strong
- **Signal**: Smart money distribution, potential bearish reversal
- **Action**: Consider exits, avoid new longs, watch for breakdown
## Parameters
| Parameter | Default | Range | Description |
|-----------|---------|-------|-------------|
| **Source** | Close | OHLC/HLC3/etc | Price source for MACD calculation |
| **Fast Length** | 12 | 1-50 | Period for fast EMA (shorter = more sensitive) |
| **Slow Length** | 26 | 1-100 | Period for slow EMA (longer = smoother) |
| **Signal Smoothing** | 9 | 1-50 | Period for signal line (MACD smoothing) |
| **Signal Line MA Type** | EMA | SMA/EMA | Moving average type for signal calculation |
| **Volume MA Length** | 20 | 5-100 | Period for volume average (strength filter) |
## Usage Guide
### Reading the Indicator
1. **MACD Lines (Blue & Orange)**
- **Blue Line (MACD)**: Volume-weighted price momentum
- **Orange Line (Signal)**: Smoothed trend of MACD
- **Crossovers**: Blue crosses above orange = bullish, below = bearish
- **Distance**: Wider gap = stronger momentum
- **Zero Line Position**: Above = bullish bias, below = bearish bias
2. **Histogram Colors**
- **Dark Green (#1B5E20)**: Strong bullish move with high volume - **most reliable buy signal**
- **Light Teal (#26A69A)**: Bullish but low volume - wait for confirmation
- **Dark Red (#B71C1C)**: Strong bearish move with high volume - **most reliable sell signal**
- **Light Pink (#FFCDD2)**: Bearish but low volume - may be temporary dip
3. **Background Divergence Alerts**
- **Green Background**: A/D accumulating while price weak - potential bottom
- **Red Background**: A/D distributing while price strong - potential top
- Most powerful at key support/resistance levels
### Trading Strategies
#### Strategy 1: Volume-Confirmed Trend Following
1. Wait for MACD to cross above zero line
2. Look for **dark green** histogram bars (high volume confirmation)
3. Enter long on second consecutive dark green bar
4. Hold while histogram remains green
5. Exit when histogram turns light green or red appears
6. Set stop below recent swing low
**Example**:
```
Price: 26,400 → 26,450 (rising)
MACD: -50 → +20 (crosses zero)
Histogram: Light teal → Dark green → Dark green
Volume: 50k → 75k → 90k (increasing)
```
#### Strategy 2: Divergence Reversal Trading
1. Identify divergence background (green = bullish, red = bearish)
2. Confirm with price structure (support/resistance, chart patterns)
3. Wait for MACD to cross signal line in divergence direction
4. Enter on first **dark colored** histogram bar after divergence
5. Set stop beyond divergence area
6. Target previous swing high/low
**Example - Bullish Divergence**:
```
Price: Making lower lows (26,350 → 26,300 → 26,250)
A/D: Rising (accumulation)
MACD: Below zero but starting to curve up
Background: Green shading appears
Entry: MACD crosses signal line + dark green bar
Stop: Below 26,230
Target: 26,450 (previous high)
```
#### Strategy 3: Momentum Scalping
1. Trade only in direction of MACD zero line (above = long, below = short)
2. Enter on dark colored bars only
3. Exit on first light colored bar or opposite color
4. Quick in and out (1-5 minute holds)
5. Tight stops (0.2-0.5% depending on instrument)
#### Strategy 4: Histogram Pattern Trading
**V-Bottom Reversal (Bullish)**:
- Red histogram bars start rising (becoming less negative)
- Forms "V" shape at the bottom
- Transitions to light red → light teal → **dark green**
- Entry: First dark green bar
- Signal: Momentum reversal with volume
**Λ-Top Reversal (Bearish)**:
- Green histogram bars start falling (becoming less positive)
- Forms inverted "V" at the top
- Transitions to light green → light pink → **dark red**
- Entry: First dark red bar
- Signal: Momentum exhaustion with volume
### Multi-Timeframe Analysis
**Recommended Approach**:
1. **Higher Timeframe (15m/1h)**: Identify overall trend direction
2. **Trading Timeframe (5m)**: Time entries using VMACDv3 signals
3. **Lower Timeframe (1m)**: Fine-tune entry prices
**Example Setup**:
```
15-minute: MACD above zero (bullish bias)
5-minute: Dark green histogram appears after pullback
1-minute: Enter on break of recent high with volume
```
### Volume Strength Interpretation
The volume filter compares current volume to 20-period average:
- **Volume > Average**: Dark colors (green/red) - high confidence signals
- **Volume < Average**: Light colors (teal/pink) - lower confidence signals
**Trading Rules**:
- ✓ **Aggressive**: Take all dark colored signals
- ✓ **Conservative**: Only take dark colors that follow 2+ light colors of same type
- ✗ **Avoid**: Trading light colored signals during high volatility
- ✗ **Avoid**: Ignoring volume context during news events
## Technical Details
### Volume-Weighted Calculation
```pine
// Volume-weighted fast EMA
fast_ma = ta.ema(src * volume, fast_length) / ta.ema(volume, fast_length)
// Volume-weighted slow EMA
slow_ma = ta.ema(src * volume, slow_length) / ta.ema(volume, slow_length)
// MACD is the difference
macd = fast_ma - slow_ma
// Signal line smoothing
signal = ta.ema(macd, signal_length) // or ta.sma() if SMA selected
// Histogram
hist = macd - signal
```
### Divergence Detection Logic
```pine
// A/D trending up if above its 5-period SMA
ad_trend = ad > ta.sma(ad, 5)
// MACD trending up if above zero
macd_trend = macd > 0
// Divergence when trends oppose each other
divergence = ad_trend != macd_trend
// Specific conditions for alerts
bullish_divergence = ad_trend and not macd_trend and macd < 0
bearish_divergence = not ad_trend and macd_trend and macd > 0
```
### Histogram Coloring Logic
```pine
hist_color = (hist >= 0
? (hist < hist
? (vol_strength ? #1B5E20 : #26A69A) // Rising: dark/light green
: #B2DFDB) // Positive but falling: cyan
: (hist < hist
? (vol_strength ? #B71C1C : #FFCDD2) // Rising (less negative): dark/light red
: #FF5252)) // Falling more: bright red
```
## Alerts
Built-in alert conditions for divergence detection:
### Bullish Divergence Alert
- **Trigger**: A/D trending up, MACD negative and trending down
- **Message**: "Bullish Divergence: A/D trending up but MACD trending down"
- **Use Case**: Potential reversal or continuation after pullback
- **Action**: Look for long entry setups
### Bearish Divergence Alert
- **Trigger**: A/D trending down, MACD positive and trending up
- **Message**: "Bearish Divergence: A/D trending down but MACD trending up"
- **Use Case**: Potential top or trend reversal
- **Action**: Consider exits or short entries
### Setting Up Alerts
1. Click "Create Alert" in TradingView
2. Condition: Select "VMACDv3"
3. Choose alert type: "Bullish Divergence" or "Bearish Divergence"
4. Configure: Email, SMS, webhook, or popup
5. Set frequency: "Once Per Bar Close" recommended
## Comparison Tables
### VMACDv3 vs Standard MACD
| Feature | Standard MACD | VMACDv3 |
|---------|---------------|---------|
| **Price Weighting** | Equal weight all bars | Volume-weighted |
| **Sensitivity** | Fixed | Adaptive to volume |
| **False Signals** | More during low volume | Fewer (volume filter) |
| **Divergence** | Price vs MACD | A/D vs MACD |
| **Volume Analysis** | None | Built-in |
| **Color System** | 2 colors | 4+ colors |
| **Best For** | Simple trend following | Volume-confirmed trading |
### VMACDv3 vs ACCDv3
| Aspect | VMACDv3 | ACCDv3 |
|--------|---------|--------|
| **Focus** | Price momentum | Volume distribution |
| **Reactivity** | Faster to price moves | Faster to volume shifts |
| **Best Markets** | Trending, breakouts | Accumulation/distribution phases |
| **Signal Type** | Where price + volume going | Where smart money positioning |
| **Divergence Meaning** | Volume vs price disagreement | A/D vs momentum disagreement |
| **Use Together?** | ✓ Yes, complementary | ✓ Yes, different perspectives |
## Example Trading Scenarios
### Scenario 1: Strong Bullish Breakout
```
Time: 9:30 AM (market open)
Price: Breaks above 26,400 resistance
MACD: Crosses above zero line
Histogram: Dark green bars (#1B5E20)
Volume: 2x average (150k vs 75k avg)
A/D: Rising (no divergence)
Action: Enter long at 26,405
Stop: 26,380 (below breakout)
Target 1: 26,450 (risk:reward 1:2)
Target 2: 26,500 (risk:reward 1:4)
Result: High probability setup with volume confirmation
```
### Scenario 2: False Breakout (Avoided)
```
Time: 2:30 PM (slow period)
Price: Breaks above 26,400 resistance
MACD: Slightly positive
Histogram: Light teal bars (#26A69A)
Volume: 0.5x average (40k vs 75k avg)
A/D: Flat/declining
Action: Avoid trade
Reason: Low volume, no conviction, potential false breakout
Outcome: Price reverses back below 26,400 within 10 minutes
Saved: Avoided losing trade due to volume filter
```
### Scenario 3: Bullish Divergence Bottom
```
Time: 11:00 AM
Price: Making lower lows (26,350 → 26,300 → 26,280)
MACD: Below zero but curving upward
Histogram: Red bars getting shorter (V-bottom forming)
Background: Green shading (divergence alert)
A/D: Rising despite price falling
Volume: Increasing on down bars
Setup:
1. Divergence appears at 26,280 (green background)
2. Wait for MACD to cross signal line
3. First dark green bar appears at 26,290
4. Enter long: 26,295 (next bar open)
5. Stop: 26,265 (below divergence low)
6. Target: 26,350 (previous swing high)
Result: +55 points (30 point risk, 1.8:1 reward)
Key: Divergence + volume confirmation = high probability reversal
```
### Scenario 4: Bearish Divergence Top
```
Time: 1:45 PM
Price: Making higher highs (26,500 → 26,520 → 26,540)
MACD: Positive but flattening
Histogram: Green bars getting shorter (Λ-top forming)
Background: Red shading (bearish divergence)
A/D: Declining despite rising price
Volume: Decreasing on up bars
Setup:
1. Bearish divergence at 26,540 (red background)
2. MACD crosses below signal line
3. First dark red bar appears at 26,535
4. Enter short: 26,530
5. Stop: 26,555 (above divergence high)
6. Target: 26,475 (support level)
Result: +55 points (25 point risk, 2.2:1 reward)
Key: Distribution while price rising = smart money exiting
```
### Scenario 5: V-Bottom Reversal
```
Downtrend in progress
MACD: Deep below zero (-150)
Histogram: Series of dark red bars
Pattern Development:
Bar 1: Dark red, hist = -80, falling
Bar 2: Dark red, hist = -95, falling
Bar 3: Dark red, hist = -100, falling (extreme)
Bar 4: Light pink, hist = -98, rising!
Bar 5: Light pink, hist = -90, rising
Bar 6: Light teal, hist = -75, rising (crosses to positive momentum)
Bar 7: Dark green, hist = -55, rising + volume
Action: Enter long on Bar 7
Reason: V-bottom confirmed with volume
Stop: Below Bar 3 low
Target: Zero line on histogram (mean reversion)
```
## Best Practices
### Entry Rules
✓ **Wait for dark colors**: High-volume confirmation is key
✓ **Confirm divergences**: Use with price support/resistance
✓ **Trade with zero line**: Long above, short below for best odds
✓ **Multiple timeframes**: Align 1m, 5m, 15m signals
✓ **Watch for patterns**: V-bottoms and Λ-tops are reliable
### Exit Rules
✓ **Partial profits**: Take 50% at first target
✓ **Trail stops**: Use histogram color changes
✓ **Respect signals**: Exit on opposite dark color
✓ **Time stops**: Close positions before major news
✓ **End of day**: Square up before close
### Avoid
✗ **Don't chase light colors**: Low volume = low confidence
✗ **Don't ignore divergence**: Early warning system
✗ **Don't overtrade**: Wait for clear setups
✗ **Don't fight the trend**: Zero line dictates bias
✗ **Don't skip stops**: Always use risk management
## Risk Management
### Position Sizing
- **Dark green/red signals**: 1-2% account risk
- **Light signals**: 0.5% account risk or skip
- **Divergence plays**: 1% account risk (higher uncertainty)
- **Multiple confirmations**: Up to 2% account risk
### Stop Loss Placement
- **Trend trades**: Below/above recent swing (20-30 points typical)
- **Breakout trades**: Below/above breakout level (15-25 points)
- **Divergence trades**: Beyond divergence extreme (25-40 points)
- **Scalp trades**: Tight stops at 10-15 points
### Profit Targets
- **Minimum**: 1.5:1 reward to risk ratio
- **Scalps**: 15-25 points (quick in/out)
- **Swing**: 50-100 points (hold through pullbacks)
- **Runners**: Trail with histogram color changes
## Timeframe Recommendations
| Timeframe | Trading Style | Typical Hold | Advantages | Challenges |
|-----------|---------------|--------------|------------|------------|
| **1-minute** | Scalping | 1-5 minutes | Fast profits, many setups | Noisy, high false signals |
| **5-minute** | Intraday | 15-60 minutes | Balance of speed/clarity | Still requires quick decisions |
| **15-minute** | Swing | 1-4 hours | Clearer trends, less noise | Fewer opportunities |
| **1-hour** | Position | 4-24 hours | Strong signals, less monitoring | Wider stops required |
**Recommendation**: Start with 5-minute for best balance of signal quality and opportunity frequency.
## Combining with Other Indicators
### VMACDv3 + ACCDv3
- **Use**: Confirm volume flow with price momentum
- **Signal**: Both showing dark green = highest conviction long
- **Divergence**: VMACDv3 bullish + ACCDv3 bearish = examine price action
### VMACDv3 + RSI
- **Use**: Overbought/oversold with momentum confirmation
- **Signal**: RSI < 30 + dark green VMACD = strong reversal
- **Caution**: RSI > 70 + light green VMACD = potential false breakout
### VMACDv3 + Elder Impulse
- **Use**: Bar coloring + histogram confirmation
- **Signal**: Green Elder bars + dark green VMACD = aligned momentum
- **Exit**: Blue Elder bars + light colors = momentum stalling
## Limitations
- **Requires volume data**: Will not work on instruments without volume feed
- **Lagging indicator**: MACD inherently follows price (2-3 bar delay)
- **Consolidation noise**: Generates false signals in tight ranges
- **Gap handling**: Large gaps can distort volume-weighted values
- **Not standalone**: Should combine with price action and support/resistance
## Troubleshooting
**Problem**: Too many light colored signals
**Solution**: Increase Volume MA Length to 30-40 for stricter filtering
**Problem**: Missing entries due to waiting for dark colors
**Solution**: Lower Volume MA Length to 10-15 for more signals (accept lower quality)
**Problem**: Divergences not appearing
**Solution**: Verify volume data available; check if A/D line is calculating
**Problem**: Histogram colors not changing
**Solution**: Ensure real-time data feed; refresh indicator
## Version History
- **v3**: Removed traditional MACD, using volume-weighted MACD on price with A/D divergence
- **v2**: Added A/D divergence detection, volume strength filtering, enhanced histogram colors
- **v1**: Basic volume-weighted MACD on price
## Related Indicators
**Companion Tools**:
- **ACCDv3**: Volume-weighted MACD on A/D line (distribution focus)
- **RSIv2**: RSI with A/D divergence detection
- **DMI**: Directional Movement Index with A/D divergence
- **Elder Impulse**: Bar coloring system using volume-weighted MACD
**Use Together**: VMACDv3 (momentum) + ACCDv3 (distribution) + Elder Impulse (bar colors) = complete volume-based trading system
---
*This indicator is for educational purposes. Past performance does not guarantee future results. Always practice proper risk management and never risk more than you can afford to lose.*

Daily Range Box (RIC)This indicator draws a blue-bordered box for each trading day, visible across all timeframes without alteration. The box's upper boundary is the day's highest price, the lower boundary is the day's lowest price, starting from the first trade of the day and ending at the last trade (including extended trading hours). A dashed horizontal line is drawn at the midpoint between the high and low within the box.

CCI by DioAdded background color to entry points of the channel for easy observation to levels I am looking at.
HL/2 Fast & Slow - Cloud Signals + Backtest + Exit AlarmsDescription:
This indicator plots two HL/2 moving averages—a fast and a slow line—on the chart, along with dynamic upper and lower bands based on the slow line and ATR. It features a colored cloud between the two averages to visualize trend direction, and it provides buy/sell signals based on the alignment of the two lines.
Key Features:
Fast & Slow HL/2 Averages
Fast and slow HL/2 lines calculated as simple moving averages.
Lines change color based on direction (up/down), configurable via style settings.
Dynamic Upper and Lower Bands
Bands calculated from the slow line using ATR to capture volatility.
Trend Cloud
Fills the area between fast and slow lines.
Green if both lines are rising, red if both are falling, gray if lines disagree.
Transparency adjustable for better visual clarity.
Buy/Sell Signals
Signals appear only when both lines align in the same direction.
Two modes available:
Series Signals: generates a signal whenever the cloud color changes.
Single Signal: generates a signal only when the slow line changes direction.
Signals are plotted as small triangles above/below bars.
Alerts can be set for both buy/sell signals.
Exit Modes and Alerts
Exit positions either on a reverse signal or when the cloud enters a neutral gray zone.
Exit alerts are available for both conditions.
Integrated Backtest Panel
Shows total trades, win rate, and cumulative profit in USD.
Considers position size and commission (configurable).
Panel color indicates profit (green) or loss (red).
Fixed position on chart for easy reference.
Inputs:
Fast and slow periods, ATR length, ATR multiplier.
Position size, commission percentage.
Signal mode (Series or Single).
Exit mode (Reverse Signal or Gray Area).
Style options for line colors and cloud colors.
Time window for backtesting (daily, weekly, monthly, or custom date range).
Usage:
Ideal for identifying trend direction and potential entry points.
Can be used for manual trading or as part of an automated strategy with alerts.
Provides a visual and statistical overview of trading performance via the backtest panel.

KSL-Fullsystem V2.0Trend Following & Reversal Trading System. It combines **Price Action (Market Structure)** with multiple technical indicators to generate high-quality Buy and Sell signals.
---
1. How Signals are Generated (The Core Logic)
The script uses **"Internal Shifts"** (Market Structure Breaks) to find entry points.
* BUY Signal: The price breaks above a previous bearish structure (Higher High) + All enabled filters are Green.
* SELL Signal: The price breaks below a previous bullish structure (Lower Low) + All enabled filters are Red.
When a signal occurs, the script automatically calculates:
* Stop Loss (SL): Based on the recent Swing High/Low.
* Take Profit (TP): Three levels (TP1, TP2, TP3) based on risk-reward ratios (1.5x, 2.0x, 3.0x).
---
2. The Filters (Your Confirmation Checklist)
You can turn these On/Off in the settings. **Note:** If you turn *all* of them on, you might get very few signals because the conditions become too strict.
**A. Bollinger Bands (BB) Filters (Primary Feature)**
This is the main filter for this version.
* Squeeze Filter: Prevents trading when the bands are too narrow (low volatility). If the background turns **Yellow**, it means the market is "Squeezing" – **Do Not Trade.**
* Touch Entry: Looks for price bouncing off the Lower Band (Buy) or Upper Band (Sell).
* Breakout Entry: Looks for price blasting through the bands.
* Mean Reversion: Checks if price is reverting to the middle line (Basis).
**B. Moving Average Filters (Trend)**
The script includes three types of Moving Averages. You can choose which style suits you:
* EMA (Exponential): Fast-reacting. Good for scalping.
* SMA (Simple): Standard trend lines. Good for position trading.
* LWMA (Linear Weighted): Focuses heavily on recent data.
* Configuration: You can select specific setups like "Scalping" (9/21/50 EMA) or "Trend" (50/200 EMA).
**C. Momentum Filters**
* MACD: Checks momentum. You can choose settings for Scalping, Day Trading, or Swing Trading.
* AO (Awesome Oscillator) & AC: Helps confirm if the momentum is strong enough to support the trend.
---
**3. Visual Guide: What You See on the Chart**
* Green Box: A Buy Zone (Demand).
* Red Box: A Sell Zone (Supply).
* Labels (Text): Shows "BUY" or "SELL" with exact prices for TP1, TP2, TP3, and SL.
* Blue Lines: The Bollinger Bands (Upper and Lower).
* Orange Line: The Bollinger Band Basis (Middle).
* Small Triangles:
* Green Triangle (Below Bar): Price touched the Lower Bollinger Band.
* Red Triangle (Above Bar): Price touched the Upper Bollinger Band.
* Yellow Background: **WARNING.** The market has low volume/volatility (BB Squeeze). Wait for a breakout.
---
4. How to Use This Script
1. Select Your Style: Go to the Settings (Inputs).
* If you are a **Scalper**, turn on "Scalping EMA" or "Scalping MACD".
* If you are a **Swing Trader**, turn on "Swing SMA" or "Trend EMA".
2. Configure Bollinger Bands: Keep `Use Bollinger Bands Filter` checked. Decide if you want to trade "Squeezes" (usually safer to avoid them).
3. Wait for the Label: Do not enter blindly. Wait for the script to print a **BUY** or **SELL** label with the TP/SL targets.
4. Check the Background: If the background is **Yellow**, ignore the signal or wait until the color clears.
5. Manage Risk: Place your Stop Loss at the price shown on the label ("SL").

8EMA+BB-SubiProvides the facility to display 8 EMAs along with Bollinger Bands in the same indicator.

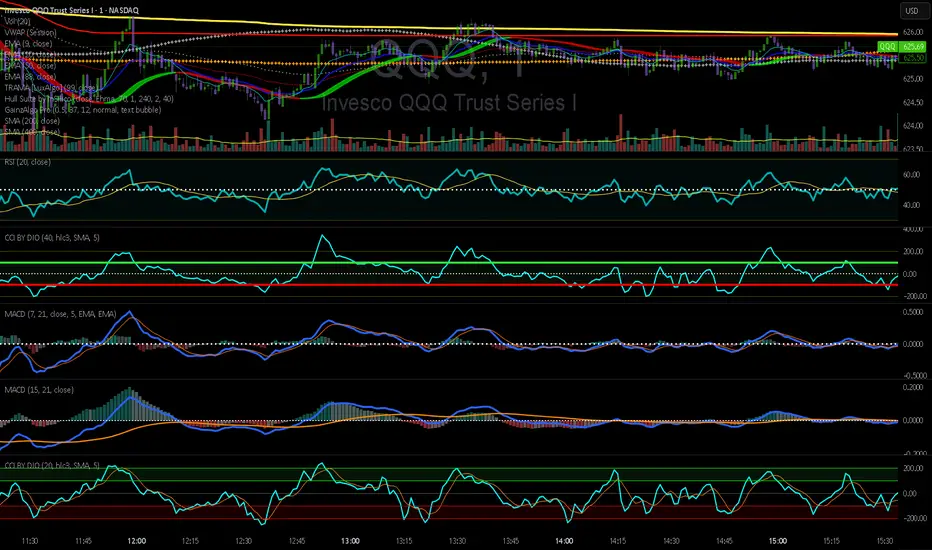
QQQ Long - Aggressive Aggressive Entry (Intraday Breakout)
Parameter Details
Entry Zone Break >626.5 on 15m candle close
Entry Condition 1. Reclaim and hold above VWAP. 2. RSI>60. 3. MACD (15min) zero-line cross. 4. ADDQ positive, TICK > +400.
Stop 623.0
Take Profit 630 (first), 635 (second)
Position Size 1R (smaller timeframe, tighter stop)
Time Invalidation Flatten EOD if fails to hold above 625.
Chart Reference 15m VWAP compression; confirms strong thrust signal supported by positive breadth (ADD/TICK).
________________________________________

QQQ - 8 Dec - Long Tier 2Tier 2 Entry (Balanced Swing)
Parameter Details
Entry Zone 621.5–623
Entry Condition 1. Hourly candle closes above VWAP and 9-EMA. 2. RSI(1H) crosses above 55. 3. Volume > prior 5-bar average.
Stop 616.5 (gamma flip line)
Take Profit 1 632 (upper expected move bound)
Take Profit 2 636 extension if FOMC dovish
Position Size 0.75R
Time Invalidation Dec 12—reduce exposure into event volatility
Chart Reference 4H EMA alignment trending up (9>20>50); price above 623 confirms structure.

rosha xau-usd 3.1.6 (v6)one of my fresh creations, use to trade profitably, includes months of my analysis and sgreen time for you all xauusd traders

Regression value📌 The Regression Value Indicator visually displays the linear regression value calculated based on the price flow of the selected period on the chart, and simply extends the regression slope forward on the chart.
It does not determine market direction or buy/sell signals or guarantee specific results, and is a visual tool for reference in price flow interpretation.
■ Unique Logic Description
The indicator operates based on the following two elements:
1) Linear Regression Value Calculation: The
linear regression base value is calculated using the closing prices for the user-specified period (regression value (Bars)).
Based on the change in the slope of the regression line, a line is generated that continuously connects the currently calculated regression flow forward.
This function is for visually confirming the calculated regression slope and
does not indicate or evaluate the price.
2) Moving Average: Auxiliary Visualization: You can refer to the positional relationship between the regression flow and the moving average
by displaying the Fast / Slow moving average together . The moving average is made transparent to minimize overlap with the main visual element.
■ Purpose of the indicator
Easily check the current regression reference value and slope flow
Visually understand the morphological flow in which direction the regression slope is continuing
Refer to the relationship with the moving average to supplement the market environment
Use as a visualization tool to assist chart analysis without providing a specific signal
■ Visual components
✔ Regression line extension line This displays
the value calculated based on the regression reference value and slope
forward by the user-specified length.
The extended line section is composed of an independent line.new() structure
to linearly show the regression-based flow.
Solid / Dashed / Dotted style and color/thickness can be adjusted.
✔ Moving average display
Fast Fast MA
Gentle Slow MA
This is for reference when analyzing regression flow, and does not affect the core functions of the indicator.
■ Description of user input options (focused on accurate functions)
▸ Regression value (Bars)
Set the period to be used for calculating the regression value .
Calculate the regression reference value for the period, and connect the calculated slopes at equal intervals
to display the line forward by the user-specified length.
▸ Fast MA Length / Slow MA Length
Set the moving average calculation period.
This is an auxiliary element for checking the trend, and does not directly affect the regression extension calculation.
▸ Line Width / Color / Style
Adjust the visual form of the extended line.
Users can freely change it for chart readability.
■ Repaint Information:
The regression reference value is recalculated each time the closing price of the current bar changes, so
the value may change in the current bar that is in progress.
This is a characteristic of the regression calculation, not a repaint that modifies past values.
The extended line is also generated solely based on the regression slope at the time of calculation, and
the extended line of the bar that has already passed does not change.
■ Notes on Use:
This indicator is a tool that simply visually displays the regression-based flow and
does not suggest price levels, directions, or performance.
It does not replace trading decisions and
is best interpreted comprehensively alongside other indicators or market structure.
Regression-based calculations only reflect data characteristics and
do not include external factors such as market volatility and news.
■ Summary:
It calculates the regression reference value and slope for a specific period and simply extends the slope at equal intervals.
It does not imply directionality, but is a visual tool for analysis reference and provides a moving average. It is
user-configurable (length, color, style). Past values are calculated in a structure that is not modified.

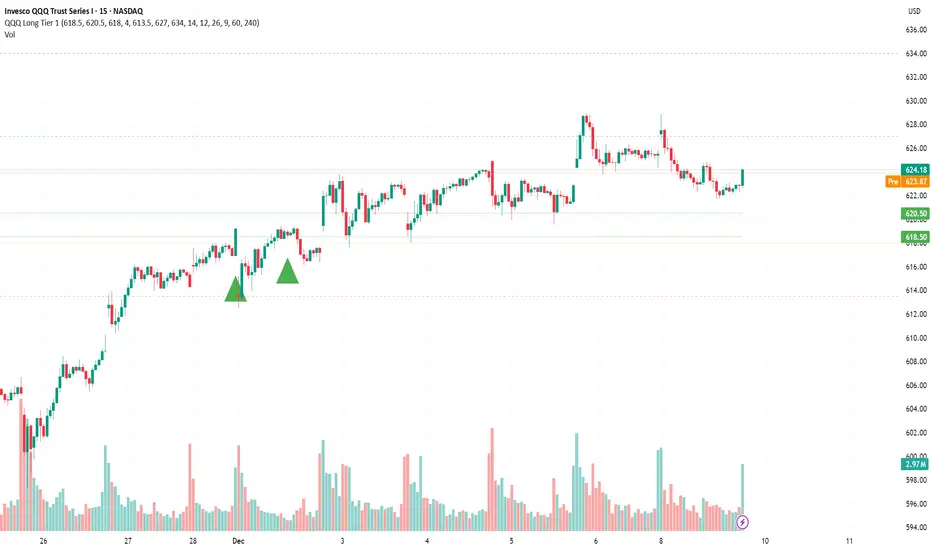
QQQ - 8 Dec - Long Tier 1 Tier 1 Entry (Conservative)
Parameter Details
Entry Zone 618.5–620.5
Entry Condition 1. Price closes >1H VWAP after intraday sweep of 618. 2. RSI(15m) > 45. 3. MACD 4H histogram positive and rising.
Stop 613.5 (below VRVP HVN and 20EMA daily cluster)
Take Profit 1 627.0
Take Profit 2 634.0 (call wall)
Position Size 0.5R (reduced due to low IV and positive gamma pin)
Time Invalidation Exit by Dec 11 pre-FOMC if no breakout over 627
Chart Reference QQQ Daily VRVP and 4H structure show base above 618 EMA cluster; OBV confirms accumulation.
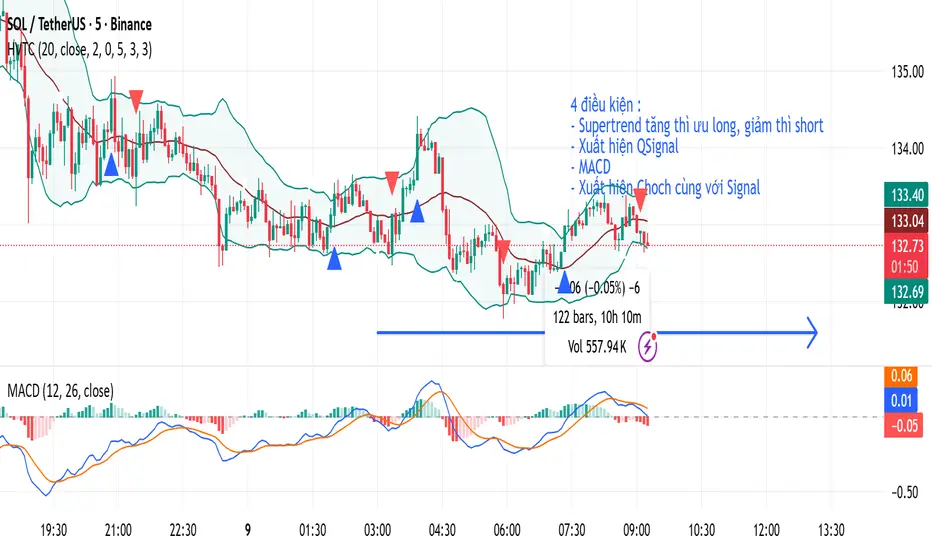
HVTCHVTC – SMC Market Structure & Trend Indicator
HVTC is a Smart Money Concepts–based tool that helps traders visualize market structure and trend direction with clarity.
Features:
CHoCH & BOS Detection
Automatically identifies structural shifts using true SMC logic and labels them directly on the chart.
Trend Filter
Confirms bullish or bearish conditions using an internal trend system to keep trades aligned with the major direction.
EMA 25 Guide
EMA 25 acts as dynamic support/resistance, helping define momentum and bias.
Alerts (Optional)
Notify traders when CHoCH/BOS or key retests occur—ideal for those who don’t monitor charts continuously.
Use Cases:
Works for Crypto, Forex, Gold, Indices, and Stocks across all timeframes. Helps improve entries, exits, and overall market understanding based on institutional structure.
Not financial advice. Use with proper risk management.
QQQ Long Tier 1 (Conservative) - 4-Bar SweepTier 1 Entry (Conservative)
Parameter Details
Entry Zone 618.5–620.5
Entry Condition 1. Price closes >1H VWAP after intraday sweep of 618. 2. RSI(15m) > 45. 3. MACD 4H histogram positive and rising.
Stop 613.5 (below VRVP HVN and 20EMA daily cluster)
Take Profit 1 627.0
Take Profit 2 634.0 (call wall)
Position Size 0.5R (reduced due to low IV and positive gamma pin)
Time Invalidation Exit by Dec 11 pre-FOMC if no breakout over 627
Chart Reference QQQ Daily VRVP and 4H structure show base above 618 EMA cluster; OBV confirms accumulation.

RSI AND CHARTSTORYRsi value on chart with 4 levels 20,40,60,80 and also rsi value and price with current candle. All are plot on chart so one can find easy divergence on chart.
