Auto Channel DetectorChannel Detector — Indicator Description:
The Channel Detector is a powerful TradingView indicator designed to automatically identify market channels and display them directly on the chart. Using structural swing points and trend-based logic, the tool recognizes parallel price movement and draws the upper and lower boundaries of each channel with precision. A midpoint line is plotted through the center of the channel to help visualize equilibrium and potential reaction zones.
This indicator highlights trending and consolidating behavior by mapping the most relevant channels as price develops. Whether the market is rising, falling, or ranging, the Channel Detector provides a clear visual structure that traders can use to interpret price action, anticipate breakouts, and refine trade entries.
Fully customizable, it allows users to adjust line styles, colors, and visibility options to match any trading style or chart layout. The result is a clean and intuitive tool that brings structure, context, and clarity to market movement.
Bandas e Canais

Grok/Claude Turtle Soup Alert SystemReplaces previous Turtle Soup Strategy/Indicator as Tradingview will not let me update it.
# 🥣 Turtle Soup Strategy (Enhanced)
## A Mean-Reversion Strategy Based on Failed Breakouts
---
## Historical Origins
### The Original Turtle Traders (1983-1988)
The Turtle Trading system is one of the most famous experiments in trading history. In 1983, legendary commodities trader **Richard Dennis** made a bet with his partner **William Eckhardt** about whether great traders were born or made. Dennis believed trading could be taught; Eckhardt believed it was innate.
To settle the debate, Dennis recruited 23 ordinary people through newspaper ads—including a professional blackjack player, a fantasy game designer, and an accountant—and taught them his trading system in just two weeks. He called them "Turtles" after turtle farms he had visited in Singapore, saying *"We are going to grow traders just like they grow turtles in Singapore."*
The results were extraordinary. Over the next five years, the Turtles reportedly earned over **$175 million in profits**. The experiment proved Dennis right: trading could indeed be taught.
#### The Original Turtle Rules:
- **Entry:** Buy when price breaks above the 20-day high (System 1) or 55-day high (System 2)
- **Exit:** Sell when price breaks below the 10-day low (System 1) or 20-day low (System 2)
- **Stop Loss:** 2x ATR (Average True Range) from entry
- **Position Sizing:** Based on volatility (ATR)
- **Philosophy:** Pure trend-following—catch big moves by riding breakouts
The Turtle system was a **trend-following** strategy that assumed breakouts would lead to sustained trends. It worked brilliantly in trending markets but suffered during choppy, range-bound conditions.
---
### The Turtle Soup Strategy (1990s)
In the 1990s, renowned trader **Linda Bradford Raschke** (along with Larry Connors) observed something interesting: many of the breakouts that the Turtle system traded actually *failed*. Price would spike above the 20-day high, trigger Turtle buy orders, then immediately reverse—trapping the breakout traders.
Raschke realized these failed breakouts were predictable and tradeable. She developed the **Turtle Soup** strategy, which does the *exact opposite* of the original Turtle system:
> *"Instead of buying the breakout, we wait for it to fail—then fade it."*
The name "Turtle Soup" is a clever play on words: the strategy essentially "eats" the Turtles by trading against them when their breakouts fail.
#### Original Turtle Soup Rules:
- **Setup:** Price makes a new 20-day high (or low)
- **Qualifier:** The previous 20-day high must be at least 3-4 days old (not a fresh breakout)
- **Entry Trigger:** Price reverses back inside the channel (failed breakout)
- **Entry:** Go SHORT (against the failed breakout above), or LONG (against the failed breakdown below)
- **Philosophy:** Mean-reversion—fade false breakouts and profit from trapped traders
#### Turtle Soup Plus One Variant:
Raschke also developed a more conservative variant called "Turtle Soup Plus One" which waits for the *next bar* after the breakout to confirm the failure before entering. This reduces false signals but may miss some opportunities.
---
## Our Enhanced Turtle Soup Strategy
We have taken the classic Turtle Soup concept and enhanced it with modern technical indicators and filters to improve signal quality and adapt to today's markets.
### Core Logic Preserved
The fundamental strategy remains true to Raschke's original concept:
| Turtle (Original) | Turtle Soup (Our Strategy) |
|-------------------|---------------------------|
| BUY breakout above 20-day high | SHORT when that breakout FAILS |
| SELL breakout below 20-day low | LONG when that breakdown FAILS |
| Trend-following | Mean-reversion |
| "The trend is your friend" | "Failed breakouts trap traders" |
---
### Enhancements & Improvements
#### 1. RSI Exhaustion Filter
**Addition:** RSI must confirm exhaustion before entry
- **For SHORT entries:** RSI > 60 (buyers exhausted)
- **For LONG entries:** RSI < 40 (sellers exhausted)
**Why:** The original Turtle Soup had no momentum filter. Adding RSI ensures we only fade breakouts when the market is showing signs of exhaustion, significantly reducing false signals. This enhancement was inspired by later traders who found RSI extremes (originally 90/10, softened to 60/40) dramatically improved win rates.
#### 2. ADX Trending Filter
**Addition:** ADX must be > 20 for trades to execute
**Why:** While the original Turtle Soup was designed for ranging markets, we found that requiring *some* trend strength (ADX > 20) actually improves results. This ensures we're trading in markets with enough directional movement to create meaningful failed breakouts, rather than random noise in dead markets.
#### 3. Heikin Ashi Smoothing
**Addition:** Optional Heikin Ashi calculations for breakout detection
**Why:** Heikin Ashi candles smooth out price noise and make trend reversals more visible. When enabled, the strategy uses HA values to detect breakouts and failures, reducing whipsaws from erratic price spikes.
#### 4. Dynamic Donchian Channels with Regime Detection
**Addition:** Color-coded channels based on market regime
- 🟢 **Green:** Bullish regime (uptrend + DI+ > DI- + OBV bullish)
- 🔴 **Red:** Bearish regime (downtrend + DI- > DI+ + OBV bearish)
- 🟡 **Yellow:** Neutral regime
**Why:** Visual regime detection helps traders understand the broader market context. The original Turtle Soup had no regime awareness—our enhancement lets traders see at a glance whether conditions favor the strategy.
#### 5. Volume Spike Detection (Optional)
**Addition:** Optional filter requiring volume surge on the breakout bar
**Why:** Failed breakouts are more significant when they occur on high volume. A volume spike on the breakout bar (default 1.2x average) indicates more traders got trapped, creating stronger reversal potential.
#### 6. ATR-Based Stops and Targets
**Addition:** Configurable ATR-based stop losses and profit targets
- **Stop Loss:** 1.5x ATR (default)
- **Profit Target:** 2.0x ATR (default)
**Why:** The original Turtle Soup used fixed stop placement. ATR-based stops adapt to current volatility, providing tighter stops in calm markets and wider stops in volatile conditions.
#### 7. Signal Cooldown
**Addition:** Minimum bars between trades (default 5)
**Why:** Prevents overtrading during choppy conditions where multiple failed breakouts might occur in quick succession.
#### 8. Real-Time Info Panel
**Addition:** Comprehensive dashboard showing:
- Current regime (Bullish/Bearish/Neutral)
- RSI value and zone
- ADX value and trending status
- Breakout status
- Bars since last high/low
- Current setup status
- Position status
**Why:** Gives traders instant visibility into all strategy conditions without needing to check multiple indicators.
---
## Entry Rules Summary
### SHORT Entry (Fading Failed Breakout Above)
1. ✅ Price breaks ABOVE the 20-period Donchian high
2. ✅ Previous 20-period high was at least 1 bar ago
3. ✅ Price closes back BELOW the Donchian high (failed breakout)
4. ✅ RSI > 60 (exhausted buyers)
5. ✅ ADX > 20 (trending market)
6. ✅ Cooldown period met
→ **Enter SHORT**, betting the breakout will fail
### LONG Entry (Fading Failed Breakdown Below)
1. ✅ Price breaks BELOW the 20-period Donchian low
2. ✅ Previous 20-period low was at least 1 bar ago
3. ✅ Price closes back ABOVE the Donchian low (failed breakdown)
4. ✅ RSI < 40 (exhausted sellers)
5. ✅ ADX > 20 (trending market)
6. ✅ Cooldown period met
→ **Enter LONG**, betting the breakdown will fail
---
## Exit Rules
1. **ATR Stop Loss:** Position closed if price moves 1.5x ATR against entry
2. **ATR Profit Target:** Position closed if price moves 2.0x ATR in favor
3. **Channel Exit:** Position closed if price breaks the exit channel in the opposite direction
4. **Mid-Channel Exit:** Position closed if price returns to channel midpoint
---
## Best Market Conditions
The Turtle Soup strategy performs best when:
- ✅ Markets are prone to false breakouts
- ✅ Volatility is moderate (not too low, not extreme)
- ✅ Price is oscillating within a broader range
- ✅ There are clear support/resistance levels
The strategy may struggle when:
- ❌ Strong trends persist (breakouts follow through)
- ❌ Volatility is extremely low (no meaningful breakouts)
- ❌ Markets are in news-driven directional moves
---
## Default Settings
| Parameter | Default | Description |
|-----------|---------|-------------|
| Lookback Period | 20 | Donchian channel period |
| Min Bars Since Extreme | 1 | Bars since last high/low |
| RSI Length | 14 | RSI calculation period |
| RSI Short Level | 60 | RSI must be above this for shorts |
| RSI Long Level | 40 | RSI must be below this for longs |
| ADX Length | 14 | ADX calculation period |
| ADX Threshold | 20 | Minimum ADX for trades |
| ATR Period | 20 | ATR calculation period |
| ATR Stop Multiplier | 1.5 | Stop loss distance in ATR |
| ATR Target Multiplier | 2.0 | Profit target distance in ATR |
| Cooldown Period | 5 | Minimum bars between trades |
| Volume Multiplier | 1.2 | Volume spike threshold |
---
## Philosophy
> *"The Turtle system made millions by following breakouts. The Turtle Soup strategy makes money when those breakouts fail. In trading, there's always someone on the other side of the trade—this strategy profits by being the smart money that fades the trapped breakout traders."*
The beauty of the Turtle Soup strategy is its elegant simplicity: it exploits a known, repeatable pattern (failed breakouts) while using modern filters (RSI, ADX) to improve timing and reduce false signals.
---
## Credits
- **Original Turtle System:** Richard Dennis & William Eckhardt (1983)
- **Turtle Soup Strategy:** Linda Bradford Raschke & Larry Connors (1990s)
- **RSI Enhancement:** Various traders who discovered RSI extremes improve reversal detection
- **This Implementation:** Enhanced with Heikin Ashi smoothing, regime detection, ADX filtering, and comprehensive visualization
---
*"We're not following the turtles—we're making soup out of them."* 🥣

Enhanced Ichimoku CloudDYNAMIC INDICATOR... im a beginer at this so i like to enhance my indicator by adding Visual Elements so that its easier to read for me... here is a visual representation of trend changes.

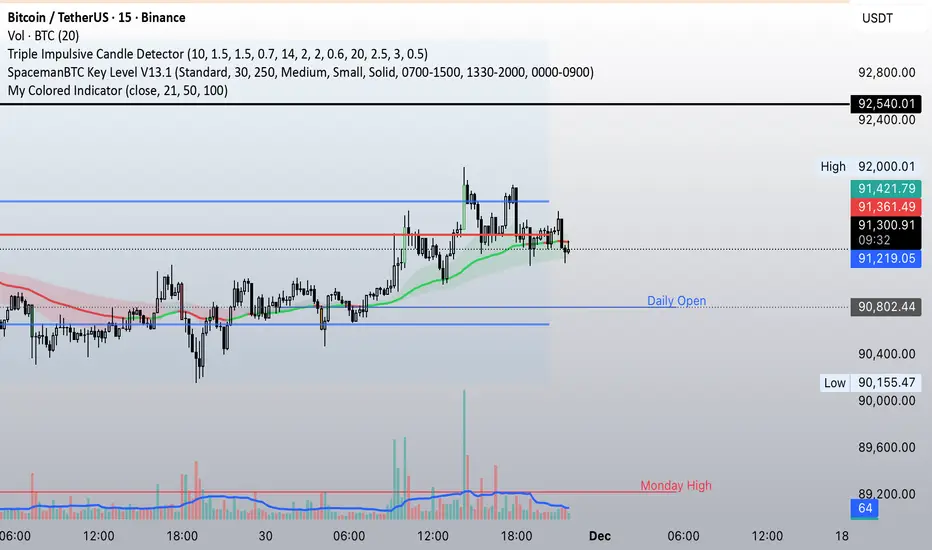
21-50-100 EMA Crossover indicatorSimple EMA crossover indicator visualizing 21-50-100 EMA crossovers.
SPY EMA + VWAP Day Trading Strategy (Market Hours Only)//@version=5
indicator("SPY EMA + VWAP Day Trading Strategy (Market Hours Only)", overlay=true)
// === Market Hours Filter (EST / New York Time) ===
nySession = input.session("0930-1600", "Market Session (NY Time)")
inSession = time(timeframe.period, "America/New_York") >= time(nySession, "America/New_York")
// EMAs
ema9 = ta.ema(close, 9)
ema21 = ta.ema(close, 21)
// VWAP
vwap = ta.vwap(close)
// Plot EMAs & VWAP
plot(ema9, "EMA 9", color=color.green, linewidth=2)
plot(ema21, "EMA 21", color=color.orange, linewidth=2)
plot(vwap, "VWAP", color=color.blue, linewidth=2)
// ----------- Signals -----------
long_raw = close > ema9 and ema9 > ema21 and close > vwap and ta.crossover(ema9, ema21)
short_raw = close < ema9 and ema9 < ema21 and close < vwap and ta.crossunder(ema9, ema21)
// Apply Market Hours Filter
long_signal = long_raw and inSession
short_signal = short_raw and inSession
// Plot Signals
plotshape(long_signal,
title="BUY",
style=shape.labelup,
location=location.belowbar,
color=color.green,
size=size.small,
text="BUY")
plotshape(short_signal,
title="SELL",
style=shape.labeldown,
location=location.abovebar,
color=color.red,
size=size.small,
text="SELL")
// Alerts
alertcondition(long_signal, title="BUY Alert", message="BUY Signal (Market Hours Only)")
alertcondition(short_signal, title="SELL Alert", message="SELL Signal (Market Hours Only)")


Fibot X: GALA Auto StrategyFibot X — GALA Optimized is an algorithmic trading system designed specifically for the GALA/USDT asset.
The algorithm manages trades automatically through a structured multi-target exit model and a predefined stop-loss risk control.
It operates fully autonomously — no external indicators, no manual decisions.
This version is the result of extensive analysis of real market conditions for GALA and comes fully configured.
Users are not required to modify any parameters: the system is pre-calibrated to provide optimal performance while minimizing complexity.
⚠️ Critical Operational Requirements
🔹 Timeframe: 30 minutes only.
All trend detection, entry logic and management layers were engineered and validated exclusively on the 30m timeframe.
Using any other timeframe breaks the model.
🔹 Leverage: strictly x1.
Higher leverage disrupts the internal balance of the strategy and significantly increases risk exposure beyond its intended design.
🔹 Capital Use: 100% allocation.
The take-profit architecture and drawdown control are designed around full equity usage — not partial positions, scaling, or incremental sizing.
Consistency Through System Design
Fibot X does not chase micro-fluctuations, noise or aggressive scalping.
Its purpose is to capture meaningful market swings and convert them into structured profits through intelligent partial exits, avoiding overexposure and premature re-entries.
For long-term stability, the most effective approach is to use multiple Fibot X bots across different assets simultaneously.
Diversifying execution distributes volatility, smooths equity curves and increases system consistency over time — without requiring user intervention.
Philosophy
The strategy’s internal parameters are continuously updated based on performance metrics, ensuring alignment with evolving market conditions and maximizing efficiency within a controlled risk framework.
Fibot X requires no external indicators and no constant monitoring.
Its design is simple: automation, discipline, and consistent execution.

Mean Reversion — BB + Z-Score + RSI + EMA200 (TP at Opposite Z)This is a systematic mean-reversion framework for index futures and other liquid assets.
This strategy combines Bollinger Bands, Z-Score dislocation, RSI extremes, and a trend-filtering EMA200 to capture short-term mean-reversion inefficiencies in NQ1!. It is designed for high-volatility conditions and uses a precise exit model based on opposite-side Z-Score targets and dynamic mid-band failure detection.
🔍 Entry Logic (Mean Reversion) :
The strategy enters trades only when multiple confluence signals align:
Long Setup
Price at or below the lower Bollinger Band
Z-Score ≤ –Threshold (deep statistical deviation)
RSI ≤ oversold level
Price below the EMA-200 (countertrend mean-reversion only)
Cooldown must be completed
No open position
Short Setup
Price at or above the upper Bollinger Band
Z-Score ≥ Threshold
RSI ≥ overbought level
Price above the EMA-200
Cooldown complete
No open position
This multi-signal gate filters out weak reversions and focuses on mature dislocations.
🎯 Take-Profit Model: Opposite-Side Z-Score Target :
Once in a trade, take-profit is set by solving for the price where the Z-Score reaches the opposite side:
Long TP = Z = +Threshold
Short TP = Z = –Threshold
This creates a symmetric statistical exit based on reverting to equilibrium plus overshoot.
🛡️ Stop-Loss System (Volatility-Aware) :
Stop losses combine:
A fixed base stop (points)
A standard-deviation volatility component
This adapts the SL to regime changes and avoids being shaken out during rare volatility spikes.
⏳ Half-Life Exit :
If a trade has not reverted within a fixed number of bars, it automatically closes.
This prevents “mean-reversion traps” during trending periods.
📉 Advanced Mid-Band Exit Logic (BB Basis Failure) :
This is the unique feature of the system.
After entry:
Wait for price to cross the Bollinger Basis (middle band) in the direction of the mean.
Start a 5-bar delay timer.
After 5 bars, the strategy becomes “armed.”
Once armed:
If price fails back through the mean, exit immediately.
Intrabar exits trigger precisely (with tick-level precision if Bar Magnifier is enabled).
This protects profits and exits trades at the first sign of mean-failure.
⏱️ Cooldown System :
After each closed trade, a cooldown period prevents immediate re-entry.
This avoids clustering and improves statistical independence of trades.
🖥️ What This Strategy Is Best For :
High-volatility intraday NQ conditions
Statistical mean reversion with structured confluence
Traders who want clean, rule-based entries
Avoiding trend-day traps using EMA and half-life logic
📊 Included Visual Elements :
Bollinger Bands (Upper, Basis, Lower)
BUY/SELL markers at signal generation
Optional alerts for automated monitoring
🚀 Summary :
This is a precision mean-reversion system built around volatility bands, statistical dislocation, and price-behavior confirmation. By combining Z-Score, RSI, EMA200 filtering, and a sophisticated mid-band failure exit, this model captures high-probability reversions while avoiding the common pitfalls of naive band-touch systems.


NQ-VIX Expected Move LevelsNQ -VIX Daily Price Bands
This indicator plots dynamic intraday price bands for NQ futures based on real-time volatility levels measured by the VIX (CBOE Volatility Index). The bands evolve throughout the trading day, providing volatility-adjusted price targets.
Formulas:
Upper Band = Daily Open + (NQ Price × VIX ÷ √252 ÷ 100)
Lower Band = Daily Open - (NQ Price × VIX ÷ √252 ÷ 100)
The calculation uses the square root of 252 (trading days per year) to convert annualized VIX volatility into an expected daily move, then scales it as a percentage adjustment from the current day's open.
Features:
Real-time band calculation that updates throughout the trading session
Upper band (green) extends from the current day's open
Lower band (red) contracts from the current day's open
Inner upper band (green) at 50% of expected move
Inner lower band (red) at 50% of expected move
Middle Inner upper band (green) at 80% of expected move
Middle Inner lower band (red) at 80% of expected move
Information table displaying:
Current NQ price and VIX level
Daily Open
Expected move

NQ-VIX Expected Move LTF LevelsNQ -VIX LTF Price Bands
This indicator plots dynamic intraday price bands for NQ futures based on real-time volatility levels measured by the VIX (CBOE Volatility Index). The bands evolve throughout the trading day, providing volatility-adjusted price targets.
Formulas:
Upper Band = (Input TF Open) + (NQ Price × VIX x √(Input TF ÷ (23h in min) ) ÷ 100
Lower Band = Daily Open - (NQ Price × VIX x √(Input TF ÷ (23h in min) ) ÷ 100
The calculation uses the square root of Input TF ÷ (23h in min) to convert annualized VIX volatility into an expected TF move, then scales it as a percentage adjustment from the current TF input's open.
Features:
Real-time band calculation that updates throughout the trading session
Upper band (green) extends from the current TF's open
Lower band (red) contracts from the current TF's open
Inner upper band (green) at 50% of expected move
Inner lower band (red) at 50% of expected move
Middle Inner upper band (green) at 80% of expected move
Middle Inner lower band (red) at 80% of expected move
Information table displaying:
Current input TF
Current NQ price and VIX level
Current input TF Open
Expected move

ES-VIX Expected Move LTF LevelsES-VIX LTF Price Bands
This indicator plots dynamic intraday price bands for ES futures based on real-time volatility levels measured by the VIX (CBOE Volatility Index). The bands evolve throughout the trading day, providing volatility-adjusted price targets.
Formulas:
Upper Band = (Input TF Open) + (ES Price × VIX x √(Input TF ÷ (23h in min) ) ÷ 100
Lower Band = Daily Open - (ES Price × VIX x √(Input TF ÷ (23h in min) ) ÷ 100
The calculation uses the square root of Input TF ÷ (23h in min) to convert annualized VIX volatility into an expected TF move, then scales it as a percentage adjustment from the current TF input's open.
Features:
Real-time band calculation that updates throughout the trading session
Upper band (green) extends from the current TF's open
Lower band (red) contracts from the current TF's open
Inner upper band (green) at 50% of expected move
Inner lower band (red) at 50% of expected move
Middle Inner upper band (green) at 80% of expected move
Middle Inner lower band (red) at 80% of expected move
Information table displaying:
Current input TF
Current ES price and VIX level
Current input TF Open
Expected move

Bitcoin Power Law Zones (Dunk)Introduction When viewed on a standard linear chart, Bitcoin’s long-term price action can appear chaotic and exponential. However, when analyzed through the lens of physics and network growth models, a distinct structure emerges.
This indicator implements the Bitcoin Power Law , a mathematical model that suggests Bitcoin’s price evolves in a straight line when plotted against time on a "log-log" scale. By calculating parallel bands around this regression line, we create a "Rainbow" of valuation zones that help investors visualize whether the asset is historically overheated, undervalued, or sitting at fair value.
The Math Behind the Model The Power Law dictates that price scales with time according to the formula: Price = A * (days since genesis)^b
This script uses the specific parameters popularized by recent physics-based analyses of the network: Slope (b): 5.78 (Representing the scaling law of the network adoption). Amplitude (A): 1.45 x 10^-17 (The intercept coefficient).
While simple moving averages react to price, this model is predictive based on time and network growth physics, providing a long-term "gravity" center for the asset.
Guide to the Valuation Zones
Upper Bands (Red/Orange): Extr. Overvalued, High Premium, Overvalued. Historically, these zones have marked cycle peaks where price moved too far, too fast ahead of the network's steady growth. The Baseline (Black Line): Fair Value. The mathematical mean of the Power Law. Price has historically oscillated around this line, treating it as a center of gravity. Lower Bands (Green/Blue): Undervalued, Discount, Deep Discount. These zones represent periods where the market price has historically lagged behind the network's intrinsic value, often marking accumulation phases.
Note: The lowest theoretical tiers ("Bitcoin Dead") have been trimmed from this chart to focus on relevant historical support levels.
How to Use Logarithmic Scale: You MUST set your chart to "Log" scale (bottom right of the TradingView window) for this indicator to function correctly. On a linear chart, the bands will appear to curve upwards aggressively; on a Log chart, they will appear as smooth, parallel channels. Timeframe: This is a macro-economic indicator. It is best viewed on Daily or Weekly timeframes. Overlay Labels: The indicator includes dynamic labels on the right-side axis, allowing you to instantly see the current price requirements for each valuation zone without manually tracing lines.
Credits This script is based on the Power Law theory popularized by Giovanni Santostasi and the original Corridor concepts by Harold Christopher Burger .
Disclaimer This tool is for educational and informational purposes only. It visualizes historical mathematical trends and does not constitute financial advice. Past performance of a model is not indicative of future results.
Further Reading
www.hcburger.com
giovannisantostasi.medium.com

Zig Zag & Trendlines with Dynamic Threshold ATRPercentage Zig Zag with Dynamic Threshold
This Pine Script indicator is an advanced Zig Zag tool that identifies and tracks price pivots based on a percentage move required for reversal, offering a clear visual representation of volatility-adjusted trends.
Core Functionality (The Reversal Threshold):
Unlike standard Zig Zag indicators that use a fixed price difference, this indicator calculates the required reversal size (%X) dynamically using the Average True Range (ATR).
It calculates the ATR as a percentage of the current price (ATR%).
The final threshold is this ATR% multiplied by a user-defined factor (default 3x).
This means the reversal threshold is wider during volatile periods and narrower during quiet periods, adapting automatically to market conditions. Users can optionally revert to a fixed percentage if desired.
Trend Extension Lines:
The indicator draws two unique, dynamic trend lines connecting the last two significant Highs and the last two significant Lows. Crucially, these lines do not wait for the entire Zig Zag leg to confirm:
If the price is actively forming a new up-leg, the High Extension Line connects the last confirmed High to the current extreme high of the active move.
The Low Extension Line functions similarly for the downtrend.
This feature allows the user to visualize dynamic support and resistance levels based on the current, active trend structure defined by the percentage threshold.

Fib Retracement StrategySimple r2m strategy that does pyramid buying and selling based on support and resistance lines, in this case using fib retracements, EMA and SMA lines.

Forex Trend Master FollowerThis indicator is based on slow and fast EMA, like regular EMA cross, but updated. It works the best on trendy pairs like EU, and works the best on 4h time frame. It shows where to entry and where to close the position based on slow EMA. It can be used like additional confluence with FTB entry model, and whole strategy.

Grok/Claude Turtle Soup Strategy # 🥣 Turtle Soup Strategy (Enhanced)
## A Mean-Reversion Strategy Based on Failed Breakouts
---
## Historical Origins
### The Original Turtle Traders (1983-1988)
The Turtle Trading system is one of the most famous experiments in trading history. In 1983, legendary commodities trader **Richard Dennis** made a bet with his partner **William Eckhardt** about whether great traders were born or made. Dennis believed trading could be taught; Eckhardt believed it was innate.
To settle the debate, Dennis recruited 23 ordinary people through newspaper ads—including a professional blackjack player, a fantasy game designer, and an accountant—and taught them his trading system in just two weeks. He called them "Turtles" after turtle farms he had visited in Singapore, saying *"We are going to grow traders just like they grow turtles in Singapore."*
The results were extraordinary. Over the next five years, the Turtles reportedly earned over **$175 million in profits**. The experiment proved Dennis right: trading could indeed be taught.
#### The Original Turtle Rules:
- **Entry:** Buy when price breaks above the 20-day high (System 1) or 55-day high (System 2)
- **Exit:** Sell when price breaks below the 10-day low (System 1) or 20-day low (System 2)
- **Stop Loss:** 2x ATR (Average True Range) from entry
- **Position Sizing:** Based on volatility (ATR)
- **Philosophy:** Pure trend-following—catch big moves by riding breakouts
The Turtle system was a **trend-following** strategy that assumed breakouts would lead to sustained trends. It worked brilliantly in trending markets but suffered during choppy, range-bound conditions.
---
### The Turtle Soup Strategy (1990s)
In the 1990s, renowned trader **Linda Bradford Raschke** (along with Larry Connors) observed something interesting: many of the breakouts that the Turtle system traded actually *failed*. Price would spike above the 20-day high, trigger Turtle buy orders, then immediately reverse—trapping the breakout traders.
Raschke realized these failed breakouts were predictable and tradeable. She developed the **Turtle Soup** strategy, which does the *exact opposite* of the original Turtle system:
> *"Instead of buying the breakout, we wait for it to fail—then fade it."*
The name "Turtle Soup" is a clever play on words: the strategy essentially "eats" the Turtles by trading against them when their breakouts fail.
#### Original Turtle Soup Rules:
- **Setup:** Price makes a new 20-day high (or low)
- **Qualifier:** The previous 20-day high must be at least 3-4 days old (not a fresh breakout)
- **Entry Trigger:** Price reverses back inside the channel (failed breakout)
- **Entry:** Go SHORT (against the failed breakout above), or LONG (against the failed breakdown below)
- **Philosophy:** Mean-reversion—fade false breakouts and profit from trapped traders
#### Turtle Soup Plus One Variant:
Raschke also developed a more conservative variant called "Turtle Soup Plus One" which waits for the *next bar* after the breakout to confirm the failure before entering. This reduces false signals but may miss some opportunities.
---
## Our Enhanced Turtle Soup Strategy
We have taken the classic Turtle Soup concept and enhanced it with modern technical indicators and filters to improve signal quality and adapt to today's markets.
### Core Logic Preserved
The fundamental strategy remains true to Raschke's original concept:
| Turtle (Original) | Turtle Soup (Our Strategy) |
|-------------------|---------------------------|
| BUY breakout above 20-day high | SHORT when that breakout FAILS |
| SELL breakout below 20-day low | LONG when that breakdown FAILS |
| Trend-following | Mean-reversion |
| "The trend is your friend" | "Failed breakouts trap traders" |
---
### Enhancements & Improvements
#### 1. RSI Exhaustion Filter
**Addition:** RSI must confirm exhaustion before entry
- **For SHORT entries:** RSI > 60 (buyers exhausted)
- **For LONG entries:** RSI < 40 (sellers exhausted)
**Why:** The original Turtle Soup had no momentum filter. Adding RSI ensures we only fade breakouts when the market is showing signs of exhaustion, significantly reducing false signals. This enhancement was inspired by later traders who found RSI extremes (originally 90/10, softened to 60/40) dramatically improved win rates.
#### 2. ADX Trending Filter
**Addition:** ADX must be > 20 for trades to execute
**Why:** While the original Turtle Soup was designed for ranging markets, we found that requiring *some* trend strength (ADX > 20) actually improves results. This ensures we're trading in markets with enough directional movement to create meaningful failed breakouts, rather than random noise in dead markets.
#### 3. Heikin Ashi Smoothing
**Addition:** Optional Heikin Ashi calculations for breakout detection
**Why:** Heikin Ashi candles smooth out price noise and make trend reversals more visible. When enabled, the strategy uses HA values to detect breakouts and failures, reducing whipsaws from erratic price spikes.
#### 4. Dynamic Donchian Channels with Regime Detection
**Addition:** Color-coded channels based on market regime
- 🟢 **Green:** Bullish regime (uptrend + DI+ > DI- + OBV bullish)
- 🔴 **Red:** Bearish regime (downtrend + DI- > DI+ + OBV bearish)
- 🟡 **Yellow:** Neutral regime
**Why:** Visual regime detection helps traders understand the broader market context. The original Turtle Soup had no regime awareness—our enhancement lets traders see at a glance whether conditions favor the strategy.
#### 5. Volume Spike Detection (Optional)
**Addition:** Optional filter requiring volume surge on the breakout bar
**Why:** Failed breakouts are more significant when they occur on high volume. A volume spike on the breakout bar (default 1.2x average) indicates more traders got trapped, creating stronger reversal potential.
#### 6. ATR-Based Stops and Targets
**Addition:** Configurable ATR-based stop losses and profit targets
- **Stop Loss:** 1.5x ATR (default)
- **Profit Target:** 2.0x ATR (default)
**Why:** The original Turtle Soup used fixed stop placement. ATR-based stops adapt to current volatility, providing tighter stops in calm markets and wider stops in volatile conditions.
#### 7. Signal Cooldown
**Addition:** Minimum bars between trades (default 5)
**Why:** Prevents overtrading during choppy conditions where multiple failed breakouts might occur in quick succession.
#### 8. Real-Time Info Panel
**Addition:** Comprehensive dashboard showing:
- Current regime (Bullish/Bearish/Neutral)
- RSI value and zone
- ADX value and trending status
- Breakout status
- Bars since last high/low
- Current setup status
- Position status
**Why:** Gives traders instant visibility into all strategy conditions without needing to check multiple indicators.
---
## Entry Rules Summary
### SHORT Entry (Fading Failed Breakout Above)
1. ✅ Price breaks ABOVE the 20-period Donchian high
2. ✅ Previous 20-period high was at least 1 bar ago
3. ✅ Price closes back BELOW the Donchian high (failed breakout)
4. ✅ RSI > 60 (exhausted buyers)
5. ✅ ADX > 20 (trending market)
6. ✅ Cooldown period met
→ **Enter SHORT**, betting the breakout will fail
### LONG Entry (Fading Failed Breakdown Below)
1. ✅ Price breaks BELOW the 20-period Donchian low
2. ✅ Previous 20-period low was at least 1 bar ago
3. ✅ Price closes back ABOVE the Donchian low (failed breakdown)
4. ✅ RSI < 40 (exhausted sellers)
5. ✅ ADX > 20 (trending market)
6. ✅ Cooldown period met
→ **Enter LONG**, betting the breakdown will fail
---
## Exit Rules
1. **ATR Stop Loss:** Position closed if price moves 1.5x ATR against entry
2. **ATR Profit Target:** Position closed if price moves 2.0x ATR in favor
3. **Channel Exit:** Position closed if price breaks the exit channel in the opposite direction
4. **Mid-Channel Exit:** Position closed if price returns to channel midpoint
---
## Best Market Conditions
The Turtle Soup strategy performs best when:
- ✅ Markets are prone to false breakouts
- ✅ Volatility is moderate (not too low, not extreme)
- ✅ Price is oscillating within a broader range
- ✅ There are clear support/resistance levels
The strategy may struggle when:
- ❌ Strong trends persist (breakouts follow through)
- ❌ Volatility is extremely low (no meaningful breakouts)
- ❌ Markets are in news-driven directional moves
---
## Default Settings
| Parameter | Default | Description |
|-----------|---------|-------------|
| Lookback Period | 20 | Donchian channel period |
| Min Bars Since Extreme | 1 | Bars since last high/low |
| RSI Length | 14 | RSI calculation period |
| RSI Short Level | 60 | RSI must be above this for shorts |
| RSI Long Level | 40 | RSI must be below this for longs |
| ADX Length | 14 | ADX calculation period |
| ADX Threshold | 20 | Minimum ADX for trades |
| ATR Period | 20 | ATR calculation period |
| ATR Stop Multiplier | 1.5 | Stop loss distance in ATR |
| ATR Target Multiplier | 2.0 | Profit target distance in ATR |
| Cooldown Period | 5 | Minimum bars between trades |
| Volume Multiplier | 1.2 | Volume spike threshold |
---
## Philosophy
> *"The Turtle system made millions by following breakouts. The Turtle Soup strategy makes money when those breakouts fail. In trading, there's always someone on the other side of the trade—this strategy profits by being the smart money that fades the trapped breakout traders."*
The beauty of the Turtle Soup strategy is its elegant simplicity: it exploits a known, repeatable pattern (failed breakouts) while using modern filters (RSI, ADX) to improve timing and reduce false signals.
---
## Credits
- **Original Turtle System:** Richard Dennis & William Eckhardt (1983)
- **Turtle Soup Strategy:** Linda Bradford Raschke & Larry Connors (1990s)
- **RSI Enhancement:** Various traders who discovered RSI extremes improve reversal detection
- **This Implementation:** Enhanced with Heikin Ashi smoothing, regime detection, ADX filtering, and comprehensive visualization
---
*"We're not following the turtles—we're making soup out of them."* 🥣

Snip Price Action [@17.daavid indicator]All in one
SMC Indicator Snip.
CONTACT: @17.daavid
Instagram

ES-VIX Expected Move - Open basedES-VIX Daily Price Bands
This indicator plots dynamic intraday price bands for ES futures based on real-time volatility levels measured by the VIX (CBOE Volatility Index). The bands evolve throughout the trading day, providing volatility-adjusted price targets.
Formulas:
Upper Band = Daily Open + (ES Price × VIX ÷ √252 ÷ 100)
Lower Band = Daily Open - (ES Price × VIX ÷ √252 ÷ 100)
The calculation uses the square root of 252 (trading days per year) to convert annualized VIX volatility into an expected daily move, then scales it as a percentage adjustment from the current day's open.
Features:
Real-time band calculation that updates throughout the trading session
Upper band (green) extends from the current day's open
Lower band (red) contracts from the current day's open
Inner upper band (green) at 50% of expected move
Inner lower band (red) at 50% of expected move
Middle Inner upper band (green) at 80% of expected move
Middle Inner lower band (red) at 80% of expected move
Information table displaying:
Current ES price and VIX level
Daily Open
Expected move

Ben D"s IndicatorIt Auto Draws and Detects, Channels draws buy and sell signals based on over bought, oversold and a few other indicators. It works on all time frames! Enjoy! Leave a comment if you like it.

Smart Money ProSmart Money Pro V 8.1 is an advanced trading indicator that tracks institutional "smart money" movements using multiple Smart Money Concepts (SMC) techniques:
Market Structure: Identifies Change of Character (CHoCH), Break of Structure (BOS), and Internal/External Market Structure (IDM)
Order Blocks: Detects demand/supply zones including EXT OB, IDM OB, SCOB, and mitigation/breaker blocks
Order Flow: Tracks major and minor order flows with mitigation levels
Fair Value Gaps (FVG): Highlights price inefficiencies and imbalance zones
Liquidity Levels: Maps liquidity sweeps and key pivot levels
Price Structure: Shows OTE (Optimal Trade Entry) zones, PDH/PDL (Previous Day High/Low), equilibrium levels, and swing sweeps
Candle Patterns: Detects Inside and Outside bars
The indicator helps traders identify institutional entry/exit points, liquidity grabs, and high-probability trading zones.
Smart Money Pro V 8.1 هو مؤشر متقدم لتتبع تحركات المؤسسات المالية "الأموال الذكية" باستخدام مفاهيم Smart Money Concepts (SMC):
هيكل السوق: يحدد تغيير الاتجاه (CHoCH)، كسر الهيكل (BOS)، والهيكل الداخلي/الخارجي (IDM)
مناطق الطلب والعرض: يكتشف Order Blocks بأنواعها (EXT OB, IDM OB, SCOB) ومناطق الاختراق والتخفيف
تدفق الأوامر: يتتبع التدفقات الرئيسية والثانوية مع مستويات التخفيف
فجوات القيمة العادلة (FVG): يبرز مناطق عدم الكفاءة السعرية وعدم التوازن
مستويات السيولة: يرسم مصائد السيولة والنقاط المحورية الرئيسية
هيكل السعر: يعرض مناطق OTE (نقاط الدخول المثلى)، أعلى/أدنى سعر سابق (PDH/PDL)، مستويات التوازن، وكسر القمم/القيعان
أنماط الشموع: يكتشف شموع Inside و Outside Bar

EMA Crossover + Angle + Candle Pattern + Breakout (Clean) finalmayank raj 9 15 ema strategy which will give me 1 crore

FVG + Bollinger + Toggles + Swing H&L (Taken/Close modes)This indicator combines multiple advanced market-structure tools into one unified system.
It detects A–C Fair Value Gaps (FVG) and plots them as dynamic boxes projected a fixed number of bars forward.
Each bullish or bearish FVG updates in real time and “closes” once price breaks through the opposite boundary.
The indicator also includes Bollinger Bands based on EMA-50 with adjustable deviation settings for volatility context.
Swing Highs and Swing Lows are identified using pivot logic and are drawn as dynamic lines that change color once taken out.
You can choose whether swings end on a close break or on any touch/violation of the level.
All visual elements—FVGs, Bollinger Bands, and Swing Lines—can be individually toggled on or off from the settings panel.
A time-window session box is included, allowing you to highlight a custom intraday window based on your selected timezone.
The session box automatically tracks the high and low of the window and locks the final range once the window closes.
Overall, the tool is designed for traders who want a structured, multi-layered view of liquidity, volatility, and intraday timing.
