Gold Fair Value [Alpha Extract]Gold-anchored Bitcoin fair value model is a macro-fundamental valuation indicator that anchors Bitcoin price assessment to gold market dynamics, establishing fair value zones through percentage change influence modelling and adaptive band multipliers. This overlay system provides institutional-grade context for identifying accumulation zones, distribution zones, and fair value equilibrium across all market cycles with minimal chart clutter through sophisticated gradient fill visualization.
🔶 Gold-Anchored Valuation Framework
Establishes Bitcoin's theoretical fair value by integrating daily gold price movements into a smoothed asset baseline, applying percentage change calculations over configurable periods to measure gold's momentum influence. The system translates gold's relative strength or weakness into Bitcoin price expectations through adjustable influence multipliers, creating a dynamic fair value line that adapts to shifting macro-fundamental relationships between digital and traditional store-of-value assets.
🔶 Multi-Layer Statistical Band System
Implements asymmetric upper and lower band multipliers applied to the fair value baseline, creating five distinct valuation zones: extreme overvaluation, moderate overvaluation, fair value equilibrium, moderate undervaluation, and extreme undervaluation. The asymmetric configuration (default 1.46x upper, 0.74x lower) reflects Bitcoin's historical tendency toward asymmetric volatility patterns with more violent upside moves and grinding downside action, optimizing zone accuracy for actionable trading decisions.
🔶 Gradient Fill Visualization
Employs sophisticated transparency-based gradient fills between bands to create visually intuitive valuation heat maps, with darker orange shading indicating proximity to fair value and lighter shading showing extreme deviation zones. The system maintains chart readability by hiding individual band lines while preserving the filled zones, eliminating visual clutter while delivering maximum information density for rapid market assessment without overwhelming the trader with excessive line plots.
🔶 Historical Context & Position Management
The lower band zones have historically preceded periods of constructive price behavior including consolidation phases and early-stage recovery rallies, while upper band interactions have preceded distribution and correction events. This historical pattern recognition enables traders to position proactively based on valuation extremes rather than reactively chasing momentum, supporting systematic accumulation during undervaluation periods and graduated profit-taking during overvaluation extremes.
All analysis provided by Alpha Extract is for educational and informational purposes only. The information and publications are not meant to be, and do not constitute, financial, investment, trading, or other types of advice or recommendations.
Bandas e Canais

All-in-One (PHT)All-in-One (PHT) — Modular Multi-Tool Market Analyzer (Pine Script v6)
All-in-One (PHT) is a complete, modular market-analysis toolkit designed for traders who want clean, reliable, and professional-grade charting - in a single indicator.
Built using Pine Script® v6 and structured with reusable PHT-Libraries (EMA Band, Bollinger Band, Fractal, Session), this indicator delivers clarity, precision, and consistent performance across all markets and timeframes.
Unlike traditional indicators that mix logic and visuals, AIO (PHT) uses a fully modular architecture. All calculations come from dedicated libraries, and this main script focuses purely on visual output and clean plotting.
This ensures:
Stable plot references
Zero repainting in all included modules
High performance even with complex overlays
Easy extensibility for future upgrades
🔥 Included Modules
1. EMA Band (PHT Library)
A triple-EMA band designed for trend clarity and structure.
Provides:
EMA of High
EMA of Close
EMA of Low
Band fill visualization
Ideal for identifying trend strength, momentum pockets, and mean-reversion zones.
2. Bollinger Band Suite
A complete Bollinger framework with:
SMA / EMA / WMA midline options
Dual standard-deviation envelopes
Multi-zone band fills (upper, middle, lower)
User-controlled visibility for each layer
Perfect for volatility detection, squeeze identification, and precision envelope trading.
3. Fractal Engine (High/Low Pivots)
Fast, reliable fractal detection using user-defined left/right periods.
Features:
Pivot Highs & Pivot Lows
Multiple marker sizes (Tiny → Large)
Zero-lag plotting with proper offset handling
Useful for swing structure, breakout confirmation, and automated level marking.
4. Market Session Tracker
A powerful session-mapping module that visually highlights market sessions with:
Dynamic session boxes
High & Low markers
Persistent historical sessions
Auto-managed labels, lines, and live updates
Timezone-aware session boundaries (supports IANA zones)
Designed for identifying daily ranges, session liquidity, volatility pockets, and market timing.
🧠 Why This Indicator Is Different
Most “all-in-one” tools mix plotting, logic, and calculations in a single heavy script, causing lag, reference instability, and repainting issues.
All-in-One (PHT) solves this by using a Pine v6 library architecture:
Each component is computed in its own library
The main script handles only visuals
No hidden code, no repainting tricks
Maximum clarity and maintainability
This design mirrors professional software architecture:
clear separation of logic, visuals, and user interface.
🎯 Ideal For
Trend traders
Scalpers & intraday traders
Swing and positional traders
Volatility analysts
Structure-based price action traders
Anyone who wants multiple high-quality tools in one clean indicator
Whether you analyze markets manually or build algorithmic systems, AIO (PHT) provides a solid foundation.
⚙️ Features at a Glance
Fully modular Pine v6 design
Complete EMA band engine
Advanced Bollinger band system (multi-deviation, multi-fill)
Configurable fractal high/low markers
Smart session boxing with history
Clean visuals and transparent settings
No repainting
Fully customizable colors & visibility
Optimized for performance
💡 How to Use
Choose the modules you want to display (EMA, BB, Fractals, Sessions).
Adjust lengths, deviations, or fractal periods as per your trading style.
Use session boxes to understand volatility timing.
Combine bands + fractals for advanced structure-based decisions.
The indicator is designed to overlay on price for maximum clarity.
🚀 Future Upgrades
The PHT framework supports smooth future expansion. Planned modules include:
ATR/volatility engines
Trend switches
Supertrend/Donchian plugins
Volume profile extensions
Updates will remain backward compatible across all modules.
⭐ Summary
All-in-One (PHT) is not just another overlay — it’s a complete multi-tool trading framework built using professional engineering practices in Pine Script v6.
If you want cleaner charts, smarter signals, and a high-performance modular system, this indicator gives you everything in one reliable package.


BB & MTF EMAs + DPOC/WPOCDescription:
This indicator combines multiple trend and support/resistance tools into a single overlay with specific customization for the Indian Standard Time (IST) session.
Features Included:
Bollinger Bands: 20-period SMA Basis, 1.5 StdDev.
4 Multi-Timeframe EMAs:
EMA 1: 9 Length (1m timeframe)
EMA 2: 20 Length (3m timeframe)
EMA 3: 50 Length (15m timeframe)
EMA 4: 200 Length (15m timeframe)
Session POCs (IST):
Daily POC (DPOC): Calculated 05:30-05:29 IST. Extends for full 24h session.
Weekly POC: Calculated from Monday 05:30 IST Open. Extends for full 7-day week.
Controls:
Toggle visibility for all individual components.
"Show Historical" toggle for pivots to see past levels or keep charts clean.

LPC Rebate HunterLPC Rebate Hunter Version 1.3.5
From Static to Dynamic Momentum: Replaced the rigid RSI filter with a Multi-Engine Oscillator (WaveTrend, MFI, or RSI), allowing for smoother cycle detection.
From "Pivots" to "Smart Structure": The liquidity engine now detects Swing Failure Patterns (SFP)—identifying when price "pokes" a level to trap traders before reversing—and automatically cleans up mitigated zones.
Choppy Market Protection: Added an ADX (Average Directional Index) integration to strictly filter out signals during flat/sideways markets.
Risk Management Layer: Introduced a Smart Trailing Stop (ATR-based Chandelier Exit) to help traders manage active positions objectively.
Visual Overhaul: Features a modern gradient trend cloud and a fully adaptive "Heads-Up Display" (HUD) that provides real-time market stats.

Arden SMC OTEThis indicator represents a comprehensive trading system based on Smart Money Concepts (SMC) and Optimal Trade Entry (OTE). The script's key feature is the built-in "Liquidity Trap" filter, which protects the trader from entering positions where the price is highly likely to hunt for stop losses before making the true move.
Key Features:
1. Automatic OTE Search: The indicator identifies market structure (Swing Highs/Lows) on the selected timeframe and draws a Fibonacci grid. Entry is based on the 0.62 level, and the target is the -0.27 extension (or a fixed Risk:Reward ratio).
2. "Liquidity Trap" Filter (Smart Logic):
The algorithm scans the chart for Equal Highs (EQH) and Equal Lows (EQL), based on precise candle body touches.
Protection Logic: If a liquidity zone (EQH/EQL) is located between your entry point and your Stop Loss, the indicator cancels the signal. This saves you from situations where the market maker first "sweeps" liquidity (hits your stop) and only then moves in the desired direction.
3. Flexible Risk Management:
3 Stop Loss modes (Conservative behind the swing, Aggressive behind 0.88 Fib, or ATR-based).
Take Profit selection (Structure-based or fixed RR).
4. SMC Filters:
Equilibrium: Checks if the price is in the Discount zone (for buys) or Premium zone (for sells).
Structure Size: Filters out structures that are too small (noise) using ATR.
How to read the chart:
Grey zones/lines: Your potential trade (Entry, Stop, Take Profit).
Orange boxes: Liquidity Zones (EQH/EQL). If they appear, it means orders have accumulated there.
Labels: "ENTRY 🚀" — entry triggered, "TP HIT" — target reached.
Disclaimer:
This indicator is an assistive tool. Always check the higher timeframe context yourself.
Liquidity Filter Settings
❌ Block on Liquidity (EQH/EQL): The main checkbox. If enabled, the script checks: "Is there an orange liquidity box right before my stop loss?". If yes — no signal is generated.
Show Liquidity Zones: Toggle the visibility of the orange boxes.
Touch Count (cNum): How many times the price must hit the exact same level (body-to-body) for it to count as liquidity. Usually 2 (Double Top/Bottom).
Gap Count (bars): Minimum distance (in bars) between touches.
Confirmation Bars: How many candles must pass after the touch for the zone to be confirmed and drawn.

SEE + RSI Signal with Dual Invalidationrsi mcd and see close signal. when a candle closes below rsi, see and macd the script prints a tiny circle


MaruMaroo's Multi-MA & BB & Ichimoku매매할 때 가장 기본적으로 세팅하는 이동평균선, 볼린저 밴드, 일목균형표를 스크립트 하나로 합쳤습니다.
무료 계정이라 지표 개수 제한(3개) 때문에 불편하셨거나, 이것저것 추가해서 차트 지저분해지는 거 싫으신 분들 쓰시면 됩니다. 복잡한 거 싹 빼고 딱 필요한 기능만 넣어서 최적화했습니다.
7줄 이동평균선 (Rainbow MA): 단기부터 장기까지 7개 라인을 한 번에 보여줍니다. 설정에서 단순(SMA), 지수(EMA)뿐만 아니라 가중(WMA), 거래량가중(VWMA) 등으로 바꿀 수 있습니다.
헷갈림 방지 라벨: 이평선이 많으면 뭐가 60일선이고 120일선인지 헷갈리는데, 선 끝자락에 숫자(기간)가 뜨도록 해서 보기 편하게 만들었습니다. (글자 크기도 키워둠)
볼린저 밴드 & 일목균형표: 표준편차 1, 2배수 밴드랑 일목 구름대까지 다 포함되어 있습니다.
커스텀: 안 쓰는 기능은 설정에서 체크 해제하면 깔끔하게 사라집니다. 입맛대로 세팅해서 쓰세요.
I combined the most essential trading indicators into a single script to keep the chart clean and bypass the indicator limit.
If you are tired of switching between indicators or have a cluttered screen, this "All-in-One" setup is for you. It includes everything you need for trend and volatility analysis.
7 Moving Averages: Covers short to long-term trends (Rainbow setup). You can switch types between SMA, EMA, SMMA, WMA, and VWMA in the settings.
Smart Labels: Added labels at the end of each MA line so you can instantly see which line corresponds to which period (e.g., 20, 60, 120).
Bollinger Bands & Ichimoku: Includes Double Bollinger Bands (StdDev 1 & 2) and the full Ichimoku Cloud system.
Fully Customizable: You can toggle each component ON or OFF in the settings.

RSI + EMA Dynamic Zones + Volume + Divergence (with RSI 50 line)RSI + EMA Dynamic Zones + Volume + Divergence (with RSI 50 line)

UNDETECTED FX - PSYCHOLOGIC LEVELSThis indicator automatically plots major 250-pip psychological levels on XAUUSD and highlights the price zones around them. These levels act as strong reaction points where liquidity, reversals, and institutional activity commonly occur.
What the Indicator Does
✔ Plots every 250-pip level starting from a user-defined base (e.g., 4050 → 4075 → 4100 → 4125 → …)
✔ Each level is represented by a thick black horizontal line for maximum visual clarity
✔ Around every 250-pip level, the indicator draws a liquidity zone
Top of zone: +200 pips
Bottom of zone: –200 pips
(configured as ± zoneHalf in settings)
✔ Uses extend: both, so levels stretch across the entire chart and stay fixed, no matter how far you scroll
✔ Zones are filled with a customizable color for clear premium/discount visualization
✔ The indicator never repaints and requires no updates after drawing — all levels are fixed on their price coordinates
Why It’s Useful
🔹 Helps quickly identify institutional levels where gold often reacts
🔹 Acts as a framework for scalping, intraday trading, and swing bias
🔹 Makes it easy to spot liquidity sweeps, rejections, and premium/discount areas
🔹 Clearly shows market structure breaks around key psychological levels
🔹 Forces discipline by creating predefined, fixed levels for trading decisions
Best Use Case
XAUUSD scalpers
Intraday traders who rely on precision entries
Traders who use psychological levels, liquidity grabs, or smart-money concepts
Anyone wanting a clean, non-cluttered chart with high-impact levels only


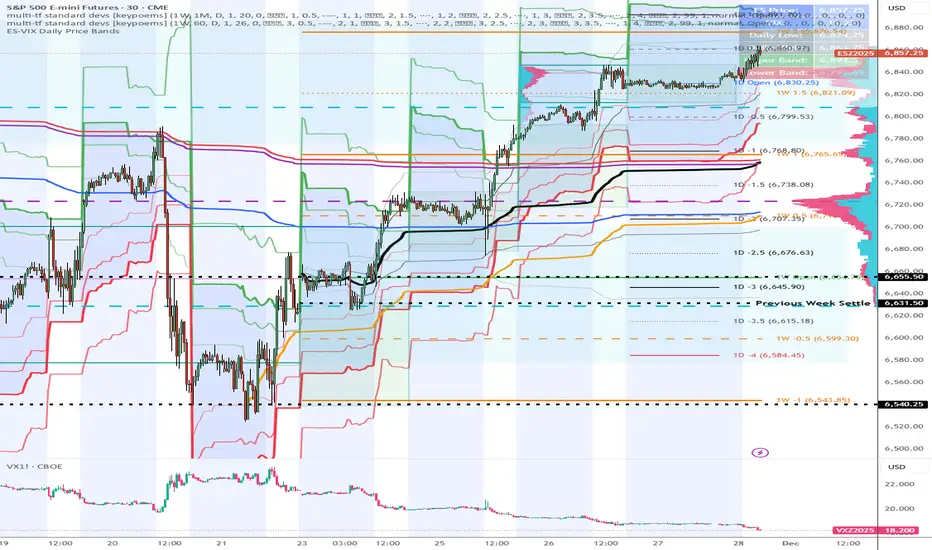
ES-VIX Daily Price Bands - Inner and OuterES-VIX Daily Price Bands
This indicator plots dynamic intraday price bands for ES futures based on real-time volatility levels measured by the VIX (CBOE Volatility Index). The bands evolve throughout the trading day, providing volatility-adjusted price targets.
Formulas:
Upper Band = Daily Low + (ES Price × VIX ÷ √252 ÷ 100)
Lower Band = Daily High - (ES Price × VIX ÷ √252 ÷ 100)
The calculation uses the square root of 252 (trading days per year) to convert annualized VIX volatility into an expected daily move, then scales it as a percentage adjustment from the current day's extremes.
Features:
Real-time band calculation that updates throughout the trading session
Upper band (green) extends from the current day's low
Lower band (red) contracts from the current day's high
Inner upper band (green) at 50% of expected move
Inner lower band (red) at 50% of expected move
Middle Inner upper band (green) at 80% of expected move
Middle Inner lower band (red) at 80% of expected move
Outer upper band (green) at 150% of expected move
Outer lower band (red) at 150% of expected move
Shaded zone between bands for visual clarity
Information table displaying:
Current ES price and VIX level
Running daily high and low
Current upper and lower band values
ADX Breakout Enhanced Signal🥋 Trading Dojo – ADX Breakout Enhanced Signal
This indicator combines the trend-strength power of the ADX with dynamic breakout-based signals, designed for traders who want more frequent and higher-probability entries on timeframes like 1 hour.
The core logic focuses on:
📌 1. Trend Strength Detection with ADX
The indicator evaluates whether the market is showing a strong directional trend using an optimized ADX.
When ADX rises above the configured threshold, the system interprets that price has enough momentum to validate an entry.
📌 2. Breakout Entry Logic
It identifies points where price breaks recent highs or lows, confirming the start or continuation of movement.
This breakout-based approach produces more entries than traditional ADX strategies alone.
📌 3. Clear and Simple Signals
🟩 Long when price breaks a recent high with strong trend confirmation.
🟥 Short when price breaks a recent low with strong trend confirmation.
📌 4. Built-In Automated Alerts
The indicator automatically generates JSON alerts ready for use with automation tools such as trading bots, webhooks, BingX, 3Commas, Discord bots, and more.
🎯 Purpose of the Indicator
To provide more frequent, well-distributed, and momentum-validated entries, while maintaining simplicity and speed — perfect for real-time decision-making.
Perfect For:
Intraday trading
1h, 30m, and 15m timeframes
Breakout-based strategies
Automated trading systems

BullTrading Axis Ribbon (MTF)BullTrading Axis Ribbon (MTF)
BullTrading Axis Ribbon 是一条「高周期主轴 + 自适应包络带」的趋势彩带,用来刻画价格围绕关键均衡轴的磁吸区、扩散区与趋势方向。
• 主轴(Axis Ribbon):使用更高时间级别的价格数据,在当前周期上映射一条「日内趋势中轴」。默认适合在 3m / 5m 图上调用 15m 主轴。
• 中枢区(Core Zone):主轴上下的窄区间,用彩带填充显示。当价格在中枢区震荡时,代表围绕均衡轴的磁吸与盘整。
• 外圈带(Outer Band):位于中枢之外的扩展区,用于观察顺势扩张与「过热」区域,可选线框或填充显示。
• 颜色逻辑:
• 轴线彩带根据趋势方向与中枢状态变色:上升(绿色)、下降(红色)、中枢磁吸(黄色)、整理(灰色)。
• 左下角状态灯同步给出当前轴向状态(上涨 / 下跌 / 中枢 / 整理)。
使用建议
• 在 3m / 5m 作为短周期信号时,用 Axis Ribbon 作为「大级别方向过滤」与「高概率回踩区域」参考。
• 价格长时间贴着外圈带运行,可视为顺势加速或过热区;频繁回到中枢,则倾向震荡与均值回归。
• 指标本身不直接给出买卖点,更适合与你已有的进场离场系统配合,用于方向过滤和环境判断。
本指标仅用于技术研究与图表分析,不构成任何投资建议或交易信号,请根据自身风险承担能力独立决策。
BullTrading Axis Ribbon (MTF)
BullTrading Axis Ribbon is a trend ribbon built from a higher-timeframe core axis + adaptive envelope bands.
It depicts the magnet zone, expansion zone and trend direction of price around a key equilibrium axis.
• Axis (Axis Ribbon): Uses higher-timeframe price data to project an “intraday trend spine” onto the current chart. By default it works well using a 15m axis on 3m / 5m charts.
• Core Zone: A narrow band above and below the axis, displayed as a filled ribbon. When price oscillates inside the Core Zone, it reflects magnet behavior and consolidation around the equilibrium axis.
• Outer Band: An extended area outside the Core Zone, used to observe trend extension and potential “overheated” zones. It can be shown as simple lines or as a filled band.
• Color Logic:
• The axis ribbon color changes with trend direction and core state: uptrend (green), downtrend (red), core/magnet (yellow), ranging/flat (gray).
• A status lamp in the bottom-left corner simultaneously shows the current axis state (Up / Down / Core / Flat).
Usage Suggestions
• When using 3m / 5m as your signal timeframe, treat Axis Ribbon as a higher-timeframe bias filter and as a reference for high-probability pullback areas.
• If price rides along the Outer Band for an extended period, it can be interpreted as trend acceleration or a potential overheated zone; if price frequently returns to the Core Zone, the market tends to be ranging with mean-reversion behavior.
• The indicator itself does not directly generate entry/exit signals. It is best used together with your existing entry/exit systems, as a tool for directional filtering and market-regime assessment.
This indicator is intended solely for technical research and chart analysis.
It does not constitute investment advice or a trading signal. Please make independent decisions according to your own risk tolerance.

XAUUSD 9/1 and 6/4 zone lane chart (BUY zone and SELL zone)XAUUSD 9/1 and 6/4 zone lane chart (BUY zone and SELL zone)

Daily Open Range - TatoshiDisplays a daily open range for both current and previous days. Gives users the flexibility to adjust the number of minutes that the daily open range is determined by. I personally use the first 30 minutes, but adjust at your discretion.
Another GOAT of a indicator. I don't use as much as my monthly open inidcator but for trading lower time frames, this allows the user to easily set their bias for the day and extremely simple to build a strategy around.

Trinity Adaptive Volatility BandsThis is an update on this script. www.tradingview.com and author: www.tradingview.com and full credit to him for his wonderful source code and making it also available here.
What stayed the same (core idea & logic):
Adaptive volatility bands around a central basis
Basis can be SMA / EMA / ALMA / KAMA / VWMA
Volatility source can be ATR / Stdev / Range
Adaptive multiplier that widens bands in strong trends
TTM-style squeeze detection (Bollinger inside Keltner)
Expansion detection
Trend-state tracking (bullish vs bearish coloring)
Long/short signals when price crosses the basis while basis is sloping
Beautiful gradient fill concept
What Changed:
1. Fixed → now both upper and lower zones always glow with the correct trend color (cyan in bull, magenta in bear)
2. Replaced with dynamic proportional steps (always exactly 10 equal layers regardless of band width) → perfect glow every time
3. Used switch … => syntax in some places that caused compile errors in v6. Replaced all with clean if / ternary or proper switch without arrows
4. Long/short trend state used => inside if (syntax error). Fixed to trend := 1 / trend := -1
5. Added fully grouped settings with clear names and tooltips explaining every single option
6. Made every color 100% customizable (bull, bear, neutral, squeeze bg, expansion bg)
7. Added optional blue & pink background tint so you instantly see the squeeze fire without needing another indicator
8. Added visible BUY/SELL triangles with text on chart which can be disabled
Summary of Trinity Adaptive Volatility Bands
This indicator is a highly visual, smart, and fully self-contained volatility band system that combines the best ideas from Bollinger Bands, Keltner Channels, ALMA/KAMA, and the famous TTM Squeeze into one clean, glowing package. It dynamically widens and narrows the bands according to real-time trend strength, paints the entire area between the bands with a beautiful 10-layer gradient (cyan in uptrends, magenta in downtrends), and instantly tells you when the market is extremely quiet (squeeze) or exploding into a big move (expansion).
It is designed for swing traders, day traders, and scalpers who want a single indicator that shows trend direction, volatility state, and high-probability entries without needing ten other tools on the chart.
How to read and use it
The thick middle line (Basis) is an adaptive moving average (default ALMA – very smooth and low-lag).
→ When it is cyan = confirmed uptrend
→ When it is magenta = confirmed downtrend
→ Gray = neutral / ranging
The glowing area around the basis is the adaptive volatility envelope.
The stronger the trend, the wider the bands become automatically (no manual tweaking needed most of the time).
Long signal (green triangle + “BUY”): price closes above the basis while the basis itself is rising → fresh bullish momentum confirmed.
Short signal (red triangle + “SELL”): price closes below the basis while the basis is falling → fresh bearish momentum confirmed.
Blue subtle background = Squeeze is ON
This means volatility has collapsed to extreme lows (Bollinger Bands are inside Keltner Channel).
Statistically one of the highest-probability setups for a big move in either direction. Prepare, do NOT trade the chop inside the squeeze.
Pink/red flash background = Expansion just started
The squeeze has fired, volatility is exploding, and a strong directional move is usually already underway. This is often where the real money is made.
Best ways to trade it
Classic breakout: wait for a squeeze (blue background) → enter on the first strong close outside the bands in the direction of the new trend color.
Trend continuation: after a squeeze fires, simply take every pullback to the basis in the direction of the dominant color (cyan = long only, magenta = short only).
Aggressive scalping: enter immediately on the BUY/SELL triangles with tight stop below/above the opposite band.
Filter with higher timeframe: use the same indicator on 4H/Daily to only take 1H or lower signals that agree with the bigger trend color.
Quick settings tips
Leave everything at defaults → works fantastic on almost any market and timeframe.
Want tighter bands? → lower “Base Multiplier” to 1.5–1.8.
Want even smoother basis? → keep ALMA selected and raise “ALMA Sigma” to 8–10.
Trading very choppy markets? → turn “Enable Adaptive Bands” OFF for fixed-width classic behavior.
Want it to match your chart theme? → change Bullish/Bearish colors in the “Colors” group.
In short: when the chart glows cyan and price is above the basis → be long-biased. When it glows magenta and price is below → be short-biased. Blue background = get ready. Pink flash = the move is on. That’s really all you need to know to trade profitably with this indicator.

PersonsPivots-UpdatedThe script was written by another script writer and it worked fine with Futures, Forex and ETFs but had a Runtime error for stocks so I had a coder friend do a debug

Weekly Open Range - TatoshiDisplays a weekly open range for both current and previous weeks. Gives users the flexibility to adjust the number of hours that the weekly open range is determined by. I personally use the first 3 hours, but play around with it.
A GOAT of a indicator, allows the user to easily set their bias for the week and extremely simple to build a strategy around.

Monthly Open Range - TatoshiDisplays a monthly open range for both current and previous months. Gives users the flexibility to adjust the number of hours that the monthly open range is determined by. I personally use the first 10 hours, but play around with it.
A GOAT of a indicator, allows the user to easily set their bias for the month and extremely simple to build a strategy around.

ES-VIX Daily Price Bands - Inner bands (80% and 50%)ES-VIX Daily Price Bands
This indicator plots dynamic intraday price bands for ES futures based on real-time volatility levels measured by the VIX (CBOE Volatility Index). The bands evolve throughout the trading day, providing volatility-adjusted price targets.
Formulas:
Upper Band = Daily Low + (ES Price × VIX ÷ √252 ÷ 100)
Lower Band = Daily High - (ES Price × VIX ÷ √252 ÷ 100)
The calculation uses the square root of 252 (trading days per year) to convert annualized VIX volatility into an expected daily move, then scales it as a percentage adjustment from the current day's extremes.
Features:
Real-time band calculation that updates throughout the trading session
Upper band (green) extends from the current day's low
Lower band (red) contracts from the current day's high
Inner upper band (green) at 50% of expected move
Inner lower band (red) at 50% of expected move
Middle Inner upper band (green) at 80% of expected move
Middle Inner lower band (red) at 80% of expected move
Shaded zone between bands for visual clarity
Information table displaying:
Current ES price and VIX level
Running daily high and low
Current upper and lower band values

ES-VIX Daily Price Bands - Inner bandsES-VIX Daily Price Bands
This indicator plots dynamic intraday price bands for ES futures based on real-time volatility levels measured by the VIX (CBOE Volatility Index). The bands evolve throughout the trading day, providing volatility-adjusted price targets.
Formulas:
Upper Band = Daily Low + (ES Price × VIX ÷ √252 ÷ 100)
Lower Band = Daily High - (ES Price × VIX ÷ √252 ÷ 100)
The calculation uses the square root of 252 (trading days per year) to convert annualized VIX volatility into an expected daily move, then scales it as a percentage adjustment from the current day's extremes.
Features:
Real-time band calculation that updates throughout the trading session
Upper band (green) extends from the current day's low
Lower band (red) contracts from the current day's high
Inner upper band (green) at 50% of expected move
Inner lower band (red) at 50% of expected move
Shaded zone between bands for visual clarity
Information table displaying:
Current ES price and VIX level
Running daily high and low
Current upper and lower band values
