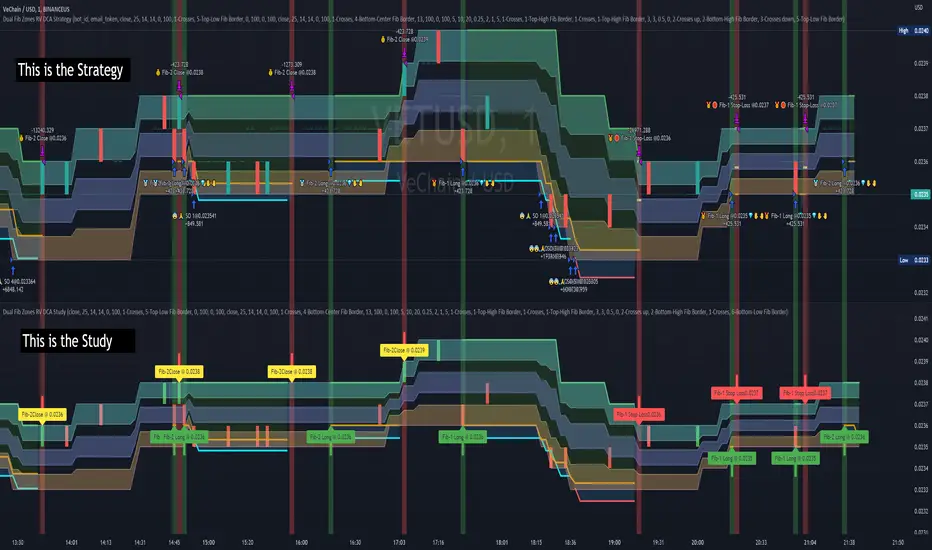
Dual Fibonacci Zones & Ranged Vol DCA Study - R3c0nTraderWhat does this do?
This signal script (aka Study) was created so it could be used with the corresponding strategy "Dual Fibonacci Zone & Ranged Vol DCA Strategy - R3c0nTrader" to create the buy and sell signals for 3Commas bots.
How to Use
Configure the study to match your settings you have set in the strategy. This script comes with an buy and sell alert conditions built-in. Just click to add alert and select Buy or Sell and paste in your bot messages.
Credits:
Thank you "EvoCrypto" for granting me permission to use "Ranged Volume" to create this study
Thank you "eykpunter" for granting me permission to use "Fibonacci Zones" to create this study
Pesquisar nos scripts por "zone"
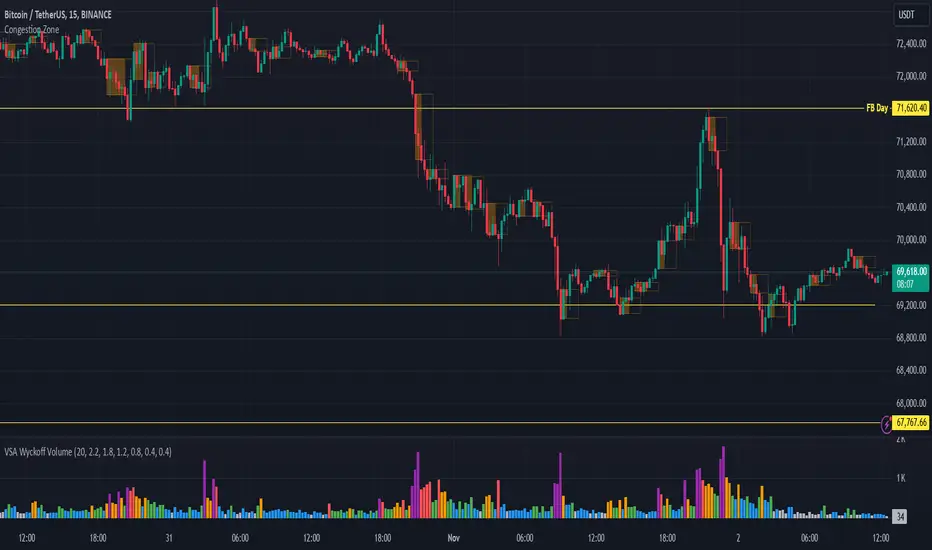
Congestion ZoneCongestion zone include at least 3 candle sticks that the next candle has an opening and closing price within the previous candle
When the price returns to the congested zone there is a possibility of a reversal
The congestion zone is used as a support-resistance area and is used by price action traders.
This script will highlight congestion zones, this will help PA Traders find out them easily.
Multiple MAs + No Trend Zone + ATR WidgetThis is my first Pine Script attempt. Nothing special, just an "all in one" for the most common things I use, and what I have found to be the most common in a lot of strategies.
Great for free and limited accounts as it combines 7 total indicators into one.
-- First 5 indicators are Independant Moving Averages:
-Each one can be set for length, as well as source and type (SMA, EMA, SMMA, WMA, VWMA) individually
-- Second type (6th) of indicator is one I find extremly useful for staying OUT of consolidation trading. It's called a "No Trend Zone" indicator I swipped from the Hoffman Startegy. Basically, its set for a small deviation (0.5) of a 35 EMA, which creates a "Band" around the 35 line. When you have this "Band" flat or with no discernable incline/decline, with price action OR some or multiple moving averages inside this banded zone, it typically indicates a zone of consolidation. This will help you identify when you may be in one of those zones, that way you don't get trapped "waiting for paint to dry" before the market starts to move again with your position, and keep you from entering should you be considering the market at that time.
The last indicator is my favorite, and one I will refine a little deeper soon.
-- The ATR widget finishes us out. This widget can be customized for colors, turned on or off, and automatically rounds the ATR (ATR period based on the chart timeframe) to a nice readable number for what you're trading. It has settings to show or not, the length, what rounding style to use (forex pip 0.0001, forex/stock/etf/indicies 0.01) where to show it on the pane, a Multiplier Factor (for stop loss calculations automatically) and the colors.
***NOTE ABOUT ATR WIDGET:
I am primarily a forex trader, so the defaults are for Forex 0.0001. If you see some odd numbers (like 55798 on a current chart), check the inputs tab on the settings, and change the "ATR Style" from "Forex 0.0001" to "Forex/Stock/ETF/Indicies 0.01", and you should arrive with the correct number.

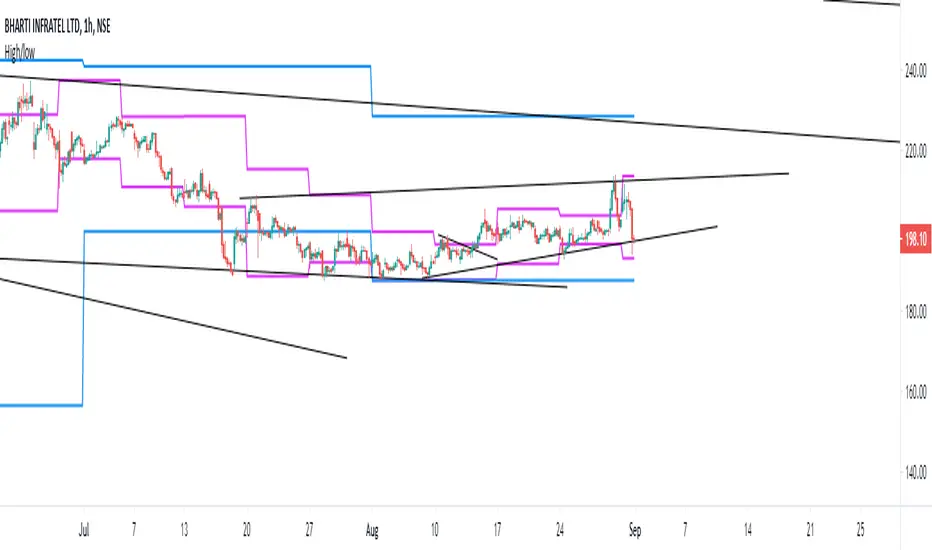
Donchian Channels ModDONCHIAN FIBONACCI MODD VERSION
This indicator is based on a Donchian Channel with Fibonacci zones based on high and lows of certain period . As one can see it clearly identifies the trend and it only turns aqua when its above a spefic fib level and turns red when below specfic fib level , this help traders by not talking long or short position while its in no trade zone when the candle turns gray .This works on ALL TIMEFRAME & ANY SEGMENT
Aqua candle= Super Bullish
Red candle= Super Bearish
Gray Candle= NO TRADE ZONE (can take long or short in retracement coz the stop loss will be minimum )
Long condition = When the candle turns lime one can place the SL at the Low of the band and keep trailing , at time the trend is still long and candle turns gray one can re entry long just at support and place the SL just below the band .
Short condition = When the candle turns red one can place the SL at the High of the band and keep trailing, at time the trend is still short and candle turns gray one can re entry short just at the resistance and place the SL just below the band .
Hope this be helpful for my trading view family !
God Bless !

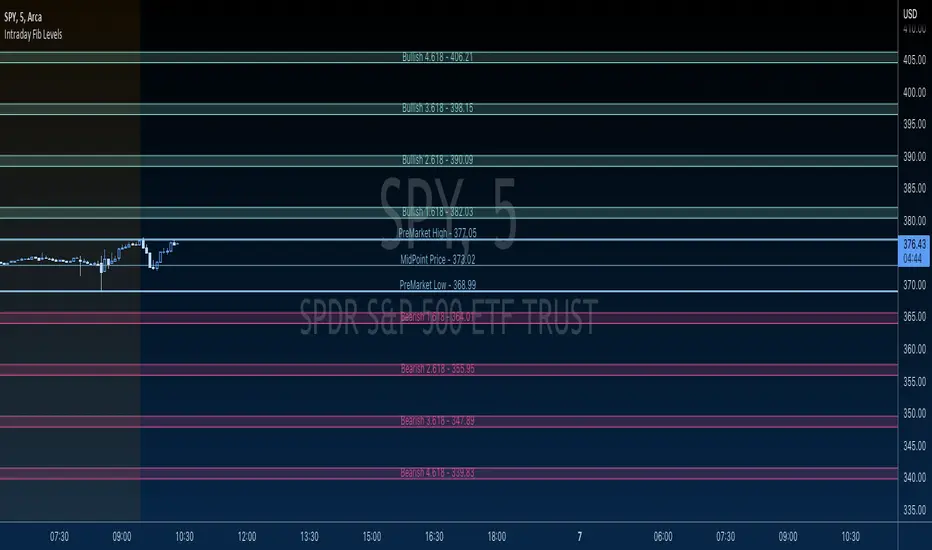
GBTT Premarket Fib ZonesOverview:
This is a daily pre market fib tool. Basically, it looks at your premarket price action and generates a set of fibs. From there, it cross references bearish vs bullish fibs, creates a bear and bull zone to watch for during the day. Finally it draws associated fib levels in each direction are plotted/shaded to represent possible price levels for the day.
The lines will redraw/update every day at open, 930 est and then be there on the chart all day until the following open. These zones are meant to be a reference point for the current trading day only.
Intended use:
To provide educational content about the short term movement of an asset. Can be used on any time frame. But remember, it updates at 930 at open for each day and is only applicable to the current trading day.
Disclaimer:
NOT intended to be a sole source of Technical Analysis or anything more than an educational tool!
Supply, Demand and Equilibrium Zones, Interactive by DGTSupply, Demand and Equilibrium Zones, Interactive
The law of supply and demand is a theory that explains the interaction between the sellers of an asset and the buyers for that asset. The theory defines the relationship between the price of a given asset and the willingness of traders to either buy or sell it. Generally, as price increases, traders are willing to supply more and demand less and vice versa when the price falls.
Simply said, the higher the price, the lower the quantity demanded, and from the seller's perspective, the higher the price, the higher the quantity supplied
Equilibrium zones are the price levels where both selling and buying trading activity is high, both sellers and buyres are interested at that price levels. More correctly, there is a great deal of activity on both the buy and sell side and the market stays at that price level for a great deal of time. Supply and demand are balanced or in equilibrium
Supply and Demand Shifts may occur when institutional investors step in, a change in both price and quantity demanded from one point to another
This experimental study attempts to presend Supply, Demand and Equilibrium Zones by measuring traded volume at all price levels on the market over a specified time period. Then the result is plotted as horizontal zones on the finacial isntrumnet's chart that highlights supply, demand and equilibrium zones at specific price levels
It is important for supply, demand and equilibrium zones to understand that time is always a dimension on charts. The quantity demanded or supplied, found along the horizontal axis, is always measured in traded volume of the asset over a given time interval. Longer or shorter time intervals can influence the levels of supply, demand and equilibrium zones
The study is made interactive, which requires the users to select two points on the chart, by simply clicking on the chart. In case the user would like to view different range then just dragging the vertical lines will be enough
By increasing/decreasing values for supply and demand zones or equilibrium zones, you will either get the zones enlarged or detect supply and demand shifts or other equilibrium zones
It is adviced to use this study in conjuction with a Volume Profile study, such as Volume-Profile-and-Volume-Indicator , Volume-Profile-Custom-Range , Anchored-Volume-Profile , and Price-Action-Support-Resistance , where volume profiles presents trading activities at specific price levels and Supply and Demand Zones can be treated as Value Area (they are not exact same but similar) for Volume Profiles
Disclaimer: Trading success is all about following your trading strategy and the indicators should fit within your trading strategy, and not to be traded upon solely
The script is for informational and educational purposes only. Use of the script does not constitutes professional and/or financial advice. You alone the sole responsibility of evaluating the script output and risks associated with the use of the script. In exchange for using the script, you agree not to hold dgtrd TradingView user liable for any possible claim for damages arising from any decision you make based on use of the script

Combo Ichimoku + CDC Action Zone by fukuizThis indicator combines the famous indicators Ichimoku and CDC ActionZone.
#A brief introduction to Ichimoku #
The Ichimoku Cloud is a collection of technical indicators that show support and resistance levels, as well as momentum and trend direction. It does this by taking multiple averages and plotting them on a chart. It also uses these figures to compute a “cloud” that attempts to forecast where the price may find support or resistance in the future.
#A brief introduction to CDC ActionZone #
CDC ActionZone is a very simple system, utilizing just two exponential moving averages. The 'zones' in which different 'actions' should be taken are highlighted in different colors. Calculations for the zones
They are based on the relative position of price to the two EMA lines and the relationship between the two EMAs.
The CDC ActionZone was developed by Piriya333, a Thai technical analyst.
#How to use #
The basic method for using Ichimoku+CDC ActionZone is to follow the green/red color and the cloud.
Buy condition
-Buy when the bar closes in green and closes above the cloud
Sell condition
-sell when the bar closes in red.

Volume Zone Oscillator (VZO)My interpretation of Walid Khalil's Volume Zone Oscillator (VZO) as published in the 2009 International Federation of Technical Analysis Journal.
This VZO indicator is also the same as Danielle Shay's popular Simpler Trading TurboVZO indicator.
ABOUT:
The oscillator breaks up volume activity into positive and negative categories. It is positive when the current closing price is greater than the prior closing price and negative when it's lower than the prior closing price. The resulting curve plots through relative percentage levels that yield a series of buy and sell signals, depending on level and indicator direction.
HOW TO USE THE INDICATOR:
The default period is 14 but can be adjusted after backtesting.
The VZO points to a positive trend when it rises above and maintains the 5% level, and a negative trend when it falls below the 5% level and fails to turn higher. Oscillations between the 5% and 40% levels mark a bullish trend zone, while oscillations between -40% and 5% mark a bearish trend zone. Meanwhile, readings above 40% signal an overbought condition, while readings above 60% signal an extremely overbought condition. Alternatively, readings below -40% indicate an oversold condition, which becomes extremely oversold below -60%.
Kahlil recommends confirming VZO signals with a 14-period average directional index (ADX), with values greater than 18 pointing to a trending market - search Tradingview's built-in indicators for the Directional Movement Index (DMI).
INTRADAY SCALPING:
Whilst the VZO is already smoothed with an exponential moving average, the indicator settings include an additional 'smoothing' function to remove any excess 'noise' in the plots for intraday use.

CCI Level ZoneThis strategy uses CCI 1000 as zones Buy sell if greater than level 100. will be seen as an uptrend If it's lower, it's a downtrend.
So we will use RSI. To trade in its zones, using the RSI crosses the level line, and when the RSI crosses the level line, it waits to buy with Stochastic.

Market Wizards HMA Warning ZoneThe MW HMA indicator, Provides BUY/SELL signals as well as warning zones. That indicate a potential change in trend

Heat Zone Relative Volatility Index 2.0v2 of Heat Zone RVI
• Updated aesthetics and added various alerts.
• The use of temperature descriptions with these Heat Zone scripts is more so metaphoric of the interpretations from what the RVI attempts to indicate primarily.
--- Due to the additions of the Overheated and Freezing Zones , the indicator-pane scaling is a little different from the original Heat Zone RVI .
Ex.)
--- If you like the scaling the way it was on v1, you can change it back by going into the settings , opening up the style page, and unchecking/turning off the Overheated Top Line as well as the Freezing Bottom Line . Otherwise, you can leave the settings be in regards to this matter.
Ex.)
Disclaimer : I am by no means a highly skilled or professional coder/programmer. I just enjoy dabbling and tinkering every now and again.
HOPE YOU ENJOY

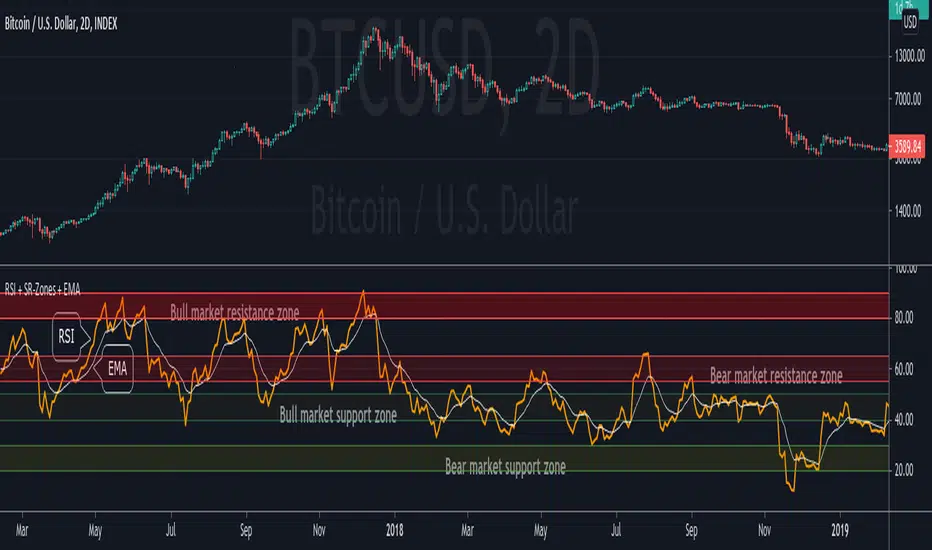
RSI + Support/Resistance Zones + EMAThis indicator enhances the RSI with support and resistance zones and an EMA.
RSI: a regular RSI (default: orange / 14 period)
EMA: an EMA on the RSI (default: light gray / 10 period)
RSI support/resistance zones
SR-Zones for bull markets: In a bull market the price tends to find resistance between 80 and 90 and support between 40 and 50 RSI.
SR-Zones for bear markets: In a bear market the price tends to find resistance between 55 and 65 and support between 20 and 30 RSI.
The concept of these support and resistance zones has been popularized by Constance Brown in her book Technical Analysis for the Trading Professional . The SR zones are described in the first chapter which is available in the preview section on Amazon.
RSI-EMA
The EMA on the RSI can also be used as support and resistance. For example, you can be use it for a simple strategy such as the following: In an uptrend after a significant correction during which the RSI has been below the EMA for some time, wait for the RSI to cross above the EMA to go long and exit (partially) after the RSI crossed down the EMA.
Hint: All visual elements (RSI, EMA, support zones) can be enabled/disabled and adjusted individually.
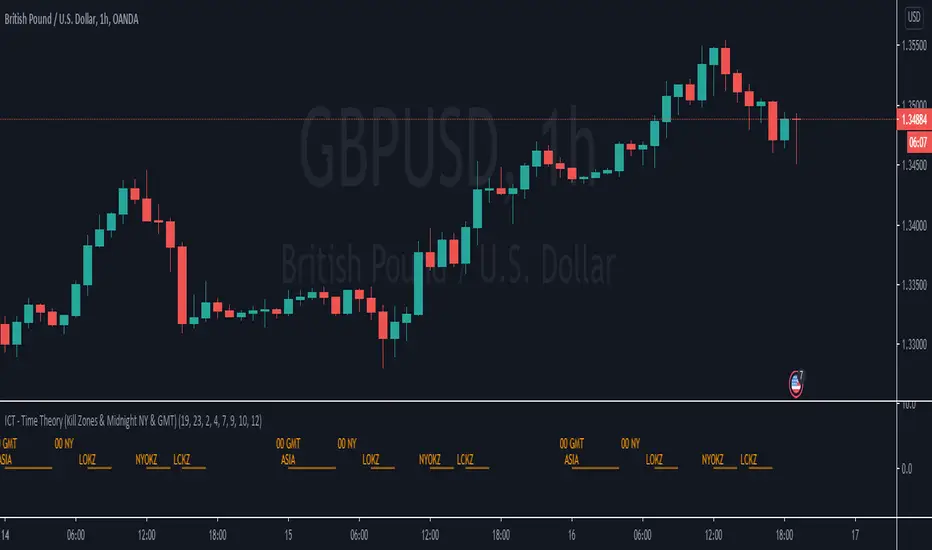
ICT - Time Theory (Kill Zones & Midnight NY & GMT)This script helps you to mark the following automatically instead of doing it every day:
Midnight GMT;
Midnight NY;
Asia Session;
London Open Kill Zone;
New York Open Kill Zone;
London Close Kill Zone;
This helps if you trade intra-day with this ICT concepts.
It draws a horizontal lines instead of painting the background. (There is a limitation of around 50 vertical lines per script)
Fibo Price ZoneThis indicator is used to automatically plot the Fibonacci Prize Zone.
The default settings of this indicator:
Number of candles = 30
Direction = from Low to High
The number of candles is the number of the previous candles, and the direction is the retracement from either high-to-low or low-to-high of the Fibonacci Price Zone.
The indicator will plot several bars, in which there are three bold bars that represent "weak", "normal" and "strong" price zone.

GMS: Mr. Yen's Color ZoneThis is Mr. Yen's color zone. I have also added an input to adjust the sizes of each box. Mainly targeted for MES and ES.
The default settings are as he describes:
white line is the previous day close
red zone = +/- 20 from the previous day close
yellow zone = +/- 40 from the previous day close
green zone = +/- 60 from the previous day close
blue zone = +/- 100 from the previous day close
The source code is open, so feel free to take a look and see whats up. This indicator is quite similar to his, however there is a gap at the cash close to overnight open on his chart that I'm not sure how to adjust for. In any case, this one is still pretty good!
I hope it helps,
Andre

Supply and Demand ZonesThis indicators should be used along with price action breakout
Red zones - Red zones are formed daily
10 days average ranges
Blue zones - Blue zones are formed every week
10 weeks average ranges
Green zones - Green zones are formed every month
10 months averange ranges
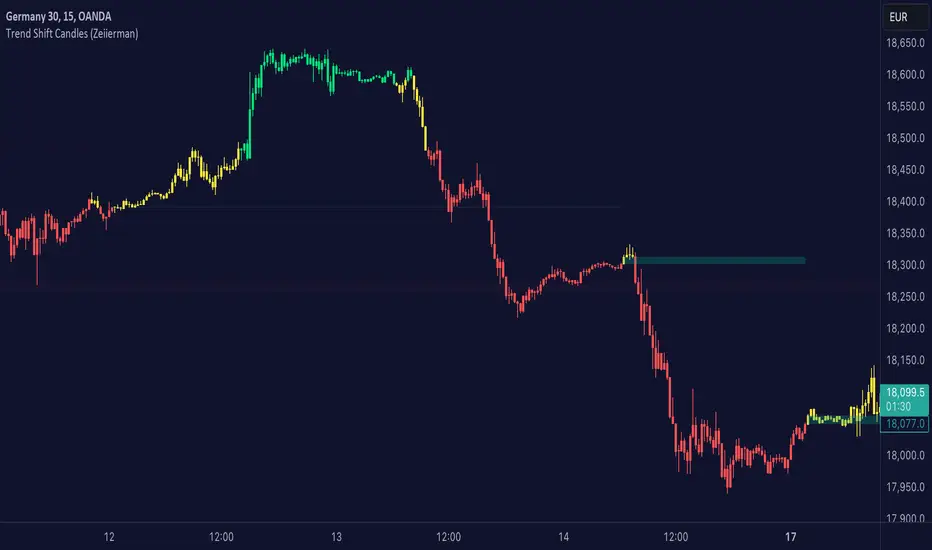
Trend shift Candles (Expo)Trend shift Candles (Expo) identifies where the market characteristics change. Trend shifts often occur in these areas. This is visualized with white candlesticks and Zones.
-> When the market enters a positive trend the candlesticks become green and when the market enters a negative trend the candlesticks become red.
-> The user can choose which timeframe to use. Vwap can be enabled as an input source instead of using price.
-> Please play around with the settings, I haven't set them to any specific values.
HOW TO USE
1. Use the indicator to identify the direction of the trend.
2. Use the indicator to identify trend changes.
-> Visual Order should be set to "Bring to Front" in order to see the color of the candles.
INDICATOR IN ACTION
4 hour chart
The indicator work on Heikin Ashi, Candles, Bars, Renko, Line Break, Kagi, and Point & Figure chart.
I hope you find this indicator useful , and please comment or contact me if you like the script or have any questions/suggestions for future improvements. Thanks!
I will continually work on this indicator, so please share your experience and feedback as it will enable me to make even better improvements. Thanks to everyone that has already contacted me regarding my scripts. Your feedback is valuable for future developments!
ACCESS THE INDICATOR
• Contact me on TradingView or use the links below
-----------------
Disclaimer
Copyright by Zeiierman.
The information contained in my scripts/indicators/ideas does not constitute financial advice or a solicitation to buy or sell any securities of any type. I will not accept liability for any loss or damage, including without limitation any loss of profit, which may arise directly or indirectly from the use of or reliance on such information.
All investments involve risk, and the past performance of a security, industry, sector, market, financial product, trading strategy, or individual’s trading does not guarantee future results or returns. Investors are fully responsible for any investment decisions they make. Such decisions should be based solely on an evaluation of their financial circumstances, investment objectives, risk tolerance, and liquidity needs.
My scripts/indicators/ideas are only for educational purposes
Brick ZoneBrick Zone
Bullish patterns can be traded when the brick count indicator is in a bullish zone while bearish patterns can be traded when it is in a bearish zone. Brick Zone indicator specially designed for renko chart. The brick zone indicator oscillates around the zero line and can also become negative. It will show a positive value when the number of bullish bricks is greater than zero and will turn up a negative value when the number lesser than zero.
Brick Zone = Number of Bullish Bricks – Number of Bearish Bricks
Above zero – Market Bullish
Below Zero – Market Bearish
This indicator inventor name is “Prashant Shah” and this indicator introduced in “Profitable Trading With Renko Chart” Book.

NSDT Triple KeltnerA different spin on Keltner Channels. Using 3 channels of varying widths provides a good visual for potential entries off of extremes. Normal channel is center, green and red "zones" could be used as potential entry/exit areas, and the outside yellow zones may be viewed as extremes (signifying potential breakouts or strong reversal areas).

Ceph-RSI: Zone ControlCeph-RSI: Zone Control is a script that is dedicated to showing a important zones across the Relative Strength Index that could possibly lead to better entries or greater expectations of price movement when using proper scaling.
If you want to gain access to RSI: Zone Control, please message me using the discord contact below or PM me on TradingView for how to obtain access. Thank you.

Demand Supply Zone IndicatorThe Demand Supply Zone indicator helps in identifying the Demand Supply zones on chart by pinpointing them. The indicator looks for patterns of Drop-Base-Rally and Rally-Base-Rally and when such pattern is available the indicator marks it as DZ ( Demand Zone ). Likewise, if the indicator finds a pattern of Rally-Base-Drop or Drop-Base-Drop the indicator marks it as SZ ( Supply Zone ). The basing candles are changed to Blue color and the Legout candle is changed to Black color.
The setting for legout strength can be customized as follows
1 – Good Legout Strength
1.5 – Strong Legout Strength
2 - Very Strong Legout Strength
The setting for number of candles in the basing can be customized from 1 to 6.
Use the link below to obtain access to this indicator.

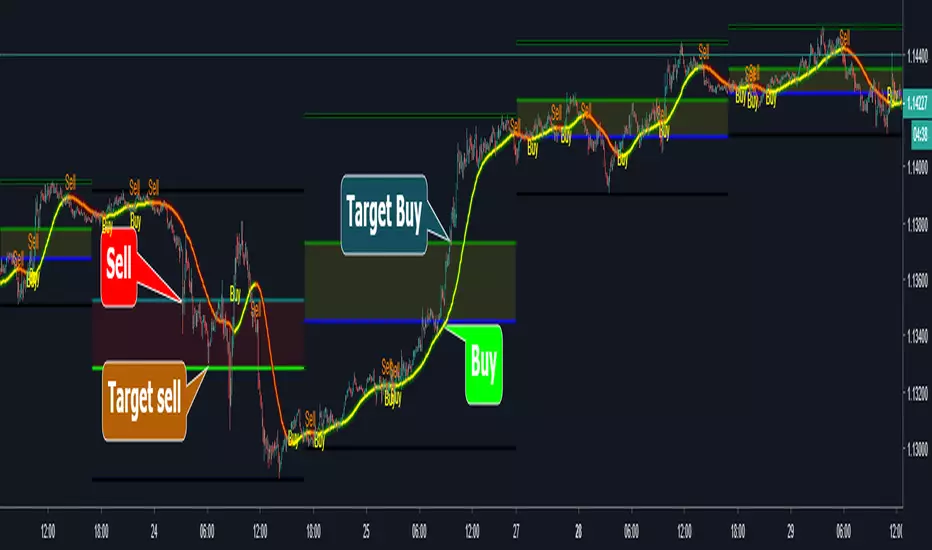
PpSignal Fibonacci Golden Zonefibonacci golden zone is a popular forex system for buy or sell fibo areas.
Buy in 38 fibo zone and sell in 61 fibo zone. when the fiboncci trend is up, the fill color between 28 and 61 is yellow, when the trend is down the fibonacci color is red.
a recommended use some move average with some oscillator for a find the trend.
Move average recommended serhttps://www.tradingview.com/script/guQUYY7J-PpSignal-Trend-Follow/
Oscillator see
RSI Divergence Smoothed with Signal Line and Power ZonesThis Indicator plots Regular and Hidden Divergences lines for an RSI smoothed by an EMA and for its Signal Line
The RSI can be set to change colour with direction or can be set as single colour
Colour Changing RSI helps when trading Multiple Timeframes as you can look for confluence in the direction of RSI
The divergence script is thanks to @RicardoSantos, I've just adjusted it to suite my indicator
Remember that divergences work best when traded with the trend or very late in a trend when going against the trend
I have also added a Colour Changing Signal Line & Hima Reddy's Power Zones so now you can also
Take full advantage of trading; signal line crosses, 50 crosses and Power Zone RSI support and resistance
