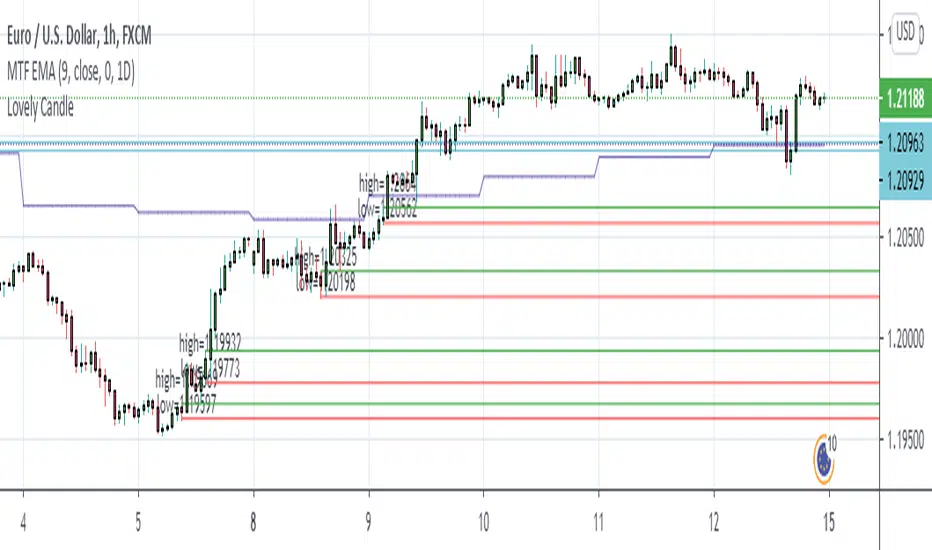
Lovely CandleThis is my Simple Project to make me confidence to take an entry
I always use it in H1 Chart
Add other Indicator like Multi Timeframe EMA Length 9 on 1 Day Period
Just set the sell limit or buy limit to the Lovely candle Zone that touch the EMA 9. Set RR to 1:3 minimum. don't forget to set BEP.
Pesquisar nos scripts por "zone"
Japanese Candle Patterns Detector in Potential price zoneThis script would find the 8 famous "Japanese Candle Stick Patterns" in your chart.
Please be aware it find patterns in "Potential price zones" only, which help you to avoid none-important patterns during a price trend.
I used RSI and ATR in my codes to find best candle forms and price conditions.
Bellow patterns are detecting:
Hammer | ShootingStar | Engulfing Candle | Doji | Tweezers Top/Buttom | Three White Soldiers/Three Black Crows | Marubozu | Harami
* You can select your preferred patterns from indicator setting.
* Pattern names are abbreviated for better view on chart.
I hope it helps you to improve your trading.

Betelgeuse-Good entry/exit zoneHello everyone and welcome!
This is the my first indicator and also the first version of Betelgeuse script,I hope you will like it.
The indicator was designed to be used on cryptocurrencies
The idea is to be able to identify good entry and exit points in the market, traders often try to identify the minimum or maximum points and this is why Betelgeuse was born.
Betelgeuse should be combined with your analysis and other indicators to find good entry and exit zones and not a precise point.Obviously the more the indicator will be used
over long time frames the more accurate the signals will be.
You can decide to wait for a good signal from the RSI or from the MACD and add up
the Betelegeuse confirmation for a good entry or exit from the market.
The MA based indicator will give you an idea of the direction of the medium term trend.
Direct message me for acces.

Humble Bars Possible Correction ZonesPossible correction zones are calculated based on Humble Bars. Please check Humble Bars and Humble Bars Convergence Divergence indicators for more info.
Note that, these are meant to be correction zones, not turning points. If you take those as entry signals, you should remember, you are probably going against the trend.
Humble Bars
Humble Bars Convergence Divergence

[MACLEN] HODL ZONE RENKO
PLEASE READ!
Trade at your own risk. Please read about renko charts before using this indicator. This indicator is for educational purposes only.
This Indicator is only valid in renko charts with 1 second timeframe. For BTCUSDT . With the traditional method and the size box of 80.
With this indicator we can detect zones of buy and sell. Even that is not recommended to use leverage, I use it to find an entry and use only small leverages. It could be also used to accumulate and HODL bitcoin .
Please, comment anything.
POR FAVOR LEER!
Tradea bajo tu propio riesgo. Por favor lee sobre las graficas renko antes de usar este indicador. Este indicador es solamente con fines educativos.
Este indicador es válido solamente en graficas renko con un timeframe de 1 segundo. Para BTCUSDT . Con cajas del método tradicional de un tamaño de 80.
Con este indicador podemos detectar zonas de compra y venta. A pesar de que no es recomendable usar apalancamiento, yo lo uso para encontrar entradas y solo uso apalancamientos pequeños. También podría usarse para acumular y holdear bitcoin .
Por favor, escríbeme cualquier duda o comentario.

Demo Price Action in RSI Overbought/Oversold zoneCatch Pinbar/Fakey in RSI Overbought/Oversold zone.

NixTrading Margin ZonesCreated by Super55
This one is the most accurate and precise margin zones indicator available. It is fine-tuned for bitcoin trading, but can also be used for all popular assets (XAUUSD , EURUSD , Oil etc.) that have futures traded on Chicago Mercantile Exchange (CME). Margin requirements data for each market is taken from the CME, then a key price for each specific time period is determined. The result is a set of reliable support and resistance zones that are best used for intraday trading. The data should be checked and updated daily.
This is a private, "invite only" indicator. I don't sell nor promote it.
__
For Russian-speaking followers: Предыдущая версия была заблокирована из-за большого количества русских слов. Буду краток: это лучший индикатор маржинальных зон на сегодня. Коэффициенты зон, которые мы используем на биткойне, имеют множитель x2 по сравнению со стандартным процентным обозначением (+50 = +25%). Доступ только для членов нашего сообщества.

Demand/Supply ZonesThis script will draw the supply and demand zone so you can always enter the best places. Cheap stop-loss and BIG Take Profits.
I will leave the scripts available during the weekend and if you want it, send me a message.
Leo Hermoso
Kill Zone Box ASIA LONDRES NYCBox of good time zones to make trade in each session of the market, I can set the time, colors. Mark the high and low of the day and leave the mark to review the day after.

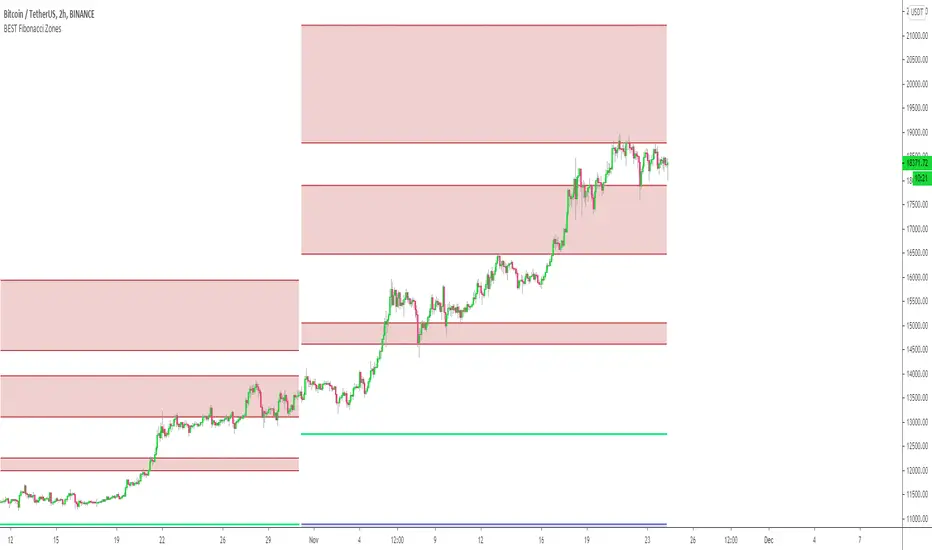
Automatic Multi-timeframes fibonacci zonesHello traders
This is a fancy indicators that will draw for you the fibonacci zones on either daily/weely/monthly timeframes
I use those zones to define my take profit levels for my intraday trading
Hope it will help
Love you all
David
Volume Supply and Demand ZonesDraws supply and demand zones of 3 types, based on 3 different volume threshold parameters.
The timeframe of the script is fixed (you can change it in the options), so for example it is possible to keep Daily S/D zones while looking at 1h chart.

Demand and Supply Zones indicatorThis Script automatically marks Demand and Supply Zone on the chart

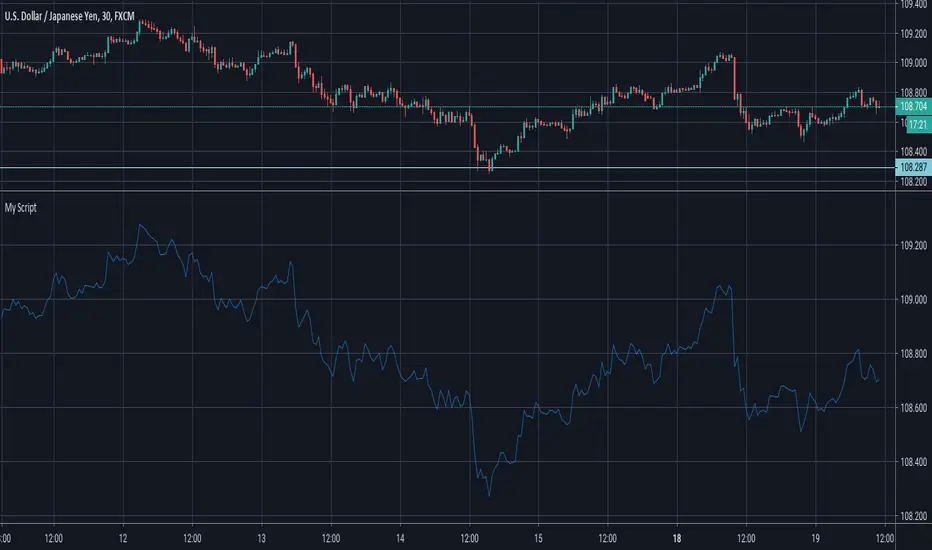
SMART4TRADER-ATR Standard DeviationThis indicator is designed to set targets for market reversal. The indicator was developed by me by the author of marginal zones for the foreign exchange market. This indicator is an improved version of margin zones without the need to download data from CME
Это индикатор предназначен для определения целей для разворота рынка. Индикатор разработан мною автором маржинальных зон для валютного рынка. Данный индикатор является улучшенной версией маржинальных зон без потребности загрузки данных с CME

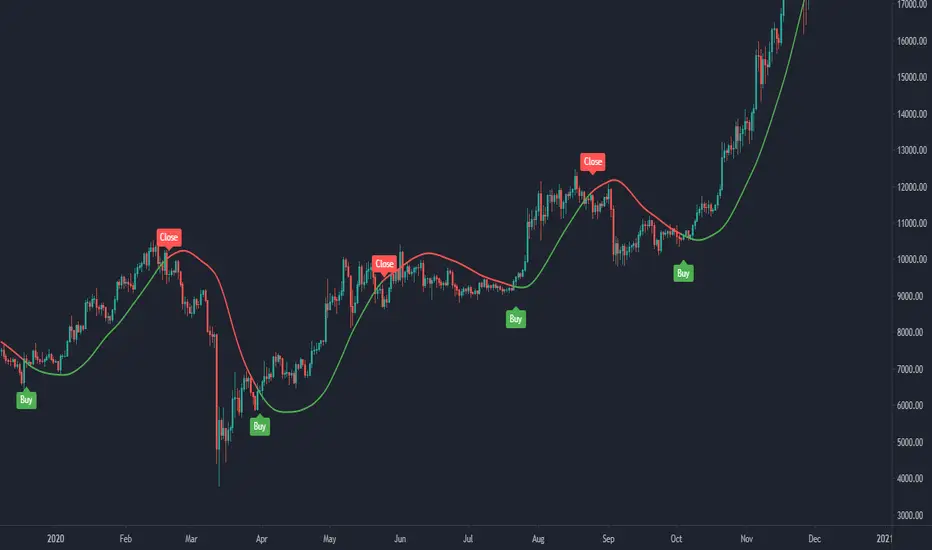
Hull MA & Warning Zones & Buy/Sell ArrowsThis moving average, in contrast to the standard, shows a slowdown of the current trend - it draws additional zones of yellow color. These zones show a possible trend reversal by 1-2 bars earlier than the standard Hull moving average. Additionally, there are arrows to enter a position and the second is the same MA for another timeframe, which can be selected in the settings.

Donochian zonesThis indicator give the ratio between the high and low of donochian channel and if we take ratio and add it to each other then we can calculate if it + meaning bullish trend or negative meaning bearish trend
using non repainting MTF we can see the zone of the channel at different time set
we can use this indicator to filter bad signal or make it stand alone
here example of amazon stock with 360 min mtf over one hour graph
here facebook 240min over 15 min graph

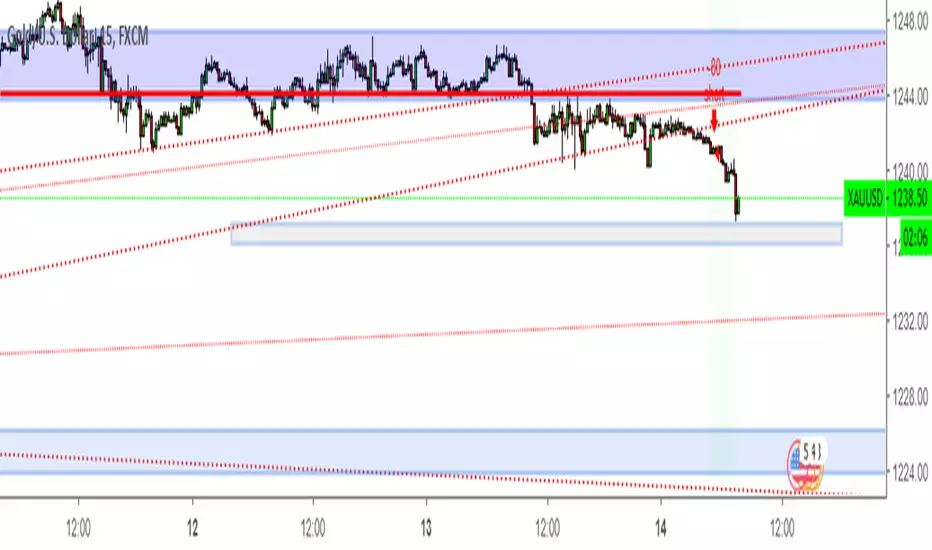
BuySell Gold Test Script by Breakout and SR zone I test this for test overall report and set fix price after 14 dec 2018 that i set from manual trade in zone.
will improve to better automate again after this.
Disaresta Buyer/Seller ZoneThis indicator was built to show buyer and seller's zone. Use this indicator to compliment your already existing trading system by confirming whether its buyer or seller that have dominance in current price movements.

RSI Bands Multi Time Frame [Jigga + LazyBear]This is a modified version of LazyBear's RSI Bands script. I added the possibility to display multiple RSI bands, so you can see the zones, where it is viable to enter a long or a short. You can also use different time frames, so you can visually see where any specific value of RSI is for your given time frame. This gives you a lot of possibilities. Default settings use 1h time frame and the most common reversal areas for RSI. Feel free to change the settings as you see fit. If the script makes your candles too small, you can go to style and turn off individual RSI bands. After that you will still be able to see the zones, but the scale of your chart won't be affected.
It also displays the middle line, which shows you the current trend and can prevent you from entering a long, when RSI is oversold during a strong downtrend or a short, when RSI is overbought during a strong uptrend.
Do not forget to use a proper stop loss and risk management.
Here you can see it in action in different markets:
BTC - BitMex
NASDAQ Composite - Stocks
EUR / USD - Forex


Better CME Margin Zones 25-200%Better indicator for CME Margin Zones
25%,50%,100%,200% zones included)

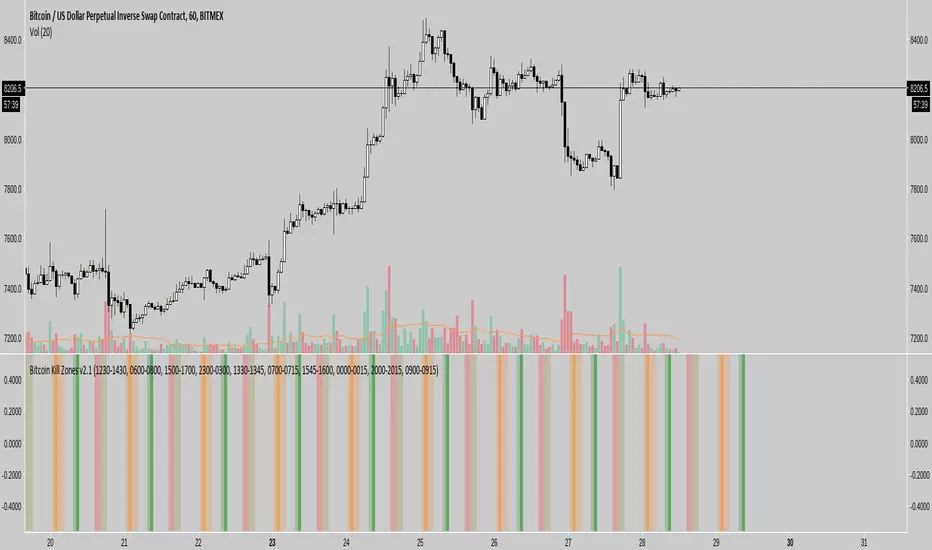
Bitcoin Kill Zones v2 [oscarvs] (UTC + 8)The Kill Zone script was modified to UTC + 8, Singapore to Beijing time.
