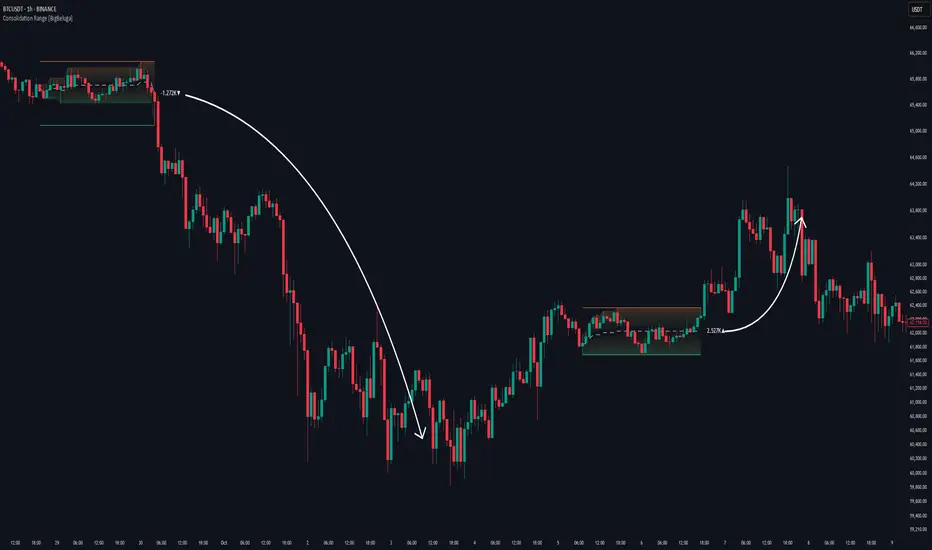
Consolidation Range [BigBeluga]A hybrid volatility-volume indicator that isolates periods of price equilibrium and reveals the directional force behind each range buildup.
Consolidation Range is a powerful tool designed to detect compression phases in the market using volatility thresholds while visualizing volume imbalance within those phases. By combining low-volatility detection with directional volume delta, it highlights where accumulation or distribution is occurring—giving traders the confidence to act when breakouts follow. This indicator is particularly valuable in choppy or sideways markets where range identification and sentiment context are key.
🔵 CONCEPTS
Volatility Compression: Uses ADX (Average Directional Index) to detect periods of low trend strength—specifically when ADX drops below a configurable threshold.
Range Structure: Upon a low-volatility trigger, the script dynamically anchors horizontal upper and lower bounds based on local highs and lows.
Directional Volume Delta: Inside each active range, it calculates the net difference between buy and sell volume, showing who controlled the range.
Sentiment Bias: A label appears in the center of the zone on breakout, showing the accumulated delta and bias direction (▲ for positive, ▼ for negative).
Range Validity Filter: Only ranges with more than 15 bars are considered valid—short-lived consolidations are auto-filtered.
🔵 KEY FEATURES
Detects low volatility market phases using ADX logic (crosses under "Volatility Threshold Input").
Automatically plots adaptive consolidation zones with upper and lower boundary lines.
Includes dynamic midline to visualize the price average inside the range.
Visual range is filled with a progressive gradient to reflect distance between highs and lows.
When the range is active, the indicator accumulates volume delta (Buy - Sell volume) .
Upon breakout, the total volume delta is displayed at the midpoint , providing insight into market sentiment during the consolidation phase.
Filters out weak or short-lived consolidations under 15 bars.
🔵 HOW TO USE
Spot ranging or compression zones with minimal effort.
Use breakouts with volume delta bias to assess the strength or weakness of moves.
Combine with trend-following tools or volume-based confirmation for stronger setups.
Apply to higher timeframes for macro consolidation tracking .
🔵 CONCLUSION
Consolidation Range now brings together volatility filtering and directional volume delta into one smart module. This hybrid logic allows traders to not only identify balance zones but also understand who was in control during the buildup—offering a sharper edge for breakout and trend continuation strategies.
Indicadores e estratégias
Weighted Regression Bands (Zeiierman)█ Overview
Weighted Regression Bands is a precision-engineered trend and volatility tool designed to adapt to the real market structure instead of reacting to price noise.
This indicator analyzes Weighted High/Low medians and applies user-selectable smoothing methods — including Kalman Filtering, ALMA, and custom Linear Regression — to generate a Fair Value line. Around this, it constructs dynamic standard deviation bands that adapt in real-time to market volatility.
The result is a visually clean and structurally intelligent trend framework suitable for breakout traders, mean reversion strategies, and trend-driven analysis.
█ How It Works
⚪ Structural High/Low Analysis
At the heart of this indicator is a custom high/low weighting system. Instead of using just the raw high or low values, it calculates a midline = (high + low) / 2, then applies one of three weighting methods to determine which price zones matter most.
Users can select the method using the “Weighted HL Method” setting:
Simple
Selects the single most dominant median (highest or lowest) in the lookback window. Ideal for fast, reactive signals.
Advanced
Ranks each bar based on a composite score: median × range × recency. This method highlights structurally meaningful bars that had both volatility and recency. A built-in Kalman filter is applied for extra stability.
Smooth
Blends multiple bars into a single weighted average using smoothed decay and range. This provides the softest and most stable structural response.
⚪ Smoothing Methods (ALMA / Linear Regression)
ALMA provides responsive, low-lag smoothing for fast trend reading.
Linear Regression projects the Fair Value forward, ideal for trend modeling.
⚪ Kalman Smoothing Filter
Before trend calculations, the indicator applies an optional Kalman-style smoothing filter. This helps:
Reduce choppy false shifts in trend,
Retain signal clarity during volatile periods,
Provide stability for long-term setups.
⚪ Deviation Bands (Dynamic Volatility Envelopes)
The indicator builds ±1, ±2, and ±3 standard deviation bands around the fair value line:
Calculated from the standard deviation of price,
Bands expand and contract based on recent volatility,
Visualizes potential overbought/oversold or trending conditions.
█ How to Use
⚪ Trend Trading & Filtering
Use the Fair Value line to identify the dominant direction.
Only trade in the direction of the slope for higher probability setups.
⚪ Volatility-Based Entries
Watch for price reaching outer bands (+2σ, +3σ) for possible exhaustion.
Mean reversion entries become higher quality when far from Fair Value.
█ Settings
Length – Lookback for Weighted HL and trend smoothing
Deviation Multiplier – Controls how wide the bands are from the fair value line
Method – Choose between ALMA or Linear Regression smoothing
Smoothing – Strength of Kalman Filter (1 = none, <1 = stronger smoothing)
-----------------
Disclaimer
The content provided in my scripts, indicators, ideas, algorithms, and systems is for educational and informational purposes only. It does not constitute financial advice, investment recommendations, or a solicitation to buy or sell any financial instruments. I will not accept liability for any loss or damage, including without limitation any loss of profit, which may arise directly or indirectly from the use of or reliance on such information.
All investments involve risk, and the past performance of a security, industry, sector, market, financial product, trading strategy, backtest, or individual's trading does not guarantee future results or returns. Investors are fully responsible for any investment decisions they make. Such decisions should be based solely on an evaluation of their financial circumstances, investment objectives, risk tolerance, and liquidity needs.

Multi-Timeframe Sweep and AlertThis indicator is designed to be used with the Fractal Model in that it will visually alert you when there has been a sweep on the 15m, 30m, 1h, and 4H time frames. You can also have it send you alerts as well

Chris Order Flow Progives order flow on the 1min 5min and the 1h. it identifies the trend for you so you dont need to waste time analysing the charts. and improve your trading. by: @chr_futures on tiktok

Quant Trading Zero Lag Trend Signals (MTF) Strategy🧠 Strategy Overview
The Quant Trading Zero Lag Trend Signals (MTF) Strategy is a high-precision, multi-timeframe trend-following system designed for traders seeking early trend entries and intelligent exits. Built around ZLEMA-based signal detection, it includes dynamic risk management features and is optimized for automation via the Quant Trading Strategy Optimizer Chrome extension. Based on the original Zero Lag Trend Signals (MTF) from AlgoAlpha.
Based on popular request, I am including more documentation related to the strategy.
🔍 Key Components
1️⃣ ZLEMA Trend Engine
ZLEMA (Zero-Lag EMA) forms the foundation of the trend signal system.
Detects bullish and bearish momentum by analyzing price action crossing custom ZLEMA bands.
Optional confirmation using 5-bar ZLEMA slope filters (up/down trends) ensures high-conviction entries.
2️⃣ Volatility-Based Signal Bands
Dynamic bands are calculated using ATR (volatility) stretched over 3× period length.
These bands define entry zones (outside the bands) and trend strength.
Price crossing above/below the bands triggers trend change detection.
3️⃣ Entry Logic
Primary long entries occur when price crosses above the upper ZLEMA band.
Short entries (optional) trigger on downside cross under the lower band.
Re-entry logic allows continuation trades during strong trends.
Filters include date range, ZLEMA confirmation, and previous position state.
4️⃣ Exit Logic & Risk Management
Supports multiple customizable exit mechanisms:
🔺 Stop-Loss & Take-Profit
ATR-Based SL/TP: Uses ATR multipliers to dynamically set levels based on volatility.
Fixed Risk-Reward TP: Targets profit based on predefined RR ratios.
Break-Even Logic: Automatically moves SL to entry once a threshold RR is hit.
EMA Exit: Optional trailing exit based on price vs. short EMA.
🔀 Trailing Stop
Follows price action using a trailing ATR-based buffer that tightens with trend movement.
🔁 Trend-Based Exit
Automatically closes positions when the detected trend reverses.
5️⃣ Multi-Option Trade Filtering
Enable/disable short trades, ZLEMA confirmations, re-entries, etc.
Time-based backtesting filters for isolating performance within custom periods.
6️⃣ Visual Feedback & Annotations
Trend shading overlays: Green for bullish, red for bearish zones.
Up/Down triangle markers show when ZLEMA is rising/falling for 5 bars.
Stop-loss, TP, trailing lines drawn dynamically on the chart.
Floating stats table displays live performance (PnL, win %, GOA, drawdown, etc.).
Trade log labels annotate closed trades with entry/exit, duration, and reason.
7️⃣ CSV Export Integration
Seamless export of trade data including:
Entry/exit prices
Bars held
Encoded exit reasons
Enables post-processing or integration with external optimizers.
⚙️ Configurable Parameters
All key elements are customizable:
Entry band length and multiplier
ATR lengths, multipliers, TP/SL, trailing stop, break-even
Profit target RR ratio
Toggle switches for confirmations, trade types, and exit methods
🚀 Optimizer-Ready
This strategy was built for advanced backtesting automation:
100% compatible with the Quant Trading Strategy Optimizer Chrome Extension
Supports parameter sweeps, multi-symbol, and multi-timeframe optimization

LANZ Strategy 2.0 [Backtest]🔷 LANZ Strategy 2.0 — Structural Breakout Logic with Dynamic Swing Protection
LANZ Strategy 2.0 is a precision-focused backtesting system built for intraday traders who rely on structural confirmations before the London session to guide directional bias. This tool uses smart swing detection, risk-defined position sizing, and strict time-based execution to simulate real trading conditions with clarity and control.
🧠 Core Components:
Structural Confirmation (Trend & BoS): Detects trend direction and break of structure (BoS) using a three-swing logic, aligning trade entries with valid structural movement.
Time-Based Execution: Trades are triggered exclusively at 02:00 a.m. New York time, ensuring disciplined and repeatable intraday testing.
Swing-Based SL Models: Traders can select between three stop-loss protection types:
First Swing: Most recent structural level
Second Swing: Prior level
Full Coverage: All recent swing levels + configurable pip buffer
Dynamic TP Calculation: Take-Profit is projected as a risk-based multiple (RR), fully adjustable via input.
Capital-Based Risk Management: Risk is defined as a percentage of a fixed account size (e.g., $100 per trade from $10,000), and lot size is automatically calculated based on SL distance.
Fallback Entry Logic: If structural breakout is present but trend is not confirmed, a secondary entry is triggered.
End-of-Session Management: Any open trades are automatically closed at 11:45 a.m. NY time, with optional manual labeling or review.
📊 Visual Features (Optional in Indicator Version):
(Note: Visuals apply to the indicator version of LANZ 2.0, not this backtest script)
Swing level labels (1st, 2nd) and dynamic SL/TP lines.
Real-time session coloring for clarity: Pre-London, Entry Window, and NY Close.
Outcome labels: +RR, -RR, or net % at close.
Auto-cleanup of previous drawings for a clean chart per session.
⚙️ How It Works:
Detects last trend and BoS using swing logic before 02:00 a.m. NY.
At 02:00 a.m., evaluates directional bias and executes BUY or SELL if confirmed.
Applies selected SL logic (1st, 2nd, or full swing protection).
Sets TP based on the RR multiplier.
Closes the trade either on SL, TP, or at 11:45 a.m. NY manually.
🔔 Alerts:
Time-of-day alert at 02:00 a.m. NY to monitor execution.
Can be extended to cover SL/TP triggers or new BoS events.
📝 Notes:
Designed for backtesting precision and discretionary decision-making.
Ideal for Forex pairs, indices, or assets active during the London session.
Fully customizable: session timing, swing logic, SL buffer, and RR.
👤 Credits:
Strategy built by @rau_u_lanz using Pine Script v6, combining structural logic, capital-based risk control, and London-session timing in a backtest-ready framework for traders who demand accuracy and structure.

Supply and Demand Zones🔍 Supply and Demand Zones
by The_Forex_Steward
This indicator automatically identifies Supply and Demand Zones based on aggregated synthetic candles, helping traders pinpoint potential reversal or breakout levels with clarity and precision.
🧠 How It Works:
This tool aggregates price data over a set number of candles (defined by the Aggregation Factor ) to create "synthetic candles" that smooth out noise and highlight significant institutional price activity. These candles are then analyzed to detect bullish or bearish order blocks , which are visualized as zones:
-Demand Zones (Green) : Formed when price breaks above the high of a previous bearish synthetic candle.
-Supply Zones (Red) : Formed when price breaks below the low of a previous bullish synthetic candle.
These areas often represent key institutional interest where price is likely to react.
⚙️ Key Features:
-Aggregation Factor : Groups candles to form larger, synthetic ones. Higher values smooth price and reduce noise.
-Custom Zone Length : Define how far zones extend forward (up to 500 bars).
-Mitigation Logic : Choose whether to auto-delete zones once price breaks through them.
-Visual Customization : Customize zone colors and borders to suit your charting style.
-Alerts : Get notified when new Supply or Demand zones are formed.
📈 How to Use It:
1. Trend Trading : Use zones as dynamic support/resistance to enter with trend pullbacks.
2. Reversals : Look for price reactions at untested zones for potential counter-trend setups.
3. Breakouts : Monitor for zone breaks that signal strong momentum or shifts in market structure.
4. Confluence : Combine with other indicators (like RSI or volume) for more robust trade setups.
🔔 Alerts:
Receive alerts when new demand or supply zones are formed so you can take action in real time.
✅ Recommended Settings:
For intraday trading : Use lower aggregation values (e.g., 3–5).
For swing/position trading : Higher values (e.g., 6–10) may give better structure.

target tendance//@version=6
indicator("target tendance", "TT", overlay = true)
// Trend settings
st_factor = input.float(12, title="Supertrend Factor", minval=1, step=0.5, group="Trend Settings",
tooltip="Multiplier for the ATR to determine Supertrend bands width. Higher values create wider bands and fewer signals.")
st_atr_period = input.int(90, title="Supertrend ATR Period", minval=1, group="Trend Settings",
tooltip="Number of bars used to calculate the ATR for Supertrend. Longer periods create smoother, less reactive bands.")
wma_length = input.int(40, title="WMA Length", minval=1, group="Trend Settings",
tooltip="Length of the Weighted Moving Average applied to the SuperTrend. Higher values create smoother, less reactive lines.")
ema_length = input.int(14, title="EMA Length", minval=1, group="Trend Settings",
tooltip="Length of the Exponential Moving Average applied to the WMA. Controls the final smoothness of the trend line.")
//Continuation settings
cont_factor = input.int(3, title="Confirmation count", minval=1, group="Rejection Settings",
tooltip="Number of consecutive bars that must consolidate at the trend line before a rejection signal is generated. Higher values require more bars to confirm a trend.")
// Volatility settings
shw_TP1 = input.bool(true, title="Show Take Profit Levels", group="Targets",
tooltip="Toggle visibility of take profit target levels on the chart.")
atr_period = input.int(14, title="Volatility (ATR) period", minval=1, group="Targets",
tooltip="Number of bars used to calculate the Average True Range for position sizing and targets.")
sl_multiplier = input.float(5, title="Stop Loss ATR Multiplier", minval=0.1, step=0.1, group="Targets",
tooltip="Multiplier applied to ATR to determine stop loss distance from entry. Higher values place stops further away.")
tp1_multiplier = input.float(0.5, title="TP1 Multiplier", minval=0.1, step=0.1, tooltip="Multiple of SL distance for first take profit target.", group="Targets")
tp2_multiplier = input.float(1.0, title="TP2 Multiplier", minval=0.1, step=0.1, tooltip="Multiple of SL distance for second take profit target.", group="Targets")
tp3_multiplier = input.float(1.5, title="TP3 Multiplier", minval=0.1, step=0.1, tooltip="Multiple of SL distance for third take profit target.", group="Targets")
volatility = ta.atr(atr_period)
// Appearance settings
green = input.color(#95eed6, title="Bullish Color", tooltip="Color used for bullishness", group="Appearance")
red = input.color(#ff1100, title="Bearish Color", tooltip="Color used for bearishness", group="Appearance")
pine_supertrend(factor, atrPeriod) =>
src = hl2
atr = ta.atr(atrPeriod)
upperBand = src + factor * atr
lowerBand = src - factor * atr
prevLowerBand = nz(lowerBand )
prevUpperBand = nz(upperBand )
lowerBand := lowerBand > prevLowerBand or close < prevLowerBand ? lowerBand : prevLowerBand
upperBand := upperBand < prevUpperBand or close > prevUpperBand ? upperBand : prevUpperBand
= pine_supertrend(st_factor, st_atr_period)
tL = ta.ema(ta.wma(math.avg(lwr, upr), wma_length), ema_length)
var trend = 0
if ta.crossover(tL, tL )
trend := 1
if ta.crossunder(tL, tL )
trend := -1
var rejcount = 0
bullishrej = trend == 1 and high > tL and low < tL
bearishrej = trend == -1 and high > tL and low < tL
if (bullishrej or bearishrej)
rejcount += 1
if ta.cross(trend, 0) or (not (bullishrej or bearishrej) and rejcount > 0)
rejcount := 0
plotchar((rejcount > cont_factor and trend == 1) ? tL : na, "Bullish Rejection", "▲", location.belowbar, green, size = size.tiny)
plotchar((rejcount > cont_factor and trend == -1) ? tL : na, "Bearish Rejection", "▼", location.abovebar, red, size = size.tiny)
plot(tL, "Baseline", color=trend == 1 ? color.new(green, 50) : color.new(red, 50), linewidth = 2)
barcolor(trend == 1 ? color.new(green, 50) : color.new(red, 50))
plotshape(ta.crossover(tL, tL ) ? tL : na, title="Bullish Trend Change", style=shape.labelup, location=location.absolute, size=size.small, color=green)
plotshape(ta.crossunder(tL, tL ) ? tL : na, title="Bearish Trend Change", style=shape.labeldown, location=location.absolute, size=size.small, color=red)
longSignal = ta.crossover(trend, 0)
shortSignal = ta.crossunder(trend, 0)
var SL = 0.0
var TP1_lvl = 0.0
var TP2_lvl = 0.0
var TP3_lvl = 0.0
var line entry_line = na
var line sl_line = na
var line tp1_line = na
var line tp2_line = na
var line tp3_line = na
var label entry_label = na
var label sl_label = na
var label tp1_label = na
var label tp2_label = na
var label tp3_label = na
if longSignal and shw_TP1
SL := low - volatility * sl_multiplier
TP1_lvl := close + math.abs(close - SL) * tp1_multiplier
TP2_lvl := close + math.abs(close - SL) * tp2_multiplier
TP3_lvl := close + math.abs(close - SL) * tp3_multiplier
entry_line := line.new(bar_index, close, bar_index, close, color = green, width = 3)
entry_label := label.new(bar_index, close, text = "Entry ▸ " + str.tostring(close, format.mintick), style = label.style_label_left, color = green, textcolor = color.white)
sl_line := line.new(bar_index, SL, bar_index, SL, color = color.new(red, 80), width = 3)
sl_label := label.new(bar_index, SL, text = "✘ SL ▸ " + str.tostring(SL, format.mintick), style = label.style_label_left, color = color.new(red, 80), textcolor = color.white)

Smart Session SyncSmart Session Sync — Intelligent Trading Session Overlay
- By 0xTheChartist Code2trade
Smart Session Sync is designed to detect major reversal points and key price pivots formed on higher timeframes, particularly during high-volume periods of the day — often marking the footprints of institutional orders and whales.
🔍 Key Features:
Displays standard sessions (Asian, London, New York) and allows adding custom time sessions.
Offers two visualization modes:
Time session table
Visual session boxes plotted on the chart
Auto-sync with seasonal time changes (Summer/Winter), supports Daylight Saving Time (DST)
Full flexibility:
Toggle table, boxes, and labels on/off
Customize colors for all session elements
Choose which months are considered summer/winter
💡 Suggested Use Case:
Use Smart Session Sync to pinpoint critical price structures such as:
Peaks and troughs of trending waves
Highs/lows in Wyckoff trading ranges
Liquidity sweeps or untouched liquidity zones
----------------------

Swing Highs and Lows Detector🔍 Swing Highs and Lows Detector
The Swing Highs and Lows Detector is a powerful tool for traders looking to identify meaningful structural shifts in price action, based on swing point logic and internal trend shifts.
📈 What It Does
This indicator automatically identifies and labels:
HH (Higher High) – Price broke above the previous swing high
LH (Lower High) – Price failed to break the previous high, signaling potential weakness
LL (Lower Low) – Price broke below the previous swing low
HL (Higher Low) – Price maintained a higher support level, indicating strength
The script distinguishes between bullish and bearish internal shifts and tracks the highest/lowest points between those shifts to determine the swing structure.
⚙️ How It Works
You can choose between two shift detection modes:
"Open": Compares closing price to the first open of the opposite streak
"High/Low": Uses the high of bearish or low of bullish candles
Once a shift is confirmed, the indicator scans the bars between shifts to find the most significant swing high or low
When a valid swing is detected, it’s labeled directly on the chart with color-coded markers
🛎️ Built-in Alerts
Set alerts for:
Higher High
Lower High
Lower Low
Higher Low
These alerts help you catch key structural shifts in real time — great for breakout traders, structure-based analysts, and smart money concepts (SMC) strategies.
✅ How to Use
Confirm Trend Strength or Reversals – Use HH/HL to confirm an uptrend, LL/LH to confirm a downtrend
Combine with Liquidity Sweeps or Zones – Ideal for SMC or Wyckoff-style setups
Entry/Exit Triggers – Use swing breaks to time entries or exits near key structural points

CANX SMC Levels, Traps & MS © CanxStixTrader
This indicator helps spot inducements and Smart Money Traps as well as basic support and resistance levels on your chosen time frame. Updated to include market structure to help identify valid zones and when to place your trades.
Using four of the most significant points in price action
1. Breakouts
2. False Breakouts (Traps)
3. Back Checks
4. Market Structure
I always go on about price action on my channels because this alone can help identify valid and invalid positions. If these three points are properly identified they can be some of the most significant points of movement in the price and bring significant gains to traders.
Breakouts
Breakouts can bring significant moves in price as the market swings after key levels are breached. This entry type can bring large moves and if momentum is on your side at those key levels.
False Breakouts
Also known as a bull trap or a bear trap, false breakouts can lead to swift and significant reversal of what looks like a key area break then becomes a large and sudden move to the opposite side. When a key level breakout fails to hold, parties entering to capitalize on the breakout can get left holding or forcing them to exit at a loss, which can double the force of pressure on the move to the opposite side.
Back Checks
Back checks are pull backs in trend that find middle ground to the two areas already described. Both momentum and entry price are decent, but risk is defined as a key level has flipped offering entry with stops below demand, or above supply.
Market Structure
Helps to identify the market direction and potential trend reversals so you have more clarity when placing your trade
-----------------------------------
Combining these four methods will helps to diversify risk, understand trend development. This script helps to identify these points to traders with analysis of key levels, price structure, and trend direction.
Enjoy,
© CanxStixTrader
Keep it simple

Zonas con Retrocesofibonacci [Nachomixcrypto]The "Zonas con Retrocesofibonacci " Pine Script indicator for TradingView visualizes Smart Money Concepts (SMC) by displaying premium, discount, and equilibrium zones, along with a Fibonacci Golden Zone (0.50–0.786 retracement), tailored to the chart’s timeframe.
Premium Zone: Red box near recent highs (trailing.top), labeled "Premium," marking overbought areas for potential selling. Customizable via premiumZoneColorInput, with toggleable borders (premiumBorderToggle).
Discount Zone: Green box near recent lows (trailing.bottom), labeled "Descuento," indicating oversold areas for potential buying. Customizable via discountZoneColorInput, with toggleable borders.
Equilibrium Zone: Gray box at the midpoint of recent high/low, labeled "Equilibrio," showing a neutral price area. Customizable via equilibriumZoneColorInput, with toggleable borders.
Fibonacci Golden Zone: Gold box spanning 0.50 to 0.786 retracement levels from recent high to low, labeled "Zona Dorada." Includes labels for 0.50, 0.618, and 0.786 levels, though prices may be inaccurate due to continuous updates of trailing.top/trailing.bottom. Optional dashed range line connects high to low (showFiboRangeLineInput).
Functionality:
Zones are drawn as semi-transparent boxes from the high/low bar to the current bar, adapting to the timeframe using trailingExtremes for recent highs/lows.
Fibonacci retracement uses trailing.top and trailing.bottom, with a box and labels highlighting the 0.50–0.786 range.
Controlled by showPremiumDiscountZonesInput and showFiboGoldenZoneInput (both default: true).
Use Case: Ideal for SMC traders identifying institutional buying/selling zones and Fibonacci-based reversal areas on higher timeframes (e.g., 1H, 4H) in liquid markets.
Limitation: Fibonacci price labels may show incorrect values due to dynamic updates of trailing.top/trailing.bottom.Premium Zone: Red box near recent highs, labeled "Premium," indicating a potential selling area.
Discount Zone: Green box near recent lows, labeled "Descuento," indicating a potential buying area.
Equilibrium Zone: Gray box at the midpoint, labeled "Equilibrio," marking a neutral zone.
Golden Zone: Gold box from 0.50 to 0.786 retracement, labeled "Zona Dorada," with additional labels for 0.50, 0.618, and 0.786 levels (e.g., "0.50--------", "0.618------", "0.786------").
Range Line: Optional dashed gold line connecting the high to the low used for Fibonacci retracement.
Customization: Users can toggle zones and Fibonacci, adjust colors (premiumZoneColorInput, fiboGoldenZoneColorInput), and enable/disable borders via settings.

OB🚀 NEW TradingView Indicator – Order Blocks! 📊
Tired of messy charts full of clutter?
Meet the indicator that does the heavy lifting:
🔹 Automatically marks all Order Blocks (OB)
🔹 Auto-deletes them once they’re broken (when price closes beyond the high/low)
🔹 Keeps your chart clean, clear, and focused
🔹 Works on all timeframes
🔹 Fully customizable to match your trading style

Opening Range BreakoutOPENING RANGE BREAKOUT (ORB) INDICATOR
DESCRIPTION
The Opening Range Breakout indicator is a powerful technical analysis tool designed specifically for US equity markets. It identifies and visualizes the opening range established during the first configurable minutes of each trading day (starting at 9:30 AM EST), then provides clear signals when price breaks out of or rejects from these key levels.
This indicator combines multiple timeframe analysis capabilities with precise breakout detection to help traders identify high-probability trading opportunities based on opening range dynamics.
KEY FEATURES
Configurable Opening Range:
• Set opening range duration from 5 minutes to 4 hours
• Automatically adjusts calculations based on your chart timeframe
• Works on any timeframe (1m, 5m, 15m, 1h, etc.)
Multi-Day Range Display:
• Shows up to 50 days of historical opening ranges
• Each day's range properly contained within its trading session
• Range lines extend from market open (9:30 AM) to market close (4:00 PM EST)
Clear Signal System:
• Green arrows (⬆): Bullish breakouts and rejections
• Red arrows (⬇): Bearish breakouts and rejections
• Two signal types: Close breakouts (normal size) and wick rejections (small size)
Visual Range Highlighting:
• Opening range period highlighted with colored box
• Customizable colors for range fill, borders, and midline
• Clean, professional appearance with configurable line styles
SIGNAL TYPES
Bullish Signals (Green ⬆):
1. Close Breakout Above Range (Normal Size): 5-minute candle closes above the opening range high
2. Wick Rejection from Below (Small Size): Price wicks below the opening range low but closes back inside the range
Bearish Signals (Red ⬇):
1. Close Breakout Below Range (Normal Size): 5-minute candle closes below the opening range low
2. Wick Rejection from Above (Small Size): Price wicks above the opening range high but closes back inside the range
CONFIGURATION OPTIONS
Range Settings:
• Opening Range Minutes: Duration of opening range (default: 30 minutes)
• Lookback Days: Number of historical days to display (default: 20 days)
Visual Customization:
• Range Color: Fill color for the opening range area
• Border Color: Color for range high/low lines
• Midline Color: Color for the range midpoint line
• Opening Range Highlight Color: Color for the opening period box
• Line Style: Solid, Dashed, or Dotted lines
• Line Width: 1-4 pixel width options
Display Options:
• Show Midline: Toggle midpoint line display
• Show Range Labels: Toggle price level labels
• Arrow Distance: Adjust arrow positioning (0.1-2.0%)
USAGE GUIDE
Basic Setup:
1. Add the indicator to your chart (works best on 5-minute timeframe)
2. Configure your preferred opening range duration (15m, 30m, or 60m are popular choices)
3. Adjust lookback days based on your analysis needs
4. Customize colors and line styles to match your chart theme
Trading Applications:
Breakout Trading:
• Long Entry: Green arrow (close breakout above range) + confirmation
• Short Entry: Red arrow (close breakout below range) + confirmation
• Stop Loss: Opposite side of the opening range
• Target: 1-2x the range size or key support/resistance levels
Range Rejection Trading:
• Reversal Setups: Small arrows indicate failed breakouts
• Mean Reversion: Trade back toward range midline
• Support/Resistance: Use range levels as key price zones
Multi-Day Analysis:
• Identify recurring support/resistance levels
• Analyze range expansion/contraction patterns
• Compare current day's activity to recent history
BEST PRACTICES
1. Timeframe Selection: 5-minute charts provide optimal signal clarity
2. Range Duration: 30-minute opening range is most commonly used, but adjust based on:
- Market volatility
- Stock characteristics
- Trading style preference
3. Confirmation: Use additional indicators or price action for trade confirmation
4. Risk Management: Always use appropriate position sizing and stop losses
MARKET SESSIONS
The indicator is specifically designed for US equity markets:
• Market Open: 9:30 AM EST
• Market Close: 4:00 PM EST
• Opening Range: Calculated from market open
• Range Lines: Extend throughout the trading day only
PERFORMANCE NOTES
• Optimized for real-time trading with minimal lag
• Automatically manages memory by cleaning old ranges
• Efficiently handles multiple timeframes and range calculations
KNOWN ISSUES & WORKAROUNDS
Historical Buffer Error:
Issue: Occasionally, you may encounter an error: "The requested historical offset (XXX) is beyond the historical buffer's limit (770)"
Workaround:
1. Switch to a different timeframe temporarily
2. Switch back to your original timeframe
3. The indicator will reload and function normally
This is a Pine Script limitation related to historical data access and doesn't affect the indicator's core functionality.
COMPATIBILITY
• Pine Script Version: v6
• Chart Types: All chart types supported
• Timeframes: All timeframes (optimized for 1m-1h)
• Markets: Designed for US equity markets during regular trading hours
TIPS FOR MAXIMUM EFFECTIVENESS
1. Combine with Volume: High volume on breakouts increases reliability
2. Market Context: Consider overall market direction and volatility
3. News Awareness: Be cautious around earnings and major announcements
4. Range Quality: Wider ranges often provide better breakout opportunities
5. Time of Day: Early breakouts (first 1-2 hours) often have higher follow-through
This indicator is provided for educational and informational purposes. Always conduct your own analysis and manage risk appropriately.

Linear Volume MACD | Lyro RS📊 Linear Volume MACD | Lyro RS is an advanced momentum and trend detection tool that fuses price action with volume-weighted MACD logic and linear regression analysis . Designed for traders seeking deeper insights into market strength and directional conviction, this indicator highlights trend shifts, volume anomalies, and potential reversal zones with precision.
✨ Key Features :
🔁 Multi-Mode Analysis: Switch between Linear Regression , Strong/Weak Trend , or Volume MACD logic.
📐 Volume-Adjusted MACD: Incorporates volume for a more realistic momentum view.
📊 Linear Regression Signal: Smoother and more reactive trend analysis.
🎯 Dynamic Stdev Bands: Visualize ±1 and ±2 standard deviation thresholds for anomaly detection.
🌈 Custom Color Themes: Choose from built-in palettes or define your own bullish/bearish signal colors.
⚠️ Alert Conditions: Built-in alerts notify you of potential trend shifts across all signal modes.
📈 How It Works :
🧮 MACD Core: Uses volume-weighted price to generate fast and slow EMAs, forming the MACD and signal lines.
📉 Histogram Logic: Histogram is either the traditional MACD histogram or its linear regression version.
📊 Signal Modes:
• Linear Regression: Detect trend based on smoothed MACD behavior.
• Strong/Weak Trend: Identifies accelerating/decelerating trend strength.
• Volume MACD: Classic volume MACD behavior for divergence spotting.
📏 Stdev Bands: Calculated over a long period (default 200) to highlight statistically significant moves.
🎨 Color-coded Feedback: Bar and background colors adjust dynamically with market condition.
⚙️ Customization Options :
🔄 Choose your Signal Type from three unique analysis modes.
📏 Modify Fast/Slow/Signal lengths and Regression parameters to suit your strategy.
📈 Enable or disable Stdev Bands and adjust multiplier.
🎨 Select from Classic, Mystic, Accented, or Royal color palettes — or create your own.
📌 Use Cases :
🟢 Identify trend continuation or reversal zones with volume-adjusted signals.
🔴 Detect volatility breakouts using standard deviation bands.
🧭 Use in confluence with price structure, RSI, or market sentiment.
⚠️ Disclaimer :
This indicator is for educational purposes only. It is not financial advice. Always use in conjunction with your own research and risk management strategy.

Order Blocks📈 Order Blocks Only (With Mitigation Alerts)
This indicator identifies bullish and bearish order blocks on your chart and alerts you when they are formed or mitigated . Order blocks are key institutional price levels where strong buying or selling has previously occurred, often leading to significant future price reactions.
🔍 How It Works:
-Bullish Order Block: Formed when price closes above the high of a recent bearish candle. This suggests buyers have taken control.
-Bearish Order Block: Formed when price closes below the low of a recent bullish candle. This signals seller dominance.
-Once an order block is formed, a box is drawn on the chart to highlight the zone.
-These boxes last for a user-defined number of bars (default is 20) and can be automatically removed when price mitigates (retests and closes beyond) the zone.
🛠 User Settings:
-Show Bullish Order Blocks – Toggle green zones on/off.
-Show Bearish Order Blocks – Toggle red zones on/off.
-Order Block Duration – How many bars the boxes should remain on the chart.
-Delete Mitigated Boxes – If enabled, mitigated zones are automatically removed.
-Custom Colors – Personalize the fill and border colors of bullish and bearish blocks.
🔔 Alerts:
This tool supports four built-in alert types:
-Bullish Order Block Formed
-Bearish Order Block Formed
-Bullish Order Block Mitigated
-Bearish Order Block Mitigated
Set these alerts to stay on top of key price reactions.
✅ How to Use It:
1. Apply the indicator to any chart and timeframe.
2. Watch for new order blocks to form after strong price breaks.
3. Use these zones as potential entry points, stop placement areas, or take profit zones.
4. Enable alerts to catch key institutional levels as they form or are retested.

Swing Pivots + Static Dashboard (v5.7-k10-l-alert2)Lorem Ipsum is simply dummy text of the printing and typesetting industry. Lorem Ipsum has been the industry's standard dummy text ever since the 1500s, when an unknown printer took a galley of type and scrambled it to make a type specimen book. It has survived not only five centuries, but also the leap into electronic typesetting, remaining essentially unchanged. It was popularised in the 1960s with the release of Letraset sheets containing Lorem Ipsum passages, and more recently with desktop publishing software like Aldus PageMaker including versions of Lorem Ipsum

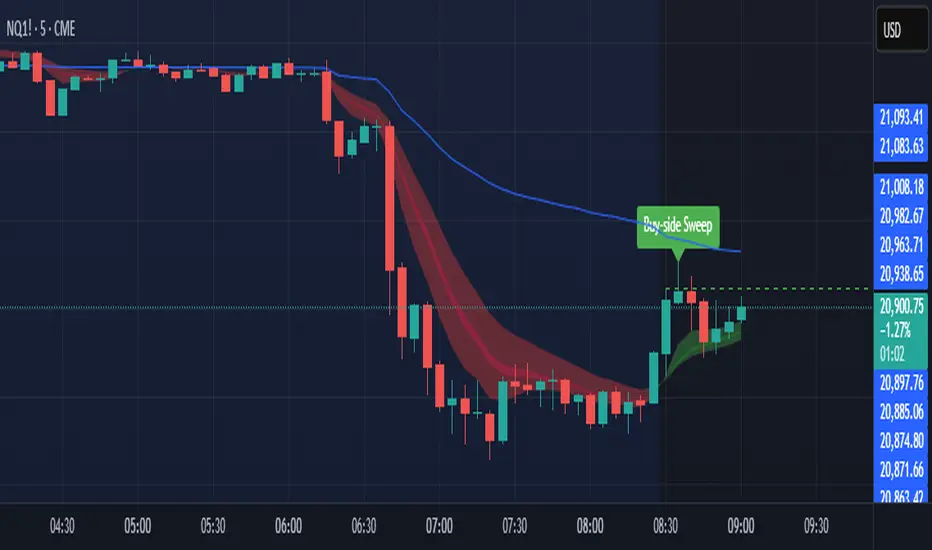
Sniper SweepsPurpose
Detect when price sweeps above recent highs (buy-side liquidity) or below recent lows (sell-side liquidity), but closes back inside the range. This is often interpreted as a stop-hunt or liquidity grab by institutional traders.
Core Concepts
Liquidity Sweep: When price briefly breaks a recent swing high/low (potentially triggering stop losses), but then closes back within the previous range.
Buy-side Sweep: Price breaks a previous high, but closes below it.
Sell-side Sweep: Price breaks a previous low, but closes above it.
Summary
This indicator is useful for:
Identifying potential stop-hunts or liquidity grabs.
Recognizing SMC trade setups around swept highs/lows.
Getting alerted when significant liquidity levels are manipulated.
RSI Buy Sell Signals[RanaAlgo]This RSI indicator provides a clean implementation of the Relative Strength Index with visual trading signals. It calculates RSI values using standard formula and displays buy/sell alerts when the indicator crosses the oversold (30) or overbought (70) thresholds. The background color changes to highlight extreme zones, with horizontal reference lines marking key levels. A compact table shows the current RSI value in the corner. The design focuses on clear signal generation while maintaining TradingView's native RSI accuracy, focused trading tool.

CANX SMC Levels, Traps & MS © CanxStixTrader
This indicator helps spot inducements and Smart Money Traps as well as basic support and resistance levels on your chosen time frame. Updated to include market structure to help identify valid zones and when to place your trades.
Using four of the most significant points in price action
1. Breakouts
2. False Breakouts (Traps)
3. Back Checks
4. Market Structure
I always go on about price action on my channels because this alone can help identify valid and invalid positions. If these three points are properly identified they can be some of the most significant points of movement in the price and bring significant gains to traders.
Breakouts
Breakouts can bring significant moves in price as the market swings after key levels are breached. This entry type can bring large moves and if momentum is on your side at those key levels.
False Breakouts
Also known as a bull trap or a bear trap, false breakouts can lead to swift and significant reversal of what looks like a key area break then becomes a large and sudden move to the opposite side. When a key level breakout fails to hold, parties entering to capitalize on the breakout can get left holding or forcing them to exit at a loss, which can double the force of pressure on the move to the opposite side.
Back Checks
Back checks are pull backs in trend that find middle ground to the two areas already described. Both momentum and entry price are decent, but risk is defined as a key level has flipped offering entry with stops below demand, or above supply.
Market Structure
Helps to identify the market direction and potential trend reversals so you have more clarity when placing your trade
-----------------------------------
Combining these four methods will helps to diversify risk, understand trend development. This script helps to identify these points to traders with analysis of key levels, price structure, and trend direction.
Enjoy,
© CanxStixTrader
Keep it simple

HTF High/Low Targets This script plots the previous Highs and Lows of the 1HR, 4HR, Daily, and Weekly timeframes.
Each level is color-coded, extends across the chart, and includes labels to help you spot key areas of past support and resistance.
Use this tool to:
- Confirm intraday price reactions at HTF zones
- Identify high-probability reversal or breakout areas
- Get notified with built-in alerts when price crosses a level
You can toggle each timeframe level on/off in the settings panel.
Great for:
- Day traders and scalpers who trade off 1-minute or 5-minute charts
-Swing traders looking for confluence with HTF zones
- Anyone using a multi-timeframe analysis approach
Created by @mychaellesliemedia.

SOXL Trend Surge v3.0.2 – Profit-Only RunnerSOXL Trend Surge v3.0.2 – Profit-Only Runner (Long Only)
Optimized for the 45-minute chart
Description:
A refined breakout strategy tailored for SOXL on the 45-minute timeframe, this version of the Trend Surge engine eliminates stop losses entirely to focus on pure trend exploitation. Version 3.0.2 uses dynamic partial exits and trailing profits, enabling trades to run uninterrupted through volatile momentum expansions.
Performance Snapshot (45m timeframe):
+641% cumulative return
96.88% win rate (62 of 64 trades)
Avg. profit per trade: $50.09
Profit factor: 370.77
Max drawdown: 32.84%
Largest win: $148.47
Only 2 losing trades total
Entry Criteria:
Price > 200 EMA
Supertrend bullish
ATR increasing (volatility-confirmation)
Volume above 20-bar average
Trade window: 7am–12pm PST
Exit Strategy:
Take 50% profit at 2× ATR gain
Remaining position rides via 1.5× ATR trailing stop
No stop loss, no RSI or break-even exit
Ideal For:
Webull cash traders
ETF swing scalpers
Automated alert-to-order workflows (Alpaca, TradingView alerts, etc.)
Traders who prefer let-the-run happen style risk management

Volume-Weighted SMI with Divergence Alerts📊 Volume-Weighted SMI with Divergence Alerts
This indicator is a modified version of the Stochastic Momentum Index (SMI) that incorporates volume-weighting to give more significance to price movements during high-volume periods. It also includes optional divergence alerts for improved signal precision.
🔍 Key Features:
Volume-Weighted SMI: Enhances the traditional SMI by amplifying signals during high-volume conditions.
WMA Smoothing: Applies a weighted moving average for clearer trend structure.
Custom Thresholds: Adjustable upper and lower bounds (default ±80) to identify overbought/oversold zones.
Divergence Alerts:
Detects bullish divergence (price makes lower lows, SMI makes higher lows).
Detects bearish divergence (price makes higher highs, SMI makes lower highs).
Sends alerts without plotting markers to keep your chart clean.
⚙️ Inputs:
SMI Length: Lookback for high/low range.
K Smoothing: Smooths the volume-weighted SMI signal.
WMA Length: Period of the WMA applied to the smoothed SMI.
Upper/Lower Threshold: Custom levels for signal zones.
Pivot Lookback: Defines the swing structure used in divergence detection.
🔔 Alerts:
Set a TradingView alert on:
“Any alert() function call”
to receive real-time divergence notifications (bullish or bearish) directly from the indicator.
🧠 How to Use:
Look for crossovers of the WMA with the SMI line to confirm shifts in momentum.
Use threshold levels for overbought/oversold identification.
Watch for divergence alerts to anticipate potential reversals or exhaustion.

POC + VWAP Strategy w/ Time Filter & Trailing StopPoint of control from fixed range volume profile is determined on a 15 min chart. When price touches the point of control and price is below VWAP, it is a sell. When price is above vwap a buy happens. Only one trade at at time and there are trailing stop and take profit parameters.
