Live Ichimoku BOXThis indicator offers a unique "Visual" approach to the Ichimoku Kinko Hyo system. Instead of just plotting lines, it visualizes the mathematical logic behind the Tenkan-sen (9), Kijun-sen (26), and Span B (52) in real-time.
Core Concept: Ichimoku lines represent the equilibrium (50% level) of the High-Low range over a specific period. This tool draws Equilibrium Boxes to show exactly where these Highs and Lows are located relative to the current price.
Key Features:
Live Equilibrium Boxes: Visualizes the 9, 26, and 52-period ranges on the current live candle.
Mid-Lines: Clearly marks the equilibrium points (Tenkan, Kijun, Span B) within each box.
Vector Lines: Diagonal lines connecting the High and Low of each box to visualize momentum direction.
Fractals & Signals: Marks major pivots with Stars (*) and secondary pivots with Arrows.
Time Counters: Displays the candle count from the pivot to the current bar.
Future & Past: Visualizes the Chikou Span (lagging) and Future Cloud levels (leading) using dash lines.
Split-Color Background: distinct transparency for the upper and lower halves of the boxes for better trend identification.
How to Use: Use this tool to understand the market structure behind the Ichimoku lines. If the price is above the box's mid-line, the trend is bullish for that period. Aligned mid-lines indicate strong support/resistance levels.
این اندیکاتور یک دیدگاه کاملاً جدید و "بصری" (Visual) به سیستم ایچیموکو کینکو هیو (Ichimoku Kinko Hyo) ارائه میدهد. برخلاف اندیکاتورهای کلاسیک که فقط خطوط را رسم میکنند، این ابزار منطق محاسباتی پشت خطوط تنکانسن (۹)، کیجونسن (۲۶) و اسپن بی (۵۲) را در لحظه حال (Live) به تصویر میکشد.
فلسفه عملکرد: در ایچیموکو، خطوط بر اساس میانگینِ بالاترین قیمت (High) و پایینترین قیمت (Low) در یک دوره خاص محاسبه میشوند. این اندیکاتور با رسم باکسهای تعادلی (Equilibrium Boxes)، دقیقاً نشان میدهد که این سقف و کفها کجا هستند و قیمت در حال حاضر نسبت به "ناحیه تعادل" (۵۰٪ باکس) چه وضعیتی دارد.
ویژگیهای کلیدی:
🟥 باکسهای ۹، ۲۶ و ۵۲ دوره: نمایش محدوده نوسان قیمت در دورههای زمانی استاندارد ایچیموکو بر روی کندل زنده.
➖ خطوط میانی (Mid-Lines): نمایش دقیق محل تنکانسن، کیجونسن و اسپن بی به صورت خطوط دش یا ضخیم در وسط باکسها.
📐 بردارهای حرکتی (Vectors): رسم خطوط مورب داخل باکس که جهت و شتاب حرکت از High به Low (یا برعکس) را نشان میدهند.
✨ نقاط چرخش (Pivots): نمایش سقفها و کفهای ماژور با علامت ستاره (*) و نقاط برگشت فرعی با فلش (Arrows).
🔢 شمارشگر زمانی: نمایش تعداد کندلهای گذشته از سقف یا کف باکس تا لحظه حال.
🔮 آینده و گذشته: نمایش وضعیت چیکو اسپن (۲۵ کندل عقبتر) و ابرهای آینده (۲۵ کندل جلوتر) به صورت خطوط راهنما.
🎨 طراحی دو رنگ (Split Color): ناحیه بالای تعادل و پایین تعادل با شفافیتهای متفاوت نمایش داده میشوند تا تشخیص روند صعودی/نزولی در یک نگاه ساده باشد.
نحوه استفاده: این ابزار برای کسانی طراحی شده که میخواهند "چرایی" حرکت قیمت را درک کنند. وقتی قیمت بالای خط میانی باکس قرار دارد، خریداران در آن بازه زمانی کنترل را در دست دارند و برعکس. همپوشانی باکسها و خطوط میانی، نواحی قدرتمند حمایت و مقاومت را نشان میدهد.
Análise de Tendência

Buy Sell Signal (Improved Simple)Buy Sell Signal (Improved Simple) es un indicador mejorado del original

DisruptNEX Edge SystemDisruptNEX Edge System is an analytical overlay indicator designed to visualize market direction, trend maturity, exhaustion conditions, and impulse activity within a single, coherent framework.
The system is built as a structured analytical model rather than a collection of independent tools.
All visual elements are derived from a shared internal reference, ensuring consistency between trend context, exhaustion states, impulse activity, and higher-timeframe structure.
1. Market Regime & Trend Visualization
Illustration 1: Market regime visualization through candle coloring.
At the foundation of the system lies a price-centered baseline, computed as a windowed mid-range estimator with optional adaptive smoothing.
This baseline defines the current market regime:
Price above the baseline represents bullish directional pressure.
Price below the baseline represents bearish directional pressure.
The regime is expressed directly through candle coloring, allowing traders to visually identify the active trend without relying on additional overlays or separate panels.
This regime context acts as the primary reference for all subsequent components of the system.
2. Exhaustion Zones on the Price Chart
Illustration 2: Overbought / Oversold ribbons visualized directly on price.
DisruptNEX Edge System identifies potential exhaustion using a persistence-based evaluation of how consistently price holds above or below a volatility-adjusted reference.
Unlike oscillators displayed in a separate pane, exhaustion is visualized directly on the price chart using bounded ribbons.
Key characteristics of the exhaustion logic:
Overbought and Oversold states are detected as discrete state transitions.
Zones are marked at their initial appearance.
Visual persistence reflects state continuity rather than momentary fluctuations.
This approach helps traders assess when price reaches statistically stretched conditions relative to the active regime, often corresponding to areas where pullbacks or pauses may develop.
3. Candlestick Pattern Context
Illustration 3: Candlestick patterns displayed within the active trend context.
The system includes optional candlestick pattern detection displayed directly on the price chart as contextual information.
Patterns are evaluated relative to the active market regime and are commonly associated with short-term pauses, pullbacks, or localized price reactions within an existing trend.
Patterns are not interpreted as standalone reversal signals and do not provide trade instructions.
Their role is to complement trend context by highlighting moments where traders may choose to observe price behavior more closely.
4. Spark Impulses & Structural Reference Zones
Illustration 4: Spark impulses and dynamic structural reference zones.
Spark impulses highlight moments when directional pressure increases within the active market regime.
They are derived from a volatility-normalized measure of price displacement relative to the internal baseline and evaluated across multiple smoothing horizons.
This allows the system to identify shifts in directional activity rather than isolated price fluctuations.
Spark impulses commonly appear after consolidation, pullbacks, or localized hesitation and act as analytical confirmation that market activity is resuming in a given direction.
Alongside impulse visualization, the system derives dynamic structural reference levels based on recent price behavior and volatility.
These levels are updated only on the most recent bar and represent contextual support and resistance zones.
Structural reference levels are not predictive targets.
They serve as spatial guides, helping traders evaluate price positioning relative to recent structure and impulse activity.
5. Trend Power & Multi-Timeframe HUD
Illustration 5: Right-side HUD summarizing multiple timeframes.
The indicator includes a compact HUD panel that aggregates key structural information across multiple timeframes:
Overbought / Oversold state
Trend Power level
Trend direction
Trend Power quantifies how extended the current regime is by measuring price progression since the last confirmed regime change, normalized by volatility and mapped to a bounded scale.
This allows traders to distinguish between developing, established, and extended trends, while the multi-timeframe layout helps assess alignment between the current chart and higher-level market structure.
How to Read the Indicator
Start by observing candle coloring to identify the active market regime.
Use exhaustion ribbons to recognize areas where price may pause or pull back relative to the regime.
Treat candlestick patterns as contextual signals highlighting potential short-term reactions.
Look for Spark impulses as confirmation of renewed directional activity.
Use structural reference zones as orientation points when evaluating price location.
Consult the HUD to check trend direction, maturity, and exhaustion across higher timeframes.
Alerts & Usage Notes
Alerts are event-based and triggered only on confirmed state changes, including:
Regime transitions
Exhaustion state entries
Candlestick pattern detection
Spark impulse events
Important Notes
DisruptNEX Edge System is not an automated trading system.
It does not execute trades or provide trade instructions.
All outputs are analytical and visual in nature and are intended to support discretionary decision-making.

NY Session Range & FlowNY Session Range & Flow is a rule-based intraday futures indicator designed for the New York session, with a focus on MNQ / NQ price behavior.
This indicator does not predict the market. Instead, it maps context, structure, and flow so traders can make disciplined decisions with predefined risk.
🔍 Core Concepts
NY Session Range & Flow combines:
Session structure
Range usage (ADR / AWR)
VWAP positioning & slope
Liquidity sweeps
Supply & Demand zones
Opening Range Breakouts
Mean reversion vs trend continuation logic
All signals are graded and throttled to reduce noise and overtrading.
📌 What the Indicator Shows
🕒 Session Logic (NY Time)
RTH (09:30–16:00 NY)
Trade windows (AM / PM)
Opening Range (09:30–09:45)
ETH session ranges (for context only)
📊 Range & Regime Awareness
ADR / AWR usage
Identifies expansion vs exhaustion
Helps avoid trading when range is already spent
📉 Flow & Bias
VWAP with optional ATR bands
VWAP slope filter for directional bias
Mean reversion distance rules
🧲 Liquidity & Structure
Prior Day High / Low
NY High / Low / Mid
Opening Range High / Low
Liquidity sweep detection
📦 Supply & Demand Zones
Higher-timeframe pivot-based zones
ATR-adjusted zone thickness
Last active zone tracking
🎯 Signal Types (Graded)
Trend Continuation
Sweep Reversal
Opening Range Breakout (ORB)
Mean Reversion to VWAP
Each signal is scored and graded (A+ → C) based on:
Structure
Liquidity
VWAP alignment
Regime context
Only signals that meet your selected quality threshold are displayed.
⚖️ Risk Visualization
Fixed Stop Loss & Take Profits in ticks
Supports SL + TP1 + TP2
Optional ATR trailing structure
Visual SL/TP lines for clarity (manual execution)
This is a decision-support tool, not an auto-trading system.
📋 Range Usage Table
Displays real-time usage for:
RTH
ETH
Weekly
Monthly ranges
Color-coded to highlight expansion and exhaustion.
⚠️ Important Notes
Designed for manual trading
Best suited for futures traders
Optimized for MNQ / NQ, but adaptable
Not financial advice
🔧 Recommended Use
Combine with strict risk management
One trade at a time
Respect session context and range limits

Wavelet Candle Constructor (Inc. Morlet) 2Here is the detailed description of the **Wavelet Candle** construction principles based on the code provided.
This indicator is not a simple smoothing mechanism (like a Moving Average). It utilizes the **Discrete Wavelet Transform (DWT)**, specifically the Stationary variant (SWT / à Trous Algorithm), to separate "noise" (high frequencies) from the "trend" (low frequencies).
Here is how it works step-by-step:
###1. The Wavelet Kernel (Coefficients)The heart of the algorithm lies in the coefficients (the `h` array in the `get_coeffs` function). Each wavelet type represents a different set of mathematical weights that define how price data is analyzed:
* **Haar:** The simplest wavelet. It acts like a simple average of neighboring candles. It reacts quickly but produces a "boxy" or "jagged" output.
* **Daubechies 4:** An asymmetric wavelet. It is better at detecting sudden trend changes and the fractal structure of the market, though it introduces a slight phase shift.
* **Symlet / Coiflet:** More symmetric than Daubechies. They attempt to minimize lag (phase shift) while maintaining smoothness.
* **Morlet (Gaussian):** Implemented in this code as a Gaussian approximation (bell curve). It provides the smoothest, most "organic" effect, ideal for filtering noise without jagged edges.
###2. The Convolution EngineInstead of a simple average, the code performs a mathematical operation called **convolution**:
For every candle on the chart, the algorithm takes past prices, multiplies them by the Wavelet Kernel weights, and sums them up. This acts as a **digital low-pass filter**—it allows the main price movements to pass through while cutting out the noise.
###3. The "à Trous" Algorithm (Stationary Wavelet Transform)This is the key difference between this indicator and standard data compression.
In a classic wavelet transform, every second data point is usually discarded (downsampling). Here, the **Stationary** approach is used:
* **Level 1:** Convolution every **1** candle.
* **Level 2:** Convolution every **2** candles (skipping one in between).
* **Level 3:** Convolution every **4** candles.
* **Level 4:** Convolution every **8** candles.
Because of this, **we do not lose time resolution**. The Wavelet Candle is drawn exactly where the original candle is, but it represents the trend structure from a broader perspective. The higher the `Decomposition Level`, the deeper the denoising (looking at a wider context).
###4. Independent OHLC ProcessingThe algorithm processes each component of the candle separately:
1. Filters the **Open** series.
2. Filters the **High** series.
3. Filters the **Low** series.
4. Filters the **Close** series.
This results in four smoothed curves: `w_open`, `w_high`, `w_low`, `w_close`.
###5. Geometric Reconstruction (Logic Repair)Since each price series is filtered independently, the mathematics can sometimes lead to physically impossible situations (e.g., the smoothed `Low` being higher than the smoothed `High`).
The code includes a repair section:
```pinescript
real_high = math.max(w_high, w_low)
real_high := math.max(real_high, math.max(w_open, w_close))
// Same logic for Low (math.min)
```
This guarantees that the final Wavelet Candle always has a valid construction: wicks encapsulate the body, and the `High` is strictly the highest point.
---
###Summary of ApplicationThis construction makes the Wavelet Candle an **excellent trend-following tool**.
* If the candle is **green**, it means that after filtering the noise (according to the selected wavelet), the market energy is bullish.
* If it is **red**, the energy is bearish.
* The wicks show volatility that exists within the bounds of the selected decomposition level.
Here is a descriptive comparison of **Wavelet Candles** against other popular chart types. As requested, this is a narrative explanation focusing on the differences in mechanics, interpretation philosophy, and the specific pros and cons of each approach.
---
###1. Wavelet Candles vs. Standard (Japanese) CandlesThis is a clash between "the raw truth" and "mathematical interpretation." Standard Japanese candles display raw market data—exactly what happened on the exchange. Wavelet Candles are a synthetic image created by a signal processor.
**Differences and Philosophy:**
A standard candle is full of emotion and noise. Every single price tick impacts its shape. The Wavelet Candle treats this noise as interference that must be removed to reveal the true energy of the trend. Wavelets decompose the price, reject high frequencies (noise), and reconstruct the candle using only low frequencies (the trend).
* **Wavelet Advantages:** The main advantage is clarity. Where a standard chart shows a series of confusing candles (e.g., a long green one, followed by a short red one, then a doji), the Wavelet Candle often draws a smooth, uniform wave in a single color. This makes it psychologically easier to hold a position and ignore temporary pullbacks.
* **Wavelet Disadvantages:** The biggest drawback is the loss of price precision. The Open, Close, High, and Low values on a Wavelet candle are calculated, not real. You **cannot** place Stop Loss orders or enter trades based on these levels, as the actual market price might be in a completely different place than the smoothed candle suggests. They also introduce lag, which depends on the chosen wavelet—whereas a standard candle reacts instantly.
###2. Wavelet Candles vs. Heikin AshiThese are close cousins, but they share very different "DNA." Both methods aim to smooth the trend, but they achieve it differently.
**Differences and Philosophy:**
Heikin Ashi (HA) is based on a simple recursive arithmetic average. The current HA candle depends on the previous one, making it react linearly.
The Wavelet Candle uses **convolution**. This means the shape of the current candle depends on a "window" (group) of past candles multiplied by weights (Gaussian curve, Daubechies, etc.). This results in a more "organic" and elastic reaction.
* **Wavelet Advantages:** Wavelets are highly customizable. With Heikin Ashi, you are stuck with one algorithm. With Wavelet Candles, you can change the kernel to "Haar" for a fast (boxy) reaction or "Morlet" for an ultra-smooth, wave-like effect. Wavelets handle the separation of market cycles better than simple HA averaging, which can generate many false color flips during consolidation.
* **Wavelet Disadvantages:** They are computationally much more complex and harder to understand intuitively ("Why is this candle red if the price is going up?"). In strong, vertical breakouts (pumps), Heikin Ashi often "chases" the price faster, whereas deep wavelet decomposition (High Level) may show more inertia and change color more slowly.
###3. Wavelet Candles vs. RenkoThis compares two different dimensions: Time vs. Price.
**Differences and Philosophy:**
Renko completely ignores time. A new brick is formed only when the price moves by a specific amount. If the market stands still for 5 hours, nothing happens on a Renko chart.
The Wavelet Candle is **time-synchronous**. If the market stands still for 5 hours, the Wavelet algorithm will draw a series of flat, small candles (the "wavelet decays").
* **Wavelet Advantages:** They preserve the context of time, which is crucial for traders who consider trading sessions (London/New York) or macroeconomic data releases. On a wavelet chart, you can see when volatility drops (candles become small), whereas Renko hides periods of stagnation, which can be misleading for options traders or intraday strategies.
* **Wavelet Disadvantages:** In sideways trends (chop), Wavelet Candles—despite the smoothing—will still draw a "snake" that flips colors (unless you set a very high decomposition level). Renko can remain perfectly clean and static during the same period, not drawing any new bricks, which for many traders is the ultimate filter against overtrading in a flat market.
###Summary**Wavelet Candles** are a tool for the analyst who wants to visualize the **structure of the wave and market cycle**, accepting some lag in exchange for noise reduction, but without giving up the time axis (like in Renko) or relying on simple averaging (like in Heikin Ashi). It serves best as a "roadmap" for the trend rather than a "sniper scope" for precise entries.

Hybrid Strategy: Trend/ORB/MTFHybrid Strategy: Trend + ORB + Multi-Timeframe Matrix
This script is a comprehensive "Trading Manager" designed to filter out noise and identify high-probability breakout setups. It combines three powerful concepts into a single, clean chart interface: Trend Alignment, Opening Range Breakout (ORB), and Multi-Timeframe (MTF) Analysis.
It is designed to prevent "analysis paralysis" by providing a unified Dashboard that confirms if the trend is aligned across 5 different timeframes before you take a trade.
How it Works
The strategy relies on the "Golden Trio" of confluence:
1. Trend Definition (The Setup) Before looking for entries, the script analyzes the immediate trend. A bullish trend is defined as:
Price is above the Session VWAP.
The fast EMA (9) is above the slow EMA (21). (The inverse applies for bearish trends).
2. The Signal (The Trigger) The script draws the Opening Range (default: first 15 minutes of the session).
Buy Signal: Price breaks above the Opening Range High while the Trend is Bullish.
Sell Signal: Price breaks below the Opening Range Low while the Trend is Bearish.
3. The Confirmation (The Filter) A signal is only valid if the Higher Timeframe (default: 60m) agrees with the direction. If the 1m chart says "Buy" but the 60m chart is bearish, the signal is filtered out to prevent false breakouts.
Key Features
The Matrix Dashboard A zero-lag, real-time table in the corner of your screen that monitors 5 user-defined timeframes (e.g., 5m, 15m, 30m, 60m, 4H).
Trend: Checks if Price > EMA 21.
VWAP: Checks if Price > VWAP.
ORB: Checks if Price is currently above/below the Opening Range of that session.
D H/L: Warns if price is near the Daily High or Low.
PD H/L: Warns if price is near the Previous Daily High or Low.
Visual Order Blocks The script automatically identifies valid Order Blocks (sequences of consecutive candles followed by a strong explosive move).
Chart: Draws Green/Red zones extending to the right, showing where price may react.
Dashboard: Displays the exact High, Low, and Average price of the most recent Order Blocks for precision planning.
Risk Management (Trailing Stop) Once a trade is active, the script plots Chandelier Exit dots (ATR-based trailing stop) to help you manage the trade and lock in profits during trend runs.
Visual Guide (Chart Legend)
⬜ Gray Box: Represents the Opening Range (first 15 minutes). This is your "No Trade Zone." Wait for price to break out of this box.
🟢 Green Line: The Opening Range High. A break above this line signals potential Bullish momentum.
🔴 Red Line: The Opening Range Low. A break below this line signals potential Bearish momentum.
🟢 Green / 🔴 Red Zones (Boxes): These are Order Blocks.
🟢 Green Zone: A Bullish Order Block (Demand). Expect price to potentially bounce up from here.
🔴 Red Zone: A Bearish Order Block (Supply). Expect price to potentially reject down from here.
⚪ Dots (Trailing Stop):
🟢 Green Dots: These appear below price during a Bullish trend. They represent your suggested Stop Loss.
🔴 Red Dots: These appear above price during a Bearish trend.
🏷️ Buy / Sell Labels:
BUY: Triggers when Price breaks the Green Line + Trend is Bullish + HTF is Bullish.
SELL: Triggers when Price breaks the Red Line + Trend is Bearish + HTF is Bearish.
Settings
Session: Customizable RTH (Regular Trading Hours) to filter out pre-market noise.
Matrix Timeframes: 5 fixed slots to choose which timeframes you want to monitor.
Order Blocks: Adjust the sensitivity and lookback period for Order Block detection.
Risk: Customize the ATR multiplier for the trailing stop.
Disclaimer
This tool is for educational purposes only. Past performance does not guarantee future results. Always manage your risk properly.


Credit Spreads Swing TradingCredit Spreads Swing Trading
Summary
Credit Spreads Swing Trading is a decision-support indicator designed to identify higher-probability put credit spread (PCS) and call credit spread (CCS) opportunities using trend alignment, momentum shifts, and volatility-aware structure.
The indicator works on any ticker and any timeframe, and includes multiple built-in ticker presets that automatically adjust internal parameters. While it will generate signals on all charts, the on-chart table displays a recommended context to indicate when the current symbol, timeframe, and session conditions match the optimized configuration.
Core Signal Logic
Signals are generated when multiple conditions align:
Momentum shift-
Identifies directional momentum changes that often precede short-term swing continuation.
Trend confirmation-
Ensures trades align with the prevailing trend and avoids counter-trend entries.
Higher-timeframe bias
Incorporates Daily and 4-Hour EMA structure to bias trades in the dominant market direction.
Relative volume filter-
Confirms participation to reduce low-quality signals during thin or inactive periods.
Cooldown logic
Enforces spacing between signals to prevent clustering and over-trading.
Credit Spread Direction & Structure
PCS (Put Credit Spread) signals are generated in neutral to bullish conditions
CCS (Call Credit Spread) signals are generated in neutral to bearish conditions
When a signal triggers, the script calculates a recommended short strike using recent pivot structure and displays it visually on the chart. This level is intended as a reference point for structuring a credit spread, not as an execution instruction.
On-Chart Table (Informational)
The indicator includes a compact table that displays:
Current signal type (PCS or CCS)
Recommended sell-leg strike
Average spacing between historical signals
How often prior sell-legs were crossed before the next signal (visual reference only)
Recommended context status
The recommended context row indicates whether the chart matches the optimized setup:
1-Hour timeframe
Extended hours enabled
Selected ticker preset matches the chart symbol (unless set to Auto)
This recommendation is informational only. Signals are not blocked when the chart does not match the recommended context.
Ticker Presets & Flexibility
Users can select from multiple built-in ticker presets (or Auto), which adjust internal parameters such as:
Momentum sensitivity
Volatility handling
Trend responsiveness
This allows the indicator to adapt to different instruments while maintaining a consistent signal framework.
Important Notes
This indicator does not place trades and does not include automated backtesting or performance reporting.
All statistics and visual markers are for manual review and contextual analysis only.
Signals are intended for experienced traders who understand options risk, assignment risk, and proper position sizing.
Intended Use
Credit Spreads Swing Trading is intended as a research and decision-support tool for traders who sell option premium and want structured, rules-based signals aligned with trend, momentum, and volume.
It should be used alongside independent analysis and disciplined risk management.

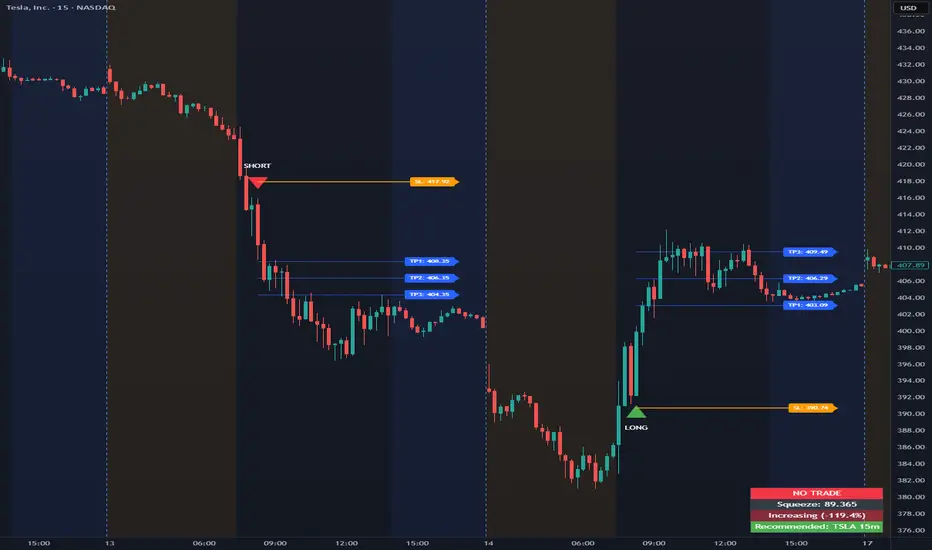
Opening Range Intraday IndicatorOpening Range Intraday Indicator
Summary
The Opening Range Intraday Indicator is a decision-support tool for intraday breakout entries. It combines an Opening Range Breakout (ORB) model with relative volume confirmation and a squeeze-style trend filter, then visualizes entries with clearly defined take-profit (TP) and stop-loss (SL) levels.
The indicator works on any ticker and any timeframe. However, its default parameters and internal logic are optimized for TSLA on the 15-minute chart, which is shown as a recommended context in the on-chart table for informational purposes only.
Core Logic
Opening Range Breakout
Establishes an opening range during the early session and monitors for confirmed breakouts above or below that range to generate potential intraday entries.
Relative Volume confirmation
Breakouts are validated using relative volume to help ensure participation and reduce low-quality signals during thin or inactive periods.
Squeeze / trend filter
A squeeze-style metric evaluates recent compression and directional behavior, helping to avoid entries during unfavorable or low-quality structural conditions.
Entry Visualization & Risk Levels
When a valid entry is confirmed, the indicator automatically:
Plots directional entry markers
Calculates and draws multiple take-profit levels
Draws a stop-loss level based on opening-range structure or ATR logic
Marks TP or SL hits directly on the chart for visual review
These visuals persist on the chart to allow traders to manually review trade structure and outcome over time.
On-Chart Table & Context Guidance
The indicator includes a compact on-chart table that displays:
Current squeeze value and short-term trend behavior
“No trade” conditions when structure is unfavorable
A recommended context message indicating whether the chart matches the optimized setup (TSLA on the 15-minute timeframe)
This message is informational only and does not restrict signals or functionality on other symbols or timeframes.
Flexibility & Controls
Users can customize:
Take-profit and stop-loss display behavior
Tight or standard stop-loss logic
Quiet windows near session close to suppress alerts
Visual settings and table positioning
This allows the indicator to be adapted to different instruments, volatility profiles, and execution styles.
Important Notes
This indicator does not execute trades and does not include automated backtesting or performance statistics.
TP/SL markers are visual aids only and are intended for manual review, not statistical validation.
Results will vary by symbol, timeframe, execution, and market conditions.
This indicator is intended as a research and decision-support tool for experienced intraday traders who understand execution risk, volatility, and position sizing. It should be used alongside proper risk management and independent analysis.
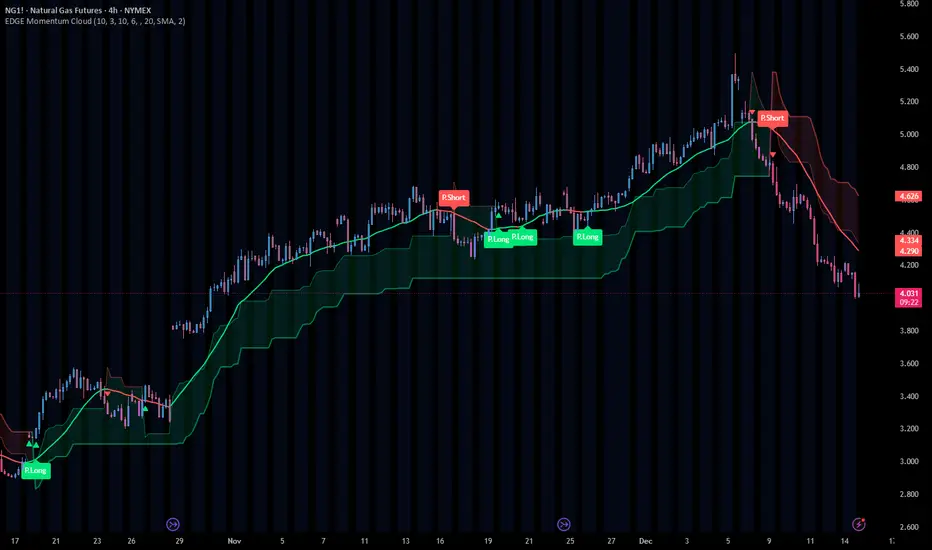
EDGE Momentum Cloud═════════════════════════════════════════════════════════════
EDGE MOMENTUM CLOUD
═════════════════════════════════════════════════════════════
█ OVERVIEW
The EDGE Momentum Cloud is a confluence-based trading system that combines adaptive volatility zones with trend direction analysis to identify high-probability trade setups. Rather than relying on a single indicator, this tool creates a visual "momentum zone" that helps traders understand the current market regime while filtering signals through trend confirmation.
The indicator generates two tiers of signals:
• Standard Signals — Based on trend direction changes
• Premium Signals — Require additional confluence with momentum zone positioning
Premium signals represent higher-conviction setups where multiple factors align.
█ HOW IT WORKS
The EDGE Momentum Cloud combines two core components working together:
❶ MOMENTUM ZONE (CLOUD)
Two ATR-based trailing bands create a dynamic volatility envelope
❷ TREND FILTER
A customizable moving average determines trend direction
❸ SIGNAL ENGINE
Evaluates confluence between trend changes and zone positioning
█ THE MOMENTUM ZONE EXPLAINED
At the core of this indicator are two ATR-based trailing bands that form the "momentum zone":
INNER BAND (FAST)
• Tighter trailing stop using a smaller ATR multiplier (default: 3.0×)
• Reacts quickly to price changes
• Defines the near-term momentum boundary
OUTER BAND (SLOW)
• Wider trailing stop using a larger ATR multiplier (default: 6.0×)
• Provides a more forgiving boundary
• Represents the broader momentum envelope
The space between these bands creates the Momentum Zone —a visual cloud that expands during volatile conditions and contracts during consolidation.
ZONE COLOR INTERPRETATION:
• Green Zone = Bullish bias (bands trailing below price)
• Red Zone = Bearish bias (bands trailing above price)
█ THE TREND FILTER EXPLAINED
A customizable moving average acts as the trend direction filter. When the trend line changes direction (turns up or down), the indicator evaluates whether conditions support a trade signal.
The trend filter supports 13 different calculation methods , allowing you to match the indicator's responsiveness to your trading style:
SMA • EMA • WMA • HMA • VWMA • RMA • LSMA
TMA • DEMA • TEMA • DWMA • SSMA • MEDIAN
Direction is determined by comparing the current value to a previous value (controlled by Direction Smoothing). Higher smoothing values reduce noise and false direction changes.
█ SIGNAL LOGIC
┌────────────────────────────────────────────────────────────
│ STANDARD SIGNALS
├────────────────────────────────────────────────────────────
│ These trigger when the trend filter changes direction:
│
│ LONG — Trend filter turns from falling to rising
│ SHORT — Trend filter turns from rising to falling
│
│ Standard signals indicate a potential trend change but
│ do not require zone confluence.
└────────────────────────────────────────────────────────────
┌────────────────────────────────────────────────────────────
│ PREMIUM SIGNALS
├────────────────────────────────────────────────────────────
│ These require confluence between trend change AND
│ favorable positioning relative to the momentum zone:
│
│ PREMIUM LONG
│ • Trend turns up while filter is ABOVE the zone, OR
│ • Price breaks into/out of zone during recent bullish trigger
│
│ PREMIUM SHORT
│ • Trend turns down while filter is BELOW the zone, OR
│ • Price breaks into/out of zone during recent bearish trigger
│
│ Premium signals have built-in confluence and typically
│ offer better risk/reward setups.
└────────────────────────────────────────────────────────────
█ VISUAL ELEMENTS
ZONE COMPONENTS
• Inner Band — Fast trailing stop (thin line)
• Outer Band — Slow trailing stop (thick line)
• Zone Fill — Shaded area between bands showing momentum regime
TREND COMPONENTS
• Trend Line — Moving average with slope-based coloring
• Green = Rising trend
• Red = Falling trend
• Purple = Neutral (if color by direction disabled)
SIGNAL MARKERS
• Triangle Up + "Long" — Standard long signal
• Triangle Down + "Short" — Standard short signal
• Label Up + "P.Long" — Premium long signal
• Label Down + "P.Short" — Premium short signal
CROSS MARKERS
• Small triangles appear when price crosses the inner or outer bands
• Up triangles = Price crossing above band
• Down triangles = Price crossing below band
BAR COLORING
• Teal bars = Price above the zone (bullish territory)
• Pink bars = Price below the zone (bearish territory)
• Purple bars = Price inside the zone (transitional)
█ CONFIGURABLE SETTINGS
┌────────────────────────────────────────────────────────────
│ GENERAL SETTINGS
├────────────────────────────────────────────────────────────
│ Confirmed Signals Only (Default: ON)
│ • When enabled, signals wait for bar close before triggering
│ • Prevents repainting on live bars
│ • Recommended: Keep ON for live trading
│
│ Display Standard Signals (Default: ON)
│ • Show/hide basic trend-change signals
│
│ Display Premium Signals (Default: ON)
│ • Show/hide confluence-based signals
│
│ Tint Price Bars (Default: ON)
│ • Color bars based on position relative to zone
└────────────────────────────────────────────────────────────
┌────────────────────────────────────────────────────────────
│ MOMENTUM ZONE SETTINGS
├────────────────────────────────────────────────────────────
│ Fast ATR Length (Default: 10)
│ • Lookback period for inner band's ATR calculation
│ • Lower = More reactive to recent volatility
│ • Higher = Smoother, less reactive
│
│ Fast Band Factor (Default: 3.0)
│ • Multiplier for inner band distance from price
│ • Lower = Tighter band, more signals
│ • Higher = Wider band, fewer signals
│
│ Slow ATR Length (Default: 10)
│ • Lookback period for outer band's ATR calculation
│
│ Slow Band Factor (Default: 6.0)
│ • Multiplier for outer band distance from price
│ • Should be larger than Fast Band Factor
│ • Creates the width of the momentum zone
└────────────────────────────────────────────────────────────
┌────────────────────────────────────────────────────────────
│ TREND FILTER SETTINGS
├────────────────────────────────────────────────────────────
│ Display Trend Line (Default: ON)
│ • Show/hide the moving average line
│
│ Resolution (Default: Chart Timeframe)
│ • Timeframe for MA calculation
│ • Leave blank to use current chart timeframe
│ • Set higher timeframe for broader trend alignment
│
│ Lookback Period (Default: 20)
│ • Moving average period length
│ • Lower = Faster, more signals
│ • Higher = Slower, fewer signals
│
│ Calculation Method (Default: SMA)
│ • Choose from 13 MA types
│ • HMA and TEMA are faster/more responsive
│ • SMA and TMA are slower/smoother
│
│ Direction Smoothing (Default: 2)
│ • Bars to look back for slope comparison
│ • Higher values reduce false direction changes
│ • Range: 1-10
│
│ Color By Direction (Default: ON)
│ • Color the trend line based on its slope
└────────────────────────────────────────────────────────────
┌────────────────────────────────────────────────────────────
│ VISUAL SETTINGS
├────────────────────────────────────────────────────────────
│ Bullish Color — Color for bullish elements (default: green)
│ Bearish Color — Color for bearish elements (default: red)
│ Neutral Color — Color for neutral/transitional states
│ Zone Fill — Opacity for the momentum zone fill
└────────────────────────────────────────────────────────────
█ ALERTS
This indicator includes five configurable alerts:
① STANDARD LONG
Triggers on basic bullish trend change signal
② STANDARD SHORT
Triggers on basic bearish trend change signal
③ PREMIUM LONG
Triggers on high-confluence bullish signal
④ PREMIUM SHORT
Triggers on high-confluence bearish signal
⑤ ANY SIGNAL
Triggers on any of the above conditions
To enable alerts:
1. Right-click on the indicator → "Add Alert"
2. Select the condition you want to be alerted on
3. Configure notification method (popup, email, webhook, etc.)
█ RECOMMENDED USAGE
TIMEFRAME
• Works on any timeframe
• Lower timeframes (1m-15m) generate more signals
• Higher timeframes (1H-Daily) generate fewer, higher-quality signals
BEST PRACTICES
• Keep "Confirmed Signals Only" enabled for live trading
• Premium signals typically offer better risk/reward than Standard
• Use zone position as context—bullish setups above zone, bearish below
• Consider higher timeframe resolution for trend filter to align with broader trend
• Combine with support/resistance or supply/demand for complete trade plans
INTERPRETATION TIPS
• Wide zones suggest increased volatility
• Narrow zones suggest consolidation
• Cross markers at bands can serve as early warnings of regime changes
• Bar colors provide quick visual reference of market position
█ SIGNAL QUALITY GUIDE
┌─────────────────┬────────────────────────────────────────┐
│ HIGHEST QUALITY │ Premium signal + Price clearly │
│ │ positioned on correct side of zone │
├─────────────────┼────────────────────────────────────────┤
│ GOOD QUALITY │ Premium signal + Price inside zone │
├─────────────────┼────────────────────────────────────────┤
│ MODERATE │ Standard signal + Price on correct │
│ │ side of zone │
├─────────────────┼────────────────────────────────────────┤
│ LOWER QUALITY │ Standard signal + Price on wrong │
│ │ side or inside zone │
└─────────────────┴────────────────────────────────────────┘
█ Final Note
This Indicator was designed specifically for the ATR cloud and the levels it provides. The buy and sell signals are a byproduct of development but more of a secondary feature. This product is published so you can take advantage of the proprietary calculations we used to make our own ATR cloud that provides excellent areas of support and resistance.
PLEASE NOTE: The "EDGE MTF ATR Bias Matrix" study that supplies the table notifying you of support and resistance is made through these ATR calculations and would pair perfectly with this study.
█ DISCLAIMER
This indicator is provided for educational and informational purposes only. It is not financial advice and should not be construed as a recommendation to buy or sell any financial instrument.
The signals generated by this indicator are based on technical analysis calculations and do not guarantee any specific outcome. Always conduct your own analysis and use proper risk management.
Daily High/Low Breakout Strategy v2Long and Short trade signal strategy, connects via API key to any exchange, can be used as an indicator. Based on the break of maximum and minimum levels. preferred timeframe 5 minutes.

PFA_PahadiPFA Pahadi Indicator
Market Structure through Swing Triangles
What is the PFA Pahadi Indicator?
The **PFA Pahadi Indicator** is a *price-structure visualization tool* that converts raw market movement into a series of **connected swing triangles**. By linking **Pivot Low → Pivot High → Pivot Low** and additionally connecting the **bases (Low → Low)**, the indicator visually resembles a *mountain (pahadi) range*—hence the name.
It focuses purely on **market structure**, not prediction, helping traders and analysts understand how price is *actually climbing, resting, and declining* over time.
Key Benefits
• Clear Market Structure
The indicator highlights **higher highs, higher lows, lower highs, and lower lows** in a clean, uncluttered way, making trend identification intuitive even on higher timeframes.
• Noise Reduction
By relying only on **confirmed pivots**, minor fluctuations are filtered out. This helps traders avoid reacting to short-term volatility and focus on meaningful swings.
• Visual Trend Strength Assessment
The *slope and shape* of the triangles reveal whether the trend is:
* Expanding (strong trend)
* Contracting (distribution / accumulation)
* Flattening (range / base building)
• Excellent for Positional & Swing Trading
Works particularly well on **weekly and daily charts**, where price structure matters more than intraday noise.
• No Repainting
All lines are drawn only after pivot confirmation. Once plotted, the structure does **not change retroactively**, ensuring analytical integrity.
• Complements Moving Averages & Volume
When combined with long-term averages or volume trends, the PFA Pahadi Indicator helps identify:
* Healthy pullbacks
* Structural breakdowns
* Failed rallies
Practical Use-Cases
• Trend Continuation Analysis
Higher base lines (Low → Low) indicate sustained accumulation and trend continuation.
• Structural Weakness Detection
Flattening or declining bases despite new highs may indicate **distribution** or **trend exhaustion**.
• Long-Term Support Mapping
The connected bases often act as *dynamic structural support zones* rather than exact price levels.
Limitations
• Not a Timing Indicator
The PFA Pahadi Indicator does **not provide entry or exit signals** on its own. It is a *context tool*, not a trigger.
• Lag Due to Confirmation
Because pivots require confirmation, the structure appears **after the move has occurred**. This is intentional for accuracy but unsuitable for scalping.
• Sensitive to Pivot Length Settings
Short pivot lengths may create too many triangles; longer lengths may miss smaller but tradable swings.
• Works Best in Trending Markets
In sideways or choppy conditions, the structure may appear flat and less informative.
Disclaimer
The PFA Pahadi Indicator is a market structure visualization tool and does not constitute investment advice, trading recommendations, or a guarantee of future performance. It is designed for educational and analytical purposes only.
All market decisions should be taken in conjunction with other tools such as volume analysis, risk management rules, broader market context, and individual financial suitability. Past price structures do not ensure future outcomes. Users are advised to validate the indicator across multiple securities and timeframes before applying it in live trading.
Philosophy Behind the Name
Markets don’t move in straight lines. They climb, pause, retrace, and climb again—just like a pahadi path. This indicator simply helps you see that path clearly.

Box Indicator - Auto Draw Previous Day's - High / Midline / LowThis indicator draws a box around the previous day’s high and low, calculates the midline, and displays them on the current day’s chart. It helps visualize key support/resistance levels from the prior trading day.
This script gives you a static reference box from the prior day’s trading range, including a midpoint. It’s useful for spotting potential reversal zones, breakout levels, or intraday targets based on yesterday’s price action.

Dragon Smart Timing (Trend Analysis)Introduction Dragon Smart Timing is a comprehensive "Clean Chart" trading system designed for trend followers who prefer a minimalist workspace. Instead of cluttering your chart with multiple moving averages and noisy signals, this indicator consolidates complex market data into a sleek, real-time Neon Dashboard.
The system identifies high-probability Pullback Entries within a strong trend and includes a built-in Trade Management Assistant to help you decide when to Hold, Take Profit, or Stop Loss.
1. 🛠 How It Works (The 4-Pillar Logic) The system scans for a specific "Confluence" of 4 conditions. An "Entry Now" signal is triggered only when ALL of the following are met:
Trend Filter (The Safety Guard): Price must be ABOVE the EMA 200. This ensures you only trade in the direction of the long-term trend, avoiding counter-trend risks.
Momentum Alignment: Short-term trends must be healthy (EMA 21 > EMA 50 > EMA 100).
Smart Pullback (RSI): RSI (14) must dip into the "Golden Zone" (40 - 55) and bounce upward. We buy the dip, not the top.
Volume Confirmation: Validates the move with a Volume Spike (> 1.5x Average Volume).
2. 🤖 Trade Management Assistant Unlike standard indicators that leave you guessing after the entry, Dragon Smart Timing tracks the trade for you:
🐲 Entry Now: Signal to open a long position.
✊ Holding...: The system recognizes an active trade and monitors price action.
💰 Take Profit: Triggered when the price closes below the EMA 21, signaling momentum weakness.
🛑 Stop Loss: Triggered if the price drops 7% below your entry price to protect capital.
3. 🖥 The Neon Dashboard
Trend: Displays "Strong Up", "Aligned", or "Below EMA200".
RSI / Vol: Shows real-time values without clutter.
Action: The most important row. It lights up in Neon Green (Entry), Orange (Take Profit), or Red (Stop Loss).
⚙️ Settings
Trend Filter: Adjustable EMA 200 (Turn it into EMA 89 or 100 depending on your style).
Dashboard: Fully customizable position (Top/Bottom/Center) and size to fit your screen.
Risk Parameters: Adjustable Stop Loss % and Volume Multipliers.
⚠️ Risk Disclaimer
This script is for educational purposes only and does not constitute financial advice. Trading involves a high degree of risk. Past performance is not indicative of future results.

Session ATR Progression Tracker📊 Session ATR Progression Tracker - SIYL Regression Trading Tool
Track how much of your instrument's 7-day Average True Range (ATR) has been covered during the current trading session. This indicator is specifically designed for regression traders who follow the "Stay In Your Lane" (SIYL) methodology, helping you identify when the probability of mean reversion significantly increases. If you are interested in more on that check out Rod Casselli and tradersdevgroup.com.
🎯 Key Features:
• Real-time ATR Coverage Percentage - See at a glance what percentage of the 7-day ATR has been covered in the current session
• SIYL-Optimized Thresholds - See at a glance when the instrument has achieved 80% and 100% ATR coverage, the proven thresholds where mean reversion probability increases (customizable)
• Flexible Session Modes:
- Daily: Resets at calendar day change
- Session: Uses exchange-defined trading sessions
- Custom Session: Set your exact session start/end times (perfect for futures traders and international markets)
• Visual Alerts - Color-coded display (gray → orange → red) and optional background highlighting
• Repositionable Display - Choose from 9 screen positions to avoid chart clutter
• Session Markers - Green triangles mark the start of each new session
• Detailed Stats - View current range, ATR value, session high/low, and session status
💡 Why Use This Indicator?
This tool is built around a proven concept: regression trading becomes significantly more effective once a session has achieved at least 80% of its 7-day ATR. At this threshold, the probability of price reverting to mean increases substantially, creating higher-probability trade setups for SIYL practitioners.
Benefits for regression traders:
- Identify optimal entry points when mean reversion probability is highest (≥80% ATR coverage)
- Avoid premature regression entries before adequate range has been established
- Recognize when daily moves have "earned their range" and are ripe for reversal
- Time fade-the-move and counter-trend strategies with statistical backing
- Improve win rates by trading only after proven probability thresholds are met
⚙️ Setup Instructions:
1. Add the indicator to your chart
2. Select your preferred "Reset Mode" (recommend "Custom Session" for futures/international markets)
3. If using Custom Session, enter your session times in 24-hour format (e.g., 0930-1600 for US stocks, 1700-1600 for CME futures)
4. Adjust alert thresholds if desired (default: 80% and 100% - proven SIYL thresholds)
5. Position the display where it's most visible on your chart
📈 Works Across All Markets:
Stocks • Futures • Forex • Indices • Crypto • Commodities
Perfect for regression traders, mean reversion specialists, and SIYL practitioners who want to trade with probability on their side by entering only after the session has "earned its range."
---
Tip: For futures contracts with overnight sessions that span calendar days (like MES, MNQ, MYM), use "Custom Session" mode with your exchange's official session times for accurate tracking.

[AlscapeLabs] HTF Candle Stack (Multi-Timeframe)
Overview
The HTF Candle Stack (Multi-TF) indicator is a powerful visualization tool designed to overlay high-timeframe (HTF) price action directly onto your current chart, independent of the chart's price scale. This gives traders a clear, aligned, and non-overlapping view of simultaneous price movements across customizable timeframes.
By stacking the candles horizontally next to the chart's price action, the indicator allows for quick identification of multi-timeframe correlation, trend confluence, and key levels without switching chart timeframes.
Key Features
6 Independent Stacks: Configure up to 6 separate timeframes (e.g., 5m, 15m, 1H, 4H, Daily, Weekly) to view the complete market fractals from micro to macro.
Price-Aligned Visualization : All HTF candle stacks are perfectly aligned with the main chart's vertical price axis
Replay Mode Safe : Includes dedicated logic to prevent "duplicate candles" during Bar Replay, ensuring accurate backtesting and historical analysis.
Toggleable Stacks : Each stack can be individually enabled or disabled via input settings
Dynamic Spacing : The distance between active stacks is automatically calculated and adjusted based on the visibility of the preceding stack.
Settings Guide
Stack Configuration (1 - 6)
Each of the six stacks has identical controls:
Show/Hide : Enable or disable this specific stack.
Timeframe : The specific HTF to display (e.g., "60" for 1 Hour, "D" for Daily).
[*} Count : How many candles to show in this stack (Current Active Candle + Past Closed Candles). Tip: Use higher counts (10-12) for lower TFs (Stack 1-2) and lower counts (2-4) for higher TFs (Stack 5-6)
Candle Color
Controls global coloring
Bullish / Bearish : Customize the body colors.
Wick : Separate control for wick color and transparency
Layout
Distance from Chart : How far (in bars) to the right the first stack begins
Space between Stacks : The gap (in bars) between each active stack.
Candle Width : The thickness of the HTF candles.
Labels
Displays a time-frame next to the active (live) candle in each stack
Show TF Labels : Enable or disable labels through all stacks
Text Color : Label text color
Background : Label background color
Style : Label position (Left, Down)
Size : Label text size (Tiny, Small, Normal, Large, Huge)
Developed by AlscapeLabs

X-Trend Macro Command CenterX-Trend Macro Command Center (MCC) | Institutional Grade Dashboard
📝 Description Body
The Invisible Engine of the Market Revealed.
Traders often focus solely on Price Action, ignoring the massive underwater currents that actually drive trends: Global Liquidity, Inflation, and Central Bank Policy. We created X-Trend Macro Command Center (MCC) to solve this problem.
This is not just an indicator. It is a fundamental heads-up display that bridges the gap between technical charts and macroeconomic reality.
💡 The Idea & Philosophy
Markets don't move in a vacuum. Bull runs are fueled by M2 Money Supply expansion and negative real yields. Crashes are triggered by liquidity crunches and aggressive rate hikes. X-Trend MCC was built to give retail traders the same "Macro Awareness" that institutional desks possess. It aggregates fragmented economic data from Federal Reserve databases (FRED) directly onto your chart in real-time.
🚀 Application & Logic
This tool is designed for Trend Traders, Crypto Investors, and Macro Analysts.
Identify the Regime: Instantly see if the environment is "RISK ON" (High Liquidity, Low Real Rates) or "RISK OFF" (Monetary Tightening).
Validate the Trend: Don't buy the dip if Liquidity (M2) is crashing. Don't short the rally if Real Yields are negative.
Multi-Region Analysis: Switch instantly between economic powerhouses (US, China, Japan) to see where the capital is flowing.
📊 Dashboard Metrics Explained
Every row in the Command Center tells a specific story about the economy:
Interest Rate: The "Gravity" of finance. Higher rates weigh down risk assets (Stocks/Crypto).
Inflation (YoY): The erosion of purchasing power. We calculate this dynamically based on CPI data.
Real Yield (The "Golden" Metric): Calculated as Interest Rate - Inflation.
Green: Real Yield is low/negative. Cash is trash, assets fly.
Red: Real Yield is high. Cash is King, assets struggle.
US Debt & GDP: Fiscal health indicators formatted in Trillions ($T). Watch the Debt-to-GDP ratio—if it spikes >120%, expect currency debasement.
M2 Money Supply: The fuel tank of the market. Tracks the total amount of money in circulation.
↗ Trend: Liquidity is entering the system (Bullish).
↘ Trend: Liquidity is drying up (Bearish).
🧩 The X-Trend Ecosystem
X-Trend MCC is just the tip of the iceberg. This module is part of the larger X-Trend Project — a comprehensive suite of algorithmic tools being developed to quantify market chaos. While our Price Action algorithms (Lite/Pro/Ultra) handle the Micro, the MCC handles the Macro.
Technical Note:
Data Sources: Direct connection to FRED (Federal Reserve Economic Data).
Zero Repainting: Historical data is requested strictly using closed bars to ensure accuracy.
Open Source: We believe in transparency. The code is open for study under MPL 2.0.
Build by Dev0880 | X-Trend © 2025

Pivot Trend [ChartPrime]The Pivot Trend indicator is a tool designed to identify potential trend reversals based on pivot points in the price action. It helps traders spot shifts in market sentiment and anticipate changes in price direction.
◈ User Inputs:
Left Bars: Specifies the number of bars to the left of the current bar to consider when calculating pivot points.
Right Bars: Specifies the number of bars to the right of the current bar to consider when calculating pivot points.
Offset: Adjusts the sensitivity of pivot point detection.
◈ Indicator Calculation:
The indicator calculates pivot points based on the highest and lowest prices within a specified range of bars. It then determines the trend direction based on whether the current price crossed above upper band or crossed below lower band.
Upper and Lower Bands
◈ Visualization:
Trend direction is indicated by the color of the plotted lines, with blue representing an upward trend and red representing a downward trend.
Buy and sell signals are marked on the chart with corresponding symbols (🅑 for buy signals and 🅢 for sell signals).
Buy and sell signals generated by the indicator can be used in conjunction with other technical analysis tools to confirm trading decisions and manage risk.
Overall, the Pivot Trend indicator offers traders a simple yet effective method for identifying potential trend changes and capturing trading opportunities in the market. Adjusting the input parameters allows for customization according to individual trading preferences and market conditions.

Trend Prediction Meter [PointAlgo]The Trend Prediction Meter & Levels is a composite market-bias and volatility visualization tool designed to summarize trend strength, momentum, price positioning, and volatility into a single normalized score.
It provides a structured framework to interpret directional bias and probable price expansion zones during active market conditions.
Concept Overview
Markets often reflect multiple conditions simultaneously—trend direction, momentum strength, price location within a range, and volatility.
This indicator combines these elements into a unified Bullish Score (0–100), displayed as a meter and supported by projected ATR-based levels.
Rather than focusing on a single signal, the script aims to present context about current market conditions.
Bullish Score Composition (0–100)
The meter represents a weighted blend of multiple market factors:
1. Trend Strength (EMA Structure)
Uses a fast and slow EMA to assess directional bias.
The distance between EMAs is normalized into a trend strength score.
Strong separation indicates directional conviction; compression suggests balance.
2. Momentum Strength (RSI Blend)
Combines a short-term and mid-term RSI.
Helps capture both immediate momentum and broader directional stability.
Higher readings indicate sustained bullish pressure, lower readings indicate bearish pressure.
3. Position Within Recent Range
Measures where price is trading relative to its recent high–low range.
Values near the top of the range reflect strength; values near the bottom reflect weakness.
Mid-range positioning indicates equilibrium.
4. Volume Participation
Compares current volume against its recent average.
Acts as a minor confidence modifier rather than a primary driver.
Each component is normalized and combined using fixed weights to produce a final Bullish Score between 0 and 100.
Bias Classification
The Bullish Score is translated into descriptive market states:
Extreme Bullish
Very Bullish
Bullish
Neutral
Bearish
Very Bearish
These labels describe current bias, not future certainty.
Meter Visualization
The meter plot dynamically changes color based on the score range.
A dashed midline at 50 represents balance.
Background shading highlights strong bullish or bearish dominance zones.
Crossovers of the 50-level indicate shifts in directional control.
ATR-Based Projection Levels:
To provide volatility context, the indicator calculates ATR-based upside and downside reference levels:
Two potential expansion levels (TP1 and TP2) are projected above and below price.
The distance of these levels adapts based on current bias strength.
These levels are contextual reference zones, not fixed targets.
Prediction Dashboard
An optional side table summarizes key readings at the most recent bar:
Symbol
Current bias label
Bullish Score
Current price
ATR value
Upside and downside projection levels
Directional comment (Upside favoured / Downside favoured / Balanced)
This dashboard is designed to provide a quick structural overview without requiring manual calculation.
Signals & Alerts
Built-in alerts are available for:
Bullish bias conditions
Bearish bias conditions
Bullish Score crossing above 50
Bullish Score crossing below 50
Alerts are informational and reflect internal state changes only.
Customization:
Users can adjust:
RSI lengths
EMA lengths
Range lookback period
ATR parameters
Display options for the meter and dashboard
This allows adaptation across different instruments and timeframes.
Usage Notes
Best suited for analytical interpretation rather than standalone decision-making.
Designed to complement price action, structure, or other indicators.
Works across multiple markets where volume and volatility data are available.
Disclaimer :
This indicator is intended for educational and analytical purposes only.
It does not provide investment, trading, or financial advice.
All signals and levels should be validated with independent analysis and appropriate risk management.

Put Call Relative StrengthPut–Call Relative Strength (PE/CE RS)
Description
Put–Call Relative Strength compares the premium movement of a Put Option (PE) against a Call Option (CE) to detect bearish pressure in the market.
It uses the ratio:
RS = PE / CE – 1
If Puts gain strength faster than Calls, RS turns positive — indicating bearish dominance.
A moving average line helps you understand trend strength and filter noise.
This is an ideal tool for traders wanting a clear, fast view of downside momentum and Put-led trend shifts.
How to Use
1️⃣ Select PE and CE Symbols
In settings → manually enter:
Put Option (PE)
Call Option (CE)
Same strike + same expiry recommended.
2️⃣ Interpret RS
RS > 0 (Green) → Puts stronger → Bearish bias
RS < 0 (Red) → Calls stronger → Bullish bias
3️⃣ Use RS MA to Confirm Trend
RS MA rising (Green) → Bearish strength increasing
RS MA falling (Red) → Bearish strength weakening
RS MA sideways (Gray) → Indecision / range
4️⃣ Best Use Cases
Intraday short setups
PE scalping
Confirmation for breakdowns
Identifying Put-led strength surges
Best for 1m–10m timeframes

Call Put Relative Strength Call–Put Relative Strength compares the premium movement of a selected Call Option (CE) against a selected Put Option (PE) to reveal the underlying market’s bullish strength.
It calculates a clean ratio:
RS = CE / PE – 1
When Calls are gaining strength faster than Puts, the RS turns positive — signaling bullish momentum.
A smoothing moving average adds clarity and filters intraday noise.
This is a powerful tool for intraday traders who want to quickly identify whether buyers or sellers are dominating the market.
How to Use
1) Select CE and PE Symbols
Open indicator settings → manually enter:
Call Option (CE)
Put Option (PE)
Use same strike + same expiry.
2) Interpret RS
RS > 0 (Green) → Calls stronger → Bullish bias
RS < 0 (Red) → Puts stronger → Bearish bias
3) Use RS MA for Trend Confirmation
RS MA rising (Green) → Strength increasing
RS MA falling (Red) → Strength weakening
RS MA flat (Gray) → Market neutral
4) Best Use Cases
Intraday trend confirmation
Scalping CE trades
Avoiding false long entries
Tracking CE/PE rotation strength
Works best on 1m–10m charts

Daily High Breakout Strategy v2Long trade signal strategy, connects via API key to any exchange, can be used as an indicator. Based on breakout, rebound from daily highs.

VR Volume Ratio + Divergence (Pro)成交量比率 (Volume Ratio, VR) 是一項通過分析股價上漲與下跌日的成交量,來研判市場資金氣氛的技術指標。本腳本基於傳統 VR 公式進行了優化,增加了**「趨勢變色」與「自動背離偵測」**功能,幫助交易者更精準地捕捉量價轉折點。
Introduction
Volume Ratio (VR) is a technical indicator that measures the strength of a trend by comparing the volume on up-days versus down-days. This script enhances the classic VR formula with "Trend Color Coding" and "Auto-Divergence Detection", helping traders identify volume-price reversals more accurately.
核心功能與參數
公式原理: VR = (Qu + Qf/2) / (Qd + Qf/2) * 100
Qu: 上漲日成交量 (Up volume)
Qd: 下跌日成交量 (Down volume)
Qf: 平盤日成交量 (Flat volume)
參數 (Length):預設為 26 日,這是市場公認最有效的短中線參數。
關鍵水位線 (Key Levels):
< 40% (底部區):量縮極致,市場情緒冰點,常對應股價底部,適合尋找買點。
100% (中軸):多空分界線。
> 260% (多頭警戒):進入強勢多頭行情,但需注意過熱。
> 450% (頭部區):成交量過大,市場情緒亢奮,通常為頭部訊號。
視覺優化 (Visuals):
紅漲綠跌:當 VR 數值大於前一日顯示為紅色(動能增強);小於前一日顯示為綠色(動能退潮)。
背離訊號 (Divergence):自動標記量價背離。
▲ 底背離 (Bullish):股價創新低,但 VR 指標墊高(主力吸籌)。
▼ 頂背離 (Bearish):股價創新高,但 VR 指標走弱(買氣衰竭)。
Features & Settings
Formula Logic: Calculated as VR = (Qu + Qf/2) / (Qd + Qf/2) * 100.
Default Length: 26, widely regarded as the optimal setting for short-to-medium term analysis.
Key Zones:
< 40% (Oversold/Bottom): Extreme low volume, often indicating a market bottom and potential buying opportunity.
100% (Neutral): The balance point between bulls and bears.
> 260% (Bullish Zone): Strong uptrend, volume is expanding.
> 450% (Overbought/Top): Extreme high volume, often indicating a market top and potential reversal.
Visual Enhancements:
Color Coding: Line turns Red when VR rises (Momentum Up) and Green when VR falls (Momentum Down).
Divergence Signals: Automatically marks divergence points on the chart.
▲ Bullish Divergence: Price makes a lower low, but VR makes a higher low (Accumulation).
▼ Bearish Divergence: Price makes a higher high, but VR makes a lower high (Distribution).
應用策略建議
抄底策略:當 VR 跌破 40% 後,指標線由綠翻紅,或出現「▲底背離」訊號時,為極佳的波段進場點。
逃頂策略:當 VR 衝過 450% 進入高檔區,一旦指標線由紅翻綠,或出現「▼頂背離」訊號時,建議分批獲利了結。
Strategy Guide
Bottom Fishing: Look for entries when VR drops below 40% and turns red, or when a "▲ Bullish Divergence" label appears.
Taking Profit: Consider selling when VR exceeds 450% and turns green, or when a "▼ Bearish Divergence" label appears.
Disclaimer: This tool is for informational purposes only and does not constitute financial advice. / 本腳本僅供參考,不構成投資建議。
