Liquidity Levels Pro Tool - thewallranka
Liquidity Levels Pro Tool is a market-structure and liquidity-mapping indicator designed to help discretionary futures and index traders identify statistically relevant price levels where reactions, continuations, or liquidity sweeps are more likely to occur.
This script is a decision-support tool, not a signal generator. It does not issue buy/sell alerts or predict future price movement. Instead, it organizes and scores liquidity information so traders can make their own contextual decisions.
What this indicator does
The script continuously detects and maintains liquidity zones derived from price pivots, then evaluates those zones using multiple structural and contextual factors:
Repeated price interaction (touches)
Freshness (time since last interaction)
Confluence with key reference levels
Reaction behavior after contact
Session relevance (RTH vs overnight)
Market regime (trend vs mean reversion)
Time-of-day effects (open, midday, power hour)
Only the most relevant zones—based on a dynamic scoring system—are displayed to reduce chart clutter and focus attention on levels that have historically mattered.
Core components
1. Liquidity Zones
Zones are built from pivot highs and lows and expanded into areas using a configurable tick-based padding. Nearby zones are merged to avoid redundancy.
Each zone is continuously evaluated and assigned a score (0–100) reflecting its relative importance.
2. Zone Scoring (No Lookahead)
Zone scores are based on:
Number of confirmed interactions
Recency of the last touch
Confluence with prior day/week levels, VWAP, and Opening Range
Reaction quality after touches (speed and follow-through)
Session alignment (zones that “work” in the current session are favored)
Penalties after liquidity sweeps
Zones are not forward-looking and do not rely on future data.
3. Context Engine
The script classifies the current environment using VWAP slope and distance:
Trend (up or down)
Mean reversion
Mixed/transition
Time-of-day context (Open, Midday, Power Hour) is also tracked internally and influences zone scoring.
This context is displayed in the HUD to support situational awareness, not automated decisions.
4. Liquidity Sweeps
Optional sweep detection highlights situations where price trades beyond a zone and closes back inside, indicating potential stop runs or failed breakouts.
Sweeps are rate-limited and applied conservatively to avoid visual noise.
5. Trade Planning Levels (Optional)
When enabled, the script highlights the nearest high-quality liquidity level above and below price based on score thresholds.
These are intended as reference targets, not trade entries or exits.
HUD (Heads-Up Display)
The on-chart HUD summarizes:
Key reference levels (prior day/week, Opening Range)
Nearest strong liquidity above/below price
Market regime and time-of-day context
Distance to levels (ticks or points)
The HUD is fully optional, positionable, and includes resizable modes (Small / Medium / Large) to fit different chart layouts.
How to use this tool
This indicator is best used as part of a discretionary trading process, for example:
Identifying areas where price is more likely to react or pause
Framing trades around higher-quality structure instead of arbitrary levels
Filtering setups based on session and regime context
Managing expectations near known liquidity rather than chasing price
It is intentionally designed not to provide trade signals.
Limitations and important notes
This script does not predict outcomes or guarantee reactions
High-scoring zones can still fail
Liquidity behavior is context-dependent and probabilistic
No performance claims or backtested results are provided
The indicator should not be used in isolation
Past behavior does not imply future results.
Chart and usage notes
The script is intended for standard time-based charts
Recommended for liquid futures and index products
Use a clean chart for clarity when publishing or sharing
No external indicators are required
Final note
Liquidity Levels Pro (Tool) — v6 is designed to organize complex market structure into a clear, readable framework, allowing traders to focus on execution and risk management rather than raw level detection.
This script reflects an analytical approach to intraday liquidity and structure, not an automated trading system.
Análise de Tendência

Estrategia Momentum Seguro (EMS) Entry and exit signals, this indicator helps or suggests where to enter, exit, or place a stop loss.

MACD Signals - TradeMaster (Trend & Momentum Filter) 中文簡介
設計理念: 此指標是為了將經典的 MACD 策略「可視化」並「優化」而設計。傳統 MACD 在盤整震盪期容易出現頻繁的黃金交叉(假訊號),導致虧損。本腳本透過整合 OBV (能量潮) 與 TTM Squeeze (擠壓動能) 作為趨勢濾網,只有在動能與量能皆配合的情況下,才會標示為「✅ 有效金叉」。
核心功能與邏輯:
主圖純淨模式 (Clean Overlay):不顯示雜亂的 MACD 線圖,直接在 K 棒上下方標示買賣訊號,保持圖表乾淨。
MAM 濾網機制 (Smart Filtering):
OBV 趨勢:確認資金流向是否支持價格上漲。
動能擠壓 (Squeeze):結合 Bollinger Bands 與 Keltner Channels,避開無方向的盤整區間。
訊號分類:
✅ 有效金叉 (Valid Buy):MACD 金叉 + 通過 MAM 濾網偵測(高勝率 setup)。
❌ 無效金叉 (Fake Buy):MACD 金叉,但動能不足或處於盤整(建議觀望)。
🔻 死叉出場 (Sell):MACD 死叉,提示波段獲利了結或停損。
如何使用:
當出現 綠色標籤 (✅有效) 時,代表趨勢與動能共振,為潛在進場點。
當出現 灰色標籤 (❌無效) 時,代表僅是指標交叉但缺乏動能,建議忽略或謹慎操作。
當出現 紅色標籤 (🔻出場) 時,代表動能轉弱,建議離場。
English Description
Concept: This script is designed to visualize and optimize the classic MACD strategy directly on your main chart. Traditional MACD often generates false signals during consolidation periods. This indicator integrates OBV (On-Balance Volume) and Squeeze Momentum as a trend filter. It only marks a signal as a "✅ Valid Buy" when both momentum and volume confirm the trend.
Key Features & Logic:
Clean Main Chart Overlay: Instead of occupying a bottom pane with lines, this script plots actionable signals directly on the candlesticks, keeping your workspace clean.
MAM Filter Mechanism:
OBV Trend: Confirms if volume flow supports the price action.
Momentum Squeeze: Combines Bollinger Bands and Keltner Channels to filter out choppy, sideways markets.
Signal Classification:
✅ Valid Buy: MACD Golden Cross + Confirmed by MAM Filter (High probability setup).
❌ Fake Buy: MACD Golden Cross without momentum confirmation (Weak signal, usually ignored).
🔻 Sell Signal: MACD Death Cross, suggesting an exit.
How to Use:
Green Label (✅ Valid): Trend and momentum are in resonance. Potential entry.
Gray Label (❌ Fake): Crossover occurred but failed the filter test. Caution advised.
Red Label (🔻 Exit): Momentum is weakening. Suggested exit point.
免責聲明 (Disclaimer)
免責聲明
本腳本僅供教育與技術分析研究使用,不構成任何形式的金融投資建議。
過去的績效不代表未來的表現。
所有的交易訊號僅供參考,使用者應結合自身的風險管理策略(如停損設置)。
作者不對使用此腳本造成的任何盈虧負責。
Disclaimer
This script is for educational and technical analysis purposes only and does not constitute financial advice.
Past performance is not indicative of future results.
All signals are for reference only. Users should always apply their own risk management strategies (e.g., Stop Loss).
The author is not responsible for any trading losses incurred from using this script.

Smart Money Swing Strategy [All-in-One]# Pro Swing Trader 📈
A comprehensive swing trading indicator for TradingView that combines multiple confluence factors to identify high-probability trade setups with built-in risk management.
## 🎯 Overview
This indicator is designed for swing traders who want to catch momentum pullbacks with precision entries. It filters trades using multiple timeframe analysis, RSI zones, volume confirmation, and EMA trends to deliver only the highest-confidence setups.
### Key Features
✅ **Multi-Timeframe Confluence** - Confirms trades with higher timeframe analysis (Daily, 4H, etc.)
✅ **Smart Entry Signals** - Detects pullback-to-EMA reclaim patterns
✅ **Automatic Risk Management** - Calculates stops, targets, and R-multiples
✅ **Dynamic Stop Loss** - ATR trailing stop + break-even automation
✅ **Real-Time HUD Dashboard** - Live confluence scoring and trade metrics
✅ **Comprehensive Alerts** - Entry, TP1, TP2, and stop-loss notifications
✅ **Visual Trade Levels** - Clear on-chart stop-loss and take-profit lines
---
## 📊 How It Works
### Signal Logic
The indicator identifies two types of signals:
**Base Signals** (Small triangles):
- Price pulls back between Fast EMA and Slow EMA
- RSI is in the swing zone (40-60 by default)
- Price reclaims the Fast EMA with momentum
- Optional: Volume spike confirmation
**High-Confidence Signals** (Large triangles):
- All base signal criteria met
- Higher timeframe confirms the trend direction
- HTF RSI and slope alignment
- These are your primary trade signals
### Entry Conditions
#### Long Entry (🟢 HC L)
1. Fast EMA > Slow EMA (uptrend)
2. Previous candle closed between the EMAs (pullback)
3. Current candle crosses above and closes above Fast EMA (reclaim)
4. RSI between 40-60 (swing zone)
5. **HTF Confirmation**: Daily/4H price above EMA50, RSI > 50, positive slope
6. Optional: Volume > 1.5x 20-bar average
#### Short Entry (🔻 HC S)
1. Fast EMA < Slow EMA (downtrend)
2. Previous candle closed between the EMAs (pullback)
3. Current candle crosses below and closes below Fast EMA (reclaim)
4. RSI between 40-60 (swing zone)
5. **HTF Confirmation**: Daily/4H price below EMA50, RSI < 50, negative slope
6. Optional: Volume > 1.5x 20-bar average
---
## 🎛️ Settings & Parameters
### Trend Parameters
- **Fast EMA**: Default 20 - Quick trend detection
- **Slow EMA**: Default 50 - Major trend filter
- **Swing Lookback**: Default 10 - Bars to find swing high/low for stops
### RSI Settings
- **RSI Length**: Default 14
- **RSI Min**: Default 40 - Lower bound of swing zone
- **RSI Max**: Default 60 - Upper bound of swing zone
### Risk Management
- **Final TP Risk-Reward (R)**: Default 2.0 - Main profit target multiplier
- **TP1 R Multiple**: Default 1.0 - Partial profit target
- **Use Break-even Stop**: Move stop to entry after 1R profit
- **ATR Trailing Stop**: Dynamic stop based on ATR(14) x 2.0
### Filters
- **Require Volume Spike**: Optional volume confirmation filter
- **Use Higher TF Confirmation**: Enable multi-timeframe analysis
- **Higher TF**: Default "D" (Daily) - Can use 240 (4H), W (Weekly), etc.
---
## 📈 Dashboard (HUD)
The top-center dashboard shows real-time confluence status:
| Column | Meaning |
|--------|---------|
| **Trend** | Current trend direction (UP/DOWN/Flat) |
| **HTF** | Higher timeframe alignment (Bull/Bear/Flat) |
| **RSI Zone** | Is RSI in swing zone? (YES/NO) |
| **Volume** | Volume spike detected? (YES/NO) |
| **Signal** | Active signal type (HC LONG/HC SHORT/None) |
| **R Risk** | Current profit in R-multiples |
| **Stop** | Current stop-loss level |
| **TP1** | Partial take-profit status |
| **TP2** | Final take-profit status |
| **Conf %** | Overall confluence score (0-100%) |
### Confidence Score Breakdown
- **20%** - Trend present (up or down)
- **30%** - HTF confirmation aligned (or 15% if HTF off)
- **20%** - RSI in swing zone
- **10%** - Volume spike
- **20%** - High-confidence signal triggered
**Scoring**:
- 🟢 70%+ = High probability setup
- 🟡 40-69% = Moderate setup
- 🔴 <40% = Low probability
---
## 🔔 Alert Setup
The indicator includes 8 alert conditions:
### Entry Alerts
- **HC LONG ENTRY** - High-confidence long signal triggered
- **HC SHORT ENTRY** - High-confidence short signal triggered
### Profit Target Alerts
- **LONG TP1 Reached** - Hit partial profit (1R by default)
- **LONG Final TP Reached** - Hit final target (2R by default)
- **SHORT TP1 Reached** - Hit partial profit
- **SHORT Final TP Reached** - Hit final target
### Stop Loss Alerts
- **LONG Stop/BE/Trail Level Hit** - Long position stopped out
- **SHORT Stop/BE/Trail Level Hit** - Short position stopped out
### How to Set Up Alerts
1. Click "Add Alert" on TradingView
2. Choose this indicator from the dropdown
3. Select desired alert condition
4. Set alert to trigger "Once Per Bar Close"
5. Customize notification method (popup/email/webhook)
---
## 📋 Trading Workflow
### 1. Wait for High-Confidence Signal
Look for the large **HC L** or **HC S** triangle on chart close.
### 2. Verify Confluence
Check the HUD dashboard:
- Confidence score should be 70%+
- HTF status should show alignment
- RSI Zone should be "YES"
### 3. Entry
Enter the trade at market or on next candle open.
### 4. Set Stop Loss
Use the **initial stop** shown in the HUD (red line on chart):
- **Longs**: Below the swing low (10-bar lookback)
- **Shorts**: Above the swing high (10-bar lookback)
### 5. Set Take Profits
- **TP1**: 1R (50% position close) - Yellow line
- **TP2**: 2R (remaining 50% close) - Green line
### 6. Manage the Trade
- Monitor the **R Risk** column to track profit
- Stop moves to break-even automatically after 1R (if enabled)
- ATR trailing stop engages dynamically (red line adjusts)
- Exit if price hits dynamic stop level
---
## 🎨 Visual Guide
### On-Chart Elements
**Triangles**:
- Small lime/red triangles = Base signals (lower confidence)
- Large lime/red triangles = High-confidence signals (trade these!)
**Lines**:
- 🟢 Green line = Fast EMA (20)
- 🟠 Orange line = Slow EMA (50)
- 🔴 Red line = Dynamic stop-loss level
- 🟡 Yellow line = TP1 level
- 🟢 Green line = TP2 (final target)
**HUD Colors**:
- 🟢 Green = Bullish/Active/Good
- 🔴 Red = Bearish/Inactive/Warning
- 🟡 Yellow = Neutral/Caution
- 🔵 Blue = Informational
- ⚫ Gray = Disabled/Off
---
## 💡 Strategy Tips
### Best Practices
1. **Only trade High-Confidence signals** - Ignore base signals unless very experienced
2. **Respect the HTF** - Don't fight the higher timeframe trend
3. **Use proper position sizing** - Risk 1-2% of account per trade
4. **Partial profits work** - Take 50% off at TP1, let rest run to TP2
5. **Let winners run** - Trailing stop helps capture extended moves
6. **Be patient** - Quality over quantity; wait for 70%+ confluence
### Optimal Timeframes
- **Primary Chart**: 1H, 4H, Daily (swing trading)
- **HTF Setting**: One level higher than your chart
- If trading 1H → Set HTF to 4H or D
- If trading 4H → Set HTF to D or W
- If trading Daily → Set HTF to W
### Market Conditions
**Best Performance**:
- Trending markets with healthy pullbacks
- Clear support/resistance zones
- Moderate volatility
**Avoid Trading**:
- Extremely choppy/sideways markets
- Major news events (unless experienced)
- Low confidence scores (<40%)
---
## ⚙️ Advanced Customization
### Aggressive Setup (More Signals)
```
Fast EMA: 12
Slow EMA: 26
RSI Min: 35
RSI Max: 65
Use HTF Confirmation: OFF
Require Volume Spike: OFF
```
### Conservative Setup (Fewer, Higher Quality)
```
Fast EMA: 20
Slow EMA: 50
RSI Min: 45
RSI Max: 55
Use HTF Confirmation: ON
Require Volume Spike: ON
Final TP R: 3.0
```
### Scalping Adaptation (Not Recommended)
```
Fast EMA: 9
Slow EMA: 21
Swing Lookback: 5
TP1 R: 0.5
Final TP R: 1.0
```
---
## ⚠️ Risk Disclaimer
**IMPORTANT**: This indicator is for educational and informational purposes only.
- Past performance does not guarantee future results
- No indicator is 100% accurate
- Always use proper risk management
- Never risk more than you can afford to lose
- Consider using a demo account first
- Seek professional financial advice if needed
Trading involves substantial risk of loss and is not suitable for all investors.
---
## 🔧 Troubleshooting
### "No signals appearing"
- Check if HTF confirmation is enabled but market isn't aligned
- Verify RSI zone isn't too restrictive
- Ensure volume spike isn't filtering out all setups
- Try adjusting EMA lengths for your asset
### "Too many false signals"
- Enable HTF confirmation
- Tighten RSI zone (e.g., 45-55)
- Enable volume spike requirement
- Only trade 70%+ confidence setups
### "Stops too tight/wide"
- Adjust Swing Lookback length
- Modify ATR multiplier for trailing stop
- Consider the asset's volatility
### "Alerts not working"
- Ensure alert is set to "Once Per Bar Close"
- Check indicator is added to the chart
- Verify TradingView notification settings
---
## 📚 Version History
**v1.0 (Current)**
- Initial release
- Multi-timeframe confluence system
- Dynamic risk management
- Real-time HUD dashboard
- Comprehensive alert system
- ATR trailing stops
- Break-even automation
---
## 🤝 Support & Feedback
If you find this indicator helpful:
- ⭐ Star the script on TradingView
- 💬 Share your results and feedback
- 🐛 Report bugs or suggest improvements
- 📖 Share with other traders
---
## 📖 Additional Resources
### Recommended Reading
- "The New Trading for a Living" by Dr. Alexander Elder
- "Swing Trading Using Multiple Timeframes" - Educational articles
- Risk management and position sizing guides
### Learn More About
- Multiple timeframe analysis
- EMA crossover strategies
- RSI divergence and zones
- ATR-based stops
- R-multiple profit management
---
## 📝 License
This indicator is provided as-is for personal trading use.
**Usage Rights**:
- ✅ Use for personal trading
- ✅ Modify for personal use
- ❌ Resell or redistribute
- ❌ Claim as original work
---
## 🎓 Quick Start Checklist
- Add indicator to TradingView chart
- Set your preferred timeframe (1H/4H/Daily)
- Configure HTF setting (one level higher)
- Review default parameters
- Set up entry alerts (HC LONG/SHORT)
- Set up TP and SL alerts
- Test on historical data
- Paper trade first
- Start with small position sizes
- Track your results
---
**Happy Trading! 📊💰**
*Remember: Discipline, patience, and risk management are the keys to long-term success.*

Wisenode QuantThis indicator uses a combination of DMI, ADX and ATR% to give quick easy visual representation of trend strength, trend direction and price action volatility.
This helps to quickly visually identify market environment for trade execution using quantifiable data.
Direction
Red LED = Bearish Market conditions
Green LED = Bullish Market conditions
Trend (Strength)
Red = 0-20 on the ADX (Ranging)
Green = 20-30 on the ADX (Emerging)
Green = 30-50 on the ADX (Momentum)
Volatility
Uses ATR% on a dynamic scale from top to bottom is low to high intensity. Colour will transition from green to red as the bar moves higher.
Trade Execution
Integration of a custom Murray math values to build entry, stop loss protection and take profit zones.
This is still a working progress to fine tune default settings but can be used for market environment identification for any sort of discretionary trading

Hitjo Swing IndicatorTL;DR – READ THIS FIRST
This is a TWO-INDICATOR SYSTEM. Both indicators must be used together.
Hitjo Zones TF = WHERE you are allowed to trade
Hitjo Swing Trend = WHEN you are allowed to trade
Rules:
Only take BUY signals from Hitjo Swing Trend inside DEMAND zones from Hitjo Zones TF
Only take SELL signals from Hitjo Swing Trend inside SUPPLY zones from Hitjo Zones TF
Ignore signals when structure and timing do not align
Recommended setup: 1H chart with 4H or Daily zones.
Hitjo Swing Trading System
(Hitjo Zones TF + Hitjo Swing Trend)
This TradingView system combines higher-timeframe Supply & Demand zones with momentum-based swing entries to create a clean, rule-based swing trading framework.
It is designed for traders who want fewer but higher-quality trades, clear market structure, objective entry timing, and reduced overtrading.
Required Indicators
Hitjo Zones TF (Structure)
Automatically draws Supply & Demand zones using a selectable higher timeframe.
Displays SUPPLY and DEMAND labels when price enters key zones.
Defines where trades are allowed.
Do not trade based on zones alone.
Hitjo Swing Trend (Timing)
Displays BUY and SELL labels using EMA structure, momentum, and higher-timeframe trend.
Plots ATR-based stop loss and target levels.
Defines when to enter trades.
Do not take BUY or SELL signals outside zones.
Core Concept
Hitjo Zones TF tells you WHERE to trade.
Hitjo Swing Trend tells you WHEN to trade.
If both are not aligned, there is no trade.
Trading Rules
Long Trades
Take a BUY only when all conditions are true:
Price is inside or just above a DEMAND zone from Hitjo Zones TF
Higher-timeframe trend is bullish
A BUY label appears from Hitjo Swing Trend
There is room to target without immediately hitting resistance
Short Trades
Take a SELL only when all conditions are true:
Price is inside or just below a SUPPLY zone from Hitjo Zones TF
Higher-timeframe trend is bearish
A SELL label appears from Hitjo Swing Trend
There is room to target without immediately hitting support
Common Mistakes to Avoid
Buying just because DEMAND appears
Selling just because SUPPLY appears
Taking BUY or SELL signals in the middle of the chart
Counter-trend trading
Forcing trades on every signal
Stops and Targets
Hitjo Swing Trend plots:
Stop Loss using ATR (red)
Target using ATR (green)
These are visual guides only, not broker orders.
Recommended Setup
Chart timeframe: 1H
Zone timeframe (Hitjo Zones TF): 4H or Daily
Fast / Slow EMA: 8 / 21
ATR Stop / Target: 1.5 / 3.0
Remember This
DEMAND does not mean BUY
SUPPLY does not mean SELL
DEMAND + BUY = Long
SUPPLY + SELL = Short
Disclaimer
This system does not predict tops or bottoms and does not guarantee profits.
It is designed to help traders wait for alignment, reduce low-quality trades, and trade with structure.
Always manage risk appropriately.
TradingView Search Keywords
Supply Demand
Swing Trading
EMA Strategy
Multi Timeframe
Trend Following
Support Resistance
Momentum Trading
ATR Stop Loss
Crypto Trading
Stock Trading

Hitjo Zones TFTL;DR – READ THIS FIRST
This is a TWO-INDICATOR SYSTEM. Both indicators must be used together.
Hitjo Zones TF = WHERE you are allowed to trade
Hitjo Swing Trend = WHEN you are allowed to trade
Rules:
Only take BUY signals from Hitjo Swing Trend inside DEMAND zones from Hitjo Zones TF
Only take SELL signals from Hitjo Swing Trend inside SUPPLY zones from Hitjo Zones TF
Ignore signals when structure and timing do not align
Recommended setup: 1H chart with 4H or Daily zones.
Hitjo Swing Trading System
(Hitjo Zones TF + Hitjo Swing Trend)
This TradingView system combines higher-timeframe Supply & Demand zones with momentum-based swing entries to create a clean, rule-based swing trading framework.
It is designed for traders who want fewer but higher-quality trades, clear market structure, objective entry timing, and reduced overtrading.
Required Indicators
Hitjo Zones TF (Structure)
Automatically draws Supply & Demand zones using a selectable higher timeframe.
Displays SUPPLY and DEMAND labels when price enters key zones.
Defines where trades are allowed.
Do not trade based on zones alone.
Hitjo Swing Trend (Timing)
Displays BUY and SELL labels using EMA structure, momentum, and higher-timeframe trend.
Plots ATR-based stop loss and target levels.
Defines when to enter trades.
Do not take BUY or SELL signals outside zones.
Core Concept
Hitjo Zones TF tells you WHERE to trade.
Hitjo Swing Trend tells you WHEN to trade.
If both are not aligned, there is no trade.
Trading Rules
Long Trades
Take a BUY only when all conditions are true:
Price is inside or just above a DEMAND zone from Hitjo Zones TF
Higher-timeframe trend is bullish
A BUY label appears from Hitjo Swing Trend
There is room to target without immediately hitting resistance
Short Trades
Take a SELL only when all conditions are true:
Price is inside or just below a SUPPLY zone from Hitjo Zones TF
Higher-timeframe trend is bearish
A SELL label appears from Hitjo Swing Trend
There is room to target without immediately hitting support
Common Mistakes to Avoid
Buying just because DEMAND appears
Selling just because SUPPLY appears
Taking BUY or SELL signals in the middle of the chart
Counter-trend trading
Forcing trades on every signal
Stops and Targets
Hitjo Swing Trend plots:
Stop Loss using ATR (red)
Target using ATR (green)
These are visual guides only, not broker orders.
Recommended Setup
Chart timeframe: 1H
Zone timeframe (Hitjo Zones TF): 4H or Daily
Fast / Slow EMA: 8 / 21
ATR Stop / Target: 1.5 / 3.0
Remember This
DEMAND does not mean BUY
SUPPLY does not mean SELL
DEMAND + BUY = Long
SUPPLY + SELL = Short
Disclaimer
This system does not predict tops or bottoms and does not guarantee profits.
It is designed to help traders wait for alignment, reduce low-quality trades, and trade with structure.
Always manage risk appropriately.
TradingView Search Keywords
Supply Demand
Swing Trading
EMA Strategy
Multi Timeframe
Trend Following
Support Resistance
Momentum Trading
ATR Stop Loss
Crypto Trading
Stock Trading

Tailwind.(BTC)Imagine the price of Bitcoin is like a person climbing a staircase.
The Steps (Grid): Instead of watching every single price movement, the strategy divides the market into fixed steps. In your configuration, each step measures **3,000 points**. (Examples: 60,000, 63,000, 66,000...).
The Signal: We buy only when the price climbs a full step decisively.
The "Expensive Price" Filter: If the price jumps the step but lands too far away (the candle closes too high), we do not buy. It is like trying to board a train that has already started moving too fast; the risk is too high.
Rigid Exits: The Take Profit (TP) and Stop Loss (SL) are calculated from the edge of the step, not from the specific price where you managed to buy. This preserves the geometric structure of the market.
The Code Logic (Step-by-Step)
A. The Math of the Grid (`math.floor`)
pinescript
level_base = math.floor(close / step_size) * step_size
This is the most important line.
What does it do? It rounds the price down to the nearest multiple of 3,000.
Example: If BTC is at 64,500 and the step size is 3,000:
1. Divide: $64,500 / 3,000 = 21.5$
2. `math.floor` (Floor): Removes the decimals $\rightarrow$ remains $21$.
3. Multiply: $21 * 3,000 = 63,000$.
Result: The code knows that the current "floor" is **63,000**, regardless of whether the price is at 63,001 or 65,999.
B. The Strict Breakout (`strict_cross`)
pinescript
strict_cross = (open < level_base) and (close > level_base)
Most strategies only check if `close > level`. We do things slightly differently:
`open < level_base`: Requires the candle to have "born" *below* the line (e.g., opened at 62,900).
`close > level_base`: Requires the candle to have *finished* above the line (e.g., closed at 63,200).
Why? This avoids entering on gaps (price jumps where the market opens already very high) and confirms that there was real buying power crossing the line.
C. The "Expensive Price" Filter (`max_dist_pct`)
pinescript
limit_price_entry = level_base + (step_size * (max_dist_pct / 100.0))
price_is_valid = close <= limit_price_entry
Here you apply the percentage rule:
-If the level is 63,000 and the next is 66,000 (a difference of 3,000).
-If `max_dist_pct` is **60%**, the limit is $63,000 + (60\% \text{ of } 3,000) = 64,800$.
-If the breakout candle closes at **65,000**, the variable `price_is_valid` will be **false** and it will not enter the trade. This avoids buying at the ceiling.
D. TP and SL Calculation (Anchored to the Level)
pinescript
take_profit = level_base + (step_size * tp_mult)
stop_loss = level_base - (step_size * sl_mult)
Note that we use `level_base` and not `close`.
-If you entered because the price broke 63,000, your SL is calculated starting from 63,000.
-If your SL is 1.0x, your stop will be exactly at 60,000.
This is crucial: If you bought "expensive" (e.g., at 63,500), your real stop is wider (3,500 points) than if you bought cheap (63,100). Because you filter out expensive entries, you protect your Risk/Reward ratio.
E. Visual Management (`var line`)
The code uses `var` variables to remember the TP and SL lines and the `line.set_x2` function to stretch them to the right while the operation remains open, providing that visual reference on the chart until the trade ends.
Workflow Summary
Strategy Parameters:
Total Capital: $20,000
We will use 10% of total capital per trade.
Commissions: 0.1% per trade.
TP: 1.4
SL: 1
Step Size (Grid): 3,000
We use the 200 EMA as a trend filter.
Feel free to experiment with the parameters to your liking. Cheers.

Trend FilterTrend Filter
Summary
Trend Filter is a multi-factor trend-confidence indicator that produces a simple, actionable output: Direction (Up / Down / Ranging) and a normalized Confidence %. It is intended as a decision-support overlay to help traders quickly identify whether a market is trending or rangebound, and how strong that directional bias is.
What it shows
A single line in the on-chart table: Direction (Up / Down / Ranging).
A Confidence % (0–100) that combines multiple normalized market signals into a single score.
Optional notification row when a manually-selected reference timeframe does not match the chart timeframe.
Alert conditions when direction changes to Up, Down, or Ranging.
How the indicator works (concise, non-proprietary explanation)
Trend Filter computes a weighted confidence score from several complementary components, each normalized to a 0–100 scale and combined into a single confidence value. The components and their roles are:
EMA structure & spread (trend breadth)
-Uses three EMAs (fast / mid / slow) computed at lengths that scale with the selected/reference timeframe. The EMA spread (fast vs slow) quantifies directional separation.
HH/HL structure and streaks (price structure)
-Counts higher highs/higher lows (and the reverse) across a scaled lookback to measure whether price structure is predominantly bullish, bearish or mixed.
EMA slope (momentum of trend)
-A robust slope approximation (smoothed) measures whether the short EMA is rising/falling relative to its own smoothed history.
ADX / DMI (trend strength)
-Uses a standard ADX-style component to capture directional persistence and dampen the confidence score when the ADX is weak.
ATR (volatility context)
-ATR expressed as a percentage of price helps detect abnormal volatility regimes which affect the validity of trend signals.
Volume context
-Simple volume vs a short SMA gives a participation signal that increases confidence when moves occur with higher volume.
Each component is capped to avoid outsized influence. Components are scaled by a set of weights (configurable in code) and then combined. The final confidence is lightly smoothed before being used to determine direction and to feed alert conditions.
Important implementation & safety design choices (why it’s not a simple mashup)
Adaptive timeframe scaling: EMA lengths and lookbacks are proportionally scaled based on the chosen reference timeframe (Auto or manual). This preserves relative indicator behavior across 1-minute → Daily timeframes without manual retuning of each parameter.
HH/HL structure plus streaks: Instead of relying solely on moving averages or ADX, the script explicitly measures price structure (HH/HL counts and streaks) and blends that with slope/ADX. This reduces false trending signals on noisy price action.
Normalized, weighted combination with caps: Each component is normalized (0–100) and combined by predefined weights; cap thresholds prevent extreme component values from dominating the result. This is a design intended to produce interpretable confidence % rather than opaque binary outputs.
History and loop safety: The code enforces a cap and protects loop lengths against available historical bars to avoid runtime errors and to ensure the script remains stable on short data series.
Practical guardrails: The script includes notification behavior to highlight manual timeframe mismatches and avoids dynamic indexing patterns that can cause unreliable results on small bar histories.
These design decisions — adaptive scaling, structural HH/HL scoring, capped normalization and explicit safety limits — are the elements that distinguish Trend Filter from simple, single-indicator overlays (EMA-only, ADX-only, etc.) and form the basis for why closed-source protection is reasonable for commercial/invite-only publication.
User controls & recommended usage
Reference Timeframe: Auto (uses chart TF) or choose a manual reference TF (1min → D). When manual TF is selected, the table shows a mismatch warning if the chart TF differs.
Table placement & colors: Positioning and appearance of the on-chart table are configurable.
Confidence thresholds: The indicator uses internal thresholds to mark high/medium/low confidence. Users can interpret the Confidence % relative to those ranges.
Alerts: Built-in alerts fire only on direction changes (to Up, Down, or Ranging). Use alerts as a signal to review the chart rather than an instruction to trade automatically.
How traders typically use it
Add Trend Filter as an overlay to your chart.
Confirm that the recommended reference timeframe is appropriate (Auto will adjust automatically).
Use Direction and Confidence % together: high Confidence + Up (or Down) suggests staying with trend; Ranging suggests avoiding trend-following entries.
Combine this filter with your entry/exit rules (price structure, support/resistance, or your preferred signal generator).
Disclaimers & limitations
This is a decision-support indicator, not an automated execution strategy. It does not place orders and does not provide P/L or backtesting statistics.
Confidence % is an aggregated measure — treat it as context, not a guarantee.
Results vary across symbols and timeframes; use appropriate position sizing and risk controls.
The code intentionally includes history and loop safeguards; on very short histories the indicator may display conservative results.

Heikin Ashi + Real Price OverlayHeikin-Ashi + Real Price Overlay
This indicator combines the smooth trend visualization of Heikin-Ashi candles with the true market price for precise execution.
Features:
Heikin-Ashi Candles: Provides a clear, smoothed view of market trends and momentum.
Real Close Price Overlay: Plots the actual closing price as a line on top of HA candles, ensuring accurate entry, exit, and stop placement.
Trend-Based Coloring: The real price line is colored according to HA trend (green for bullish, red for bearish), making trend bias instantly visible.
Lightweight and ideal for scalping, day trading, or any strategy where trend bias + exact price matters.
Use Case:
Use HA candles to identify market bias and momentum.
Use the real price line for precise entries, exits, and stop levels.
Perfect for traders who want the clarity of HA without sacrificing real price accuracy.

Live Ichimoku BOXThis indicator offers a unique "Visual" approach to the Ichimoku Kinko Hyo system. Instead of just plotting lines, it visualizes the mathematical logic behind the Tenkan-sen (9), Kijun-sen (26), and Span B (52) in real-time.
Core Concept: Ichimoku lines represent the equilibrium (50% level) of the High-Low range over a specific period. This tool draws Equilibrium Boxes to show exactly where these Highs and Lows are located relative to the current price.
Key Features:
Live Equilibrium Boxes: Visualizes the 9, 26, and 52-period ranges on the current live candle.
Mid-Lines: Clearly marks the equilibrium points (Tenkan, Kijun, Span B) within each box.
Vector Lines: Diagonal lines connecting the High and Low of each box to visualize momentum direction.
Fractals & Signals: Marks major pivots with Stars (*) and secondary pivots with Arrows.
Time Counters: Displays the candle count from the pivot to the current bar.
Future & Past: Visualizes the Chikou Span (lagging) and Future Cloud levels (leading) using dash lines.
Split-Color Background: distinct transparency for the upper and lower halves of the boxes for better trend identification.
How to Use: Use this tool to understand the market structure behind the Ichimoku lines. If the price is above the box's mid-line, the trend is bullish for that period. Aligned mid-lines indicate strong support/resistance levels.
این اندیکاتور یک دیدگاه کاملاً جدید و "بصری" (Visual) به سیستم ایچیموکو کینکو هیو (Ichimoku Kinko Hyo) ارائه میدهد. برخلاف اندیکاتورهای کلاسیک که فقط خطوط را رسم میکنند، این ابزار منطق محاسباتی پشت خطوط تنکانسن (۹)، کیجونسن (۲۶) و اسپن بی (۵۲) را در لحظه حال (Live) به تصویر میکشد.
فلسفه عملکرد: در ایچیموکو، خطوط بر اساس میانگینِ بالاترین قیمت (High) و پایینترین قیمت (Low) در یک دوره خاص محاسبه میشوند. این اندیکاتور با رسم باکسهای تعادلی (Equilibrium Boxes)، دقیقاً نشان میدهد که این سقف و کفها کجا هستند و قیمت در حال حاضر نسبت به "ناحیه تعادل" (۵۰٪ باکس) چه وضعیتی دارد.
ویژگیهای کلیدی:
🟥 باکسهای ۹، ۲۶ و ۵۲ دوره: نمایش محدوده نوسان قیمت در دورههای زمانی استاندارد ایچیموکو بر روی کندل زنده.
➖ خطوط میانی (Mid-Lines): نمایش دقیق محل تنکانسن، کیجونسن و اسپن بی به صورت خطوط دش یا ضخیم در وسط باکسها.
📐 بردارهای حرکتی (Vectors): رسم خطوط مورب داخل باکس که جهت و شتاب حرکت از High به Low (یا برعکس) را نشان میدهند.
✨ نقاط چرخش (Pivots): نمایش سقفها و کفهای ماژور با علامت ستاره (*) و نقاط برگشت فرعی با فلش (Arrows).
🔢 شمارشگر زمانی: نمایش تعداد کندلهای گذشته از سقف یا کف باکس تا لحظه حال.
🔮 آینده و گذشته: نمایش وضعیت چیکو اسپن (۲۵ کندل عقبتر) و ابرهای آینده (۲۵ کندل جلوتر) به صورت خطوط راهنما.
🎨 طراحی دو رنگ (Split Color): ناحیه بالای تعادل و پایین تعادل با شفافیتهای متفاوت نمایش داده میشوند تا تشخیص روند صعودی/نزولی در یک نگاه ساده باشد.
نحوه استفاده: این ابزار برای کسانی طراحی شده که میخواهند "چرایی" حرکت قیمت را درک کنند. وقتی قیمت بالای خط میانی باکس قرار دارد، خریداران در آن بازه زمانی کنترل را در دست دارند و برعکس. همپوشانی باکسها و خطوط میانی، نواحی قدرتمند حمایت و مقاومت را نشان میدهد.

Buy Sell Signal (Improved Simple)Buy Sell Signal (Improved Simple) es un indicador mejorado del original

DisruptNEX Edge SystemDisruptNEX Edge System is an analytical overlay indicator designed to visualize market direction, trend maturity, exhaustion conditions, and impulse activity within a single, coherent framework.
The system is built as a structured analytical model rather than a collection of independent tools.
All visual elements are derived from a shared internal reference, ensuring consistency between trend context, exhaustion states, impulse activity, and higher-timeframe structure.
1. Market Regime & Trend Visualization
Illustration 1: Market regime visualization through candle coloring.
At the foundation of the system lies a price-centered baseline, computed as a windowed mid-range estimator with optional adaptive smoothing.
This baseline defines the current market regime:
Price above the baseline represents bullish directional pressure.
Price below the baseline represents bearish directional pressure.
The regime is expressed directly through candle coloring, allowing traders to visually identify the active trend without relying on additional overlays or separate panels.
This regime context acts as the primary reference for all subsequent components of the system.
2. Exhaustion Zones on the Price Chart
Illustration 2: Overbought / Oversold ribbons visualized directly on price.
DisruptNEX Edge System identifies potential exhaustion using a persistence-based evaluation of how consistently price holds above or below a volatility-adjusted reference.
Unlike oscillators displayed in a separate pane, exhaustion is visualized directly on the price chart using bounded ribbons.
Key characteristics of the exhaustion logic:
Overbought and Oversold states are detected as discrete state transitions.
Zones are marked at their initial appearance.
Visual persistence reflects state continuity rather than momentary fluctuations.
This approach helps traders assess when price reaches statistically stretched conditions relative to the active regime, often corresponding to areas where pullbacks or pauses may develop.
3. Candlestick Pattern Context
Illustration 3: Candlestick patterns displayed within the active trend context.
The system includes optional candlestick pattern detection displayed directly on the price chart as contextual information.
Patterns are evaluated relative to the active market regime and are commonly associated with short-term pauses, pullbacks, or localized price reactions within an existing trend.
Patterns are not interpreted as standalone reversal signals and do not provide trade instructions.
Their role is to complement trend context by highlighting moments where traders may choose to observe price behavior more closely.
4. Spark Impulses & Structural Reference Zones
Illustration 4: Spark impulses and dynamic structural reference zones.
Spark impulses highlight moments when directional pressure increases within the active market regime.
They are derived from a volatility-normalized measure of price displacement relative to the internal baseline and evaluated across multiple smoothing horizons.
This allows the system to identify shifts in directional activity rather than isolated price fluctuations.
Spark impulses commonly appear after consolidation, pullbacks, or localized hesitation and act as analytical confirmation that market activity is resuming in a given direction.
Alongside impulse visualization, the system derives dynamic structural reference levels based on recent price behavior and volatility.
These levels are updated only on the most recent bar and represent contextual support and resistance zones.
Structural reference levels are not predictive targets.
They serve as spatial guides, helping traders evaluate price positioning relative to recent structure and impulse activity.
5. Trend Power & Multi-Timeframe HUD
Illustration 5: Right-side HUD summarizing multiple timeframes.
The indicator includes a compact HUD panel that aggregates key structural information across multiple timeframes:
Overbought / Oversold state
Trend Power level
Trend direction
Trend Power quantifies how extended the current regime is by measuring price progression since the last confirmed regime change, normalized by volatility and mapped to a bounded scale.
This allows traders to distinguish between developing, established, and extended trends, while the multi-timeframe layout helps assess alignment between the current chart and higher-level market structure.
How to Read the Indicator
Start by observing candle coloring to identify the active market regime.
Use exhaustion ribbons to recognize areas where price may pause or pull back relative to the regime.
Treat candlestick patterns as contextual signals highlighting potential short-term reactions.
Look for Spark impulses as confirmation of renewed directional activity.
Use structural reference zones as orientation points when evaluating price location.
Consult the HUD to check trend direction, maturity, and exhaustion across higher timeframes.
Alerts & Usage Notes
Alerts are event-based and triggered only on confirmed state changes, including:
Regime transitions
Exhaustion state entries
Candlestick pattern detection
Spark impulse events
Important Notes
DisruptNEX Edge System is not an automated trading system.
It does not execute trades or provide trade instructions.
All outputs are analytical and visual in nature and are intended to support discretionary decision-making.

NY Session Range & FlowNY Session Range & Flow is a rule-based intraday futures indicator designed for the New York session, with a focus on MNQ / NQ price behavior.
This indicator does not predict the market. Instead, it maps context, structure, and flow so traders can make disciplined decisions with predefined risk.
🔍 Core Concepts
NY Session Range & Flow combines:
Session structure
Range usage (ADR / AWR)
VWAP positioning & slope
Liquidity sweeps
Supply & Demand zones
Opening Range Breakouts
Mean reversion vs trend continuation logic
All signals are graded and throttled to reduce noise and overtrading.
📌 What the Indicator Shows
🕒 Session Logic (NY Time)
RTH (09:30–16:00 NY)
Trade windows (AM / PM)
Opening Range (09:30–09:45)
ETH session ranges (for context only)
📊 Range & Regime Awareness
ADR / AWR usage
Identifies expansion vs exhaustion
Helps avoid trading when range is already spent
📉 Flow & Bias
VWAP with optional ATR bands
VWAP slope filter for directional bias
Mean reversion distance rules
🧲 Liquidity & Structure
Prior Day High / Low
NY High / Low / Mid
Opening Range High / Low
Liquidity sweep detection
📦 Supply & Demand Zones
Higher-timeframe pivot-based zones
ATR-adjusted zone thickness
Last active zone tracking
🎯 Signal Types (Graded)
Trend Continuation
Sweep Reversal
Opening Range Breakout (ORB)
Mean Reversion to VWAP
Each signal is scored and graded (A+ → C) based on:
Structure
Liquidity
VWAP alignment
Regime context
Only signals that meet your selected quality threshold are displayed.
⚖️ Risk Visualization
Fixed Stop Loss & Take Profits in ticks
Supports SL + TP1 + TP2
Optional ATR trailing structure
Visual SL/TP lines for clarity (manual execution)
This is a decision-support tool, not an auto-trading system.
📋 Range Usage Table
Displays real-time usage for:
RTH
ETH
Weekly
Monthly ranges
Color-coded to highlight expansion and exhaustion.
⚠️ Important Notes
Designed for manual trading
Best suited for futures traders
Optimized for MNQ / NQ, but adaptable
Not financial advice
🔧 Recommended Use
Combine with strict risk management
One trade at a time
Respect session context and range limits

Wavelet Candle Constructor (Inc. Morlet) 2Here is the detailed description of the **Wavelet Candle** construction principles based on the code provided.
This indicator is not a simple smoothing mechanism (like a Moving Average). It utilizes the **Discrete Wavelet Transform (DWT)**, specifically the Stationary variant (SWT / à Trous Algorithm), to separate "noise" (high frequencies) from the "trend" (low frequencies).
Here is how it works step-by-step:
###1. The Wavelet Kernel (Coefficients)The heart of the algorithm lies in the coefficients (the `h` array in the `get_coeffs` function). Each wavelet type represents a different set of mathematical weights that define how price data is analyzed:
* **Haar:** The simplest wavelet. It acts like a simple average of neighboring candles. It reacts quickly but produces a "boxy" or "jagged" output.
* **Daubechies 4:** An asymmetric wavelet. It is better at detecting sudden trend changes and the fractal structure of the market, though it introduces a slight phase shift.
* **Symlet / Coiflet:** More symmetric than Daubechies. They attempt to minimize lag (phase shift) while maintaining smoothness.
* **Morlet (Gaussian):** Implemented in this code as a Gaussian approximation (bell curve). It provides the smoothest, most "organic" effect, ideal for filtering noise without jagged edges.
###2. The Convolution EngineInstead of a simple average, the code performs a mathematical operation called **convolution**:
For every candle on the chart, the algorithm takes past prices, multiplies them by the Wavelet Kernel weights, and sums them up. This acts as a **digital low-pass filter**—it allows the main price movements to pass through while cutting out the noise.
###3. The "à Trous" Algorithm (Stationary Wavelet Transform)This is the key difference between this indicator and standard data compression.
In a classic wavelet transform, every second data point is usually discarded (downsampling). Here, the **Stationary** approach is used:
* **Level 1:** Convolution every **1** candle.
* **Level 2:** Convolution every **2** candles (skipping one in between).
* **Level 3:** Convolution every **4** candles.
* **Level 4:** Convolution every **8** candles.
Because of this, **we do not lose time resolution**. The Wavelet Candle is drawn exactly where the original candle is, but it represents the trend structure from a broader perspective. The higher the `Decomposition Level`, the deeper the denoising (looking at a wider context).
###4. Independent OHLC ProcessingThe algorithm processes each component of the candle separately:
1. Filters the **Open** series.
2. Filters the **High** series.
3. Filters the **Low** series.
4. Filters the **Close** series.
This results in four smoothed curves: `w_open`, `w_high`, `w_low`, `w_close`.
###5. Geometric Reconstruction (Logic Repair)Since each price series is filtered independently, the mathematics can sometimes lead to physically impossible situations (e.g., the smoothed `Low` being higher than the smoothed `High`).
The code includes a repair section:
```pinescript
real_high = math.max(w_high, w_low)
real_high := math.max(real_high, math.max(w_open, w_close))
// Same logic for Low (math.min)
```
This guarantees that the final Wavelet Candle always has a valid construction: wicks encapsulate the body, and the `High` is strictly the highest point.
---
###Summary of ApplicationThis construction makes the Wavelet Candle an **excellent trend-following tool**.
* If the candle is **green**, it means that after filtering the noise (according to the selected wavelet), the market energy is bullish.
* If it is **red**, the energy is bearish.
* The wicks show volatility that exists within the bounds of the selected decomposition level.
Here is a descriptive comparison of **Wavelet Candles** against other popular chart types. As requested, this is a narrative explanation focusing on the differences in mechanics, interpretation philosophy, and the specific pros and cons of each approach.
---
###1. Wavelet Candles vs. Standard (Japanese) CandlesThis is a clash between "the raw truth" and "mathematical interpretation." Standard Japanese candles display raw market data—exactly what happened on the exchange. Wavelet Candles are a synthetic image created by a signal processor.
**Differences and Philosophy:**
A standard candle is full of emotion and noise. Every single price tick impacts its shape. The Wavelet Candle treats this noise as interference that must be removed to reveal the true energy of the trend. Wavelets decompose the price, reject high frequencies (noise), and reconstruct the candle using only low frequencies (the trend).
* **Wavelet Advantages:** The main advantage is clarity. Where a standard chart shows a series of confusing candles (e.g., a long green one, followed by a short red one, then a doji), the Wavelet Candle often draws a smooth, uniform wave in a single color. This makes it psychologically easier to hold a position and ignore temporary pullbacks.
* **Wavelet Disadvantages:** The biggest drawback is the loss of price precision. The Open, Close, High, and Low values on a Wavelet candle are calculated, not real. You **cannot** place Stop Loss orders or enter trades based on these levels, as the actual market price might be in a completely different place than the smoothed candle suggests. They also introduce lag, which depends on the chosen wavelet—whereas a standard candle reacts instantly.
###2. Wavelet Candles vs. Heikin AshiThese are close cousins, but they share very different "DNA." Both methods aim to smooth the trend, but they achieve it differently.
**Differences and Philosophy:**
Heikin Ashi (HA) is based on a simple recursive arithmetic average. The current HA candle depends on the previous one, making it react linearly.
The Wavelet Candle uses **convolution**. This means the shape of the current candle depends on a "window" (group) of past candles multiplied by weights (Gaussian curve, Daubechies, etc.). This results in a more "organic" and elastic reaction.
* **Wavelet Advantages:** Wavelets are highly customizable. With Heikin Ashi, you are stuck with one algorithm. With Wavelet Candles, you can change the kernel to "Haar" for a fast (boxy) reaction or "Morlet" for an ultra-smooth, wave-like effect. Wavelets handle the separation of market cycles better than simple HA averaging, which can generate many false color flips during consolidation.
* **Wavelet Disadvantages:** They are computationally much more complex and harder to understand intuitively ("Why is this candle red if the price is going up?"). In strong, vertical breakouts (pumps), Heikin Ashi often "chases" the price faster, whereas deep wavelet decomposition (High Level) may show more inertia and change color more slowly.
###3. Wavelet Candles vs. RenkoThis compares two different dimensions: Time vs. Price.
**Differences and Philosophy:**
Renko completely ignores time. A new brick is formed only when the price moves by a specific amount. If the market stands still for 5 hours, nothing happens on a Renko chart.
The Wavelet Candle is **time-synchronous**. If the market stands still for 5 hours, the Wavelet algorithm will draw a series of flat, small candles (the "wavelet decays").
* **Wavelet Advantages:** They preserve the context of time, which is crucial for traders who consider trading sessions (London/New York) or macroeconomic data releases. On a wavelet chart, you can see when volatility drops (candles become small), whereas Renko hides periods of stagnation, which can be misleading for options traders or intraday strategies.
* **Wavelet Disadvantages:** In sideways trends (chop), Wavelet Candles—despite the smoothing—will still draw a "snake" that flips colors (unless you set a very high decomposition level). Renko can remain perfectly clean and static during the same period, not drawing any new bricks, which for many traders is the ultimate filter against overtrading in a flat market.
###Summary**Wavelet Candles** are a tool for the analyst who wants to visualize the **structure of the wave and market cycle**, accepting some lag in exchange for noise reduction, but without giving up the time axis (like in Renko) or relying on simple averaging (like in Heikin Ashi). It serves best as a "roadmap" for the trend rather than a "sniper scope" for precise entries.

Hybrid Strategy: Trend/ORB/MTFHybrid Strategy: Trend + ORB + Multi-Timeframe Matrix
This script is a comprehensive "Trading Manager" designed to filter out noise and identify high-probability breakout setups. It combines three powerful concepts into a single, clean chart interface: Trend Alignment, Opening Range Breakout (ORB), and Multi-Timeframe (MTF) Analysis.
It is designed to prevent "analysis paralysis" by providing a unified Dashboard that confirms if the trend is aligned across 5 different timeframes before you take a trade.
How it Works
The strategy relies on the "Golden Trio" of confluence:
1. Trend Definition (The Setup) Before looking for entries, the script analyzes the immediate trend. A bullish trend is defined as:
Price is above the Session VWAP.
The fast EMA (9) is above the slow EMA (21). (The inverse applies for bearish trends).
2. The Signal (The Trigger) The script draws the Opening Range (default: first 15 minutes of the session).
Buy Signal: Price breaks above the Opening Range High while the Trend is Bullish.
Sell Signal: Price breaks below the Opening Range Low while the Trend is Bearish.
3. The Confirmation (The Filter) A signal is only valid if the Higher Timeframe (default: 60m) agrees with the direction. If the 1m chart says "Buy" but the 60m chart is bearish, the signal is filtered out to prevent false breakouts.
Key Features
The Matrix Dashboard A zero-lag, real-time table in the corner of your screen that monitors 5 user-defined timeframes (e.g., 5m, 15m, 30m, 60m, 4H).
Trend: Checks if Price > EMA 21.
VWAP: Checks if Price > VWAP.
ORB: Checks if Price is currently above/below the Opening Range of that session.
D H/L: Warns if price is near the Daily High or Low.
PD H/L: Warns if price is near the Previous Daily High or Low.
Visual Order Blocks The script automatically identifies valid Order Blocks (sequences of consecutive candles followed by a strong explosive move).
Chart: Draws Green/Red zones extending to the right, showing where price may react.
Dashboard: Displays the exact High, Low, and Average price of the most recent Order Blocks for precision planning.
Risk Management (Trailing Stop) Once a trade is active, the script plots Chandelier Exit dots (ATR-based trailing stop) to help you manage the trade and lock in profits during trend runs.
Visual Guide (Chart Legend)
⬜ Gray Box: Represents the Opening Range (first 15 minutes). This is your "No Trade Zone." Wait for price to break out of this box.
🟢 Green Line: The Opening Range High. A break above this line signals potential Bullish momentum.
🔴 Red Line: The Opening Range Low. A break below this line signals potential Bearish momentum.
🟢 Green / 🔴 Red Zones (Boxes): These are Order Blocks.
🟢 Green Zone: A Bullish Order Block (Demand). Expect price to potentially bounce up from here.
🔴 Red Zone: A Bearish Order Block (Supply). Expect price to potentially reject down from here.
⚪ Dots (Trailing Stop):
🟢 Green Dots: These appear below price during a Bullish trend. They represent your suggested Stop Loss.
🔴 Red Dots: These appear above price during a Bearish trend.
🏷️ Buy / Sell Labels:
BUY: Triggers when Price breaks the Green Line + Trend is Bullish + HTF is Bullish.
SELL: Triggers when Price breaks the Red Line + Trend is Bearish + HTF is Bearish.
Settings
Session: Customizable RTH (Regular Trading Hours) to filter out pre-market noise.
Matrix Timeframes: 5 fixed slots to choose which timeframes you want to monitor.
Order Blocks: Adjust the sensitivity and lookback period for Order Block detection.
Risk: Customize the ATR multiplier for the trailing stop.
Disclaimer
This tool is for educational purposes only. Past performance does not guarantee future results. Always manage your risk properly.


Credit Spreads Swing TradingCredit Spreads Swing Trading
Summary
Credit Spreads Swing Trading is a decision-support indicator designed to identify higher-probability put credit spread (PCS) and call credit spread (CCS) opportunities using trend alignment, momentum shifts, and volatility-aware structure.
The indicator works on any ticker and any timeframe, and includes multiple built-in ticker presets that automatically adjust internal parameters. While it will generate signals on all charts, the on-chart table displays a recommended context to indicate when the current symbol, timeframe, and session conditions match the optimized configuration.
Core Signal Logic
Signals are generated when multiple conditions align:
Momentum shift-
Identifies directional momentum changes that often precede short-term swing continuation.
Trend confirmation-
Ensures trades align with the prevailing trend and avoids counter-trend entries.
Higher-timeframe bias
Incorporates Daily and 4-Hour EMA structure to bias trades in the dominant market direction.
Relative volume filter-
Confirms participation to reduce low-quality signals during thin or inactive periods.
Cooldown logic
Enforces spacing between signals to prevent clustering and over-trading.
Credit Spread Direction & Structure
PCS (Put Credit Spread) signals are generated in neutral to bullish conditions
CCS (Call Credit Spread) signals are generated in neutral to bearish conditions
When a signal triggers, the script calculates a recommended short strike using recent pivot structure and displays it visually on the chart. This level is intended as a reference point for structuring a credit spread, not as an execution instruction.
On-Chart Table (Informational)
The indicator includes a compact table that displays:
Current signal type (PCS or CCS)
Recommended sell-leg strike
Average spacing between historical signals
How often prior sell-legs were crossed before the next signal (visual reference only)
Recommended context status
The recommended context row indicates whether the chart matches the optimized setup:
1-Hour timeframe
Extended hours enabled
Selected ticker preset matches the chart symbol (unless set to Auto)
This recommendation is informational only. Signals are not blocked when the chart does not match the recommended context.
Ticker Presets & Flexibility
Users can select from multiple built-in ticker presets (or Auto), which adjust internal parameters such as:
Momentum sensitivity
Volatility handling
Trend responsiveness
This allows the indicator to adapt to different instruments while maintaining a consistent signal framework.
Important Notes
This indicator does not place trades and does not include automated backtesting or performance reporting.
All statistics and visual markers are for manual review and contextual analysis only.
Signals are intended for experienced traders who understand options risk, assignment risk, and proper position sizing.
Intended Use
Credit Spreads Swing Trading is intended as a research and decision-support tool for traders who sell option premium and want structured, rules-based signals aligned with trend, momentum, and volume.
It should be used alongside independent analysis and disciplined risk management.

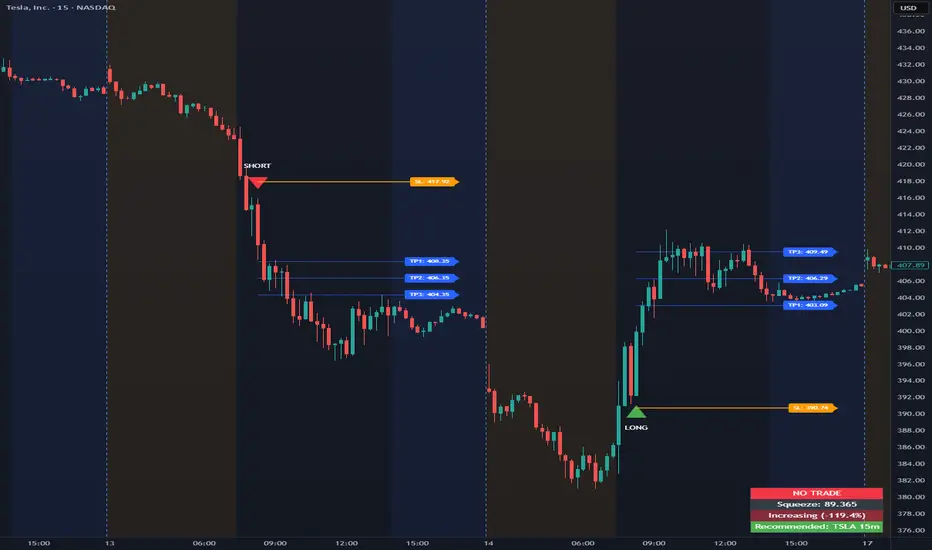
Opening Range Intraday IndicatorOpening Range Intraday Indicator
Summary
The Opening Range Intraday Indicator is a decision-support tool for intraday breakout entries. It combines an Opening Range Breakout (ORB) model with relative volume confirmation and a squeeze-style trend filter, then visualizes entries with clearly defined take-profit (TP) and stop-loss (SL) levels.
The indicator works on any ticker and any timeframe. However, its default parameters and internal logic are optimized for TSLA on the 15-minute chart, which is shown as a recommended context in the on-chart table for informational purposes only.
Core Logic
Opening Range Breakout
Establishes an opening range during the early session and monitors for confirmed breakouts above or below that range to generate potential intraday entries.
Relative Volume confirmation
Breakouts are validated using relative volume to help ensure participation and reduce low-quality signals during thin or inactive periods.
Squeeze / trend filter
A squeeze-style metric evaluates recent compression and directional behavior, helping to avoid entries during unfavorable or low-quality structural conditions.
Entry Visualization & Risk Levels
When a valid entry is confirmed, the indicator automatically:
Plots directional entry markers
Calculates and draws multiple take-profit levels
Draws a stop-loss level based on opening-range structure or ATR logic
Marks TP or SL hits directly on the chart for visual review
These visuals persist on the chart to allow traders to manually review trade structure and outcome over time.
On-Chart Table & Context Guidance
The indicator includes a compact on-chart table that displays:
Current squeeze value and short-term trend behavior
“No trade” conditions when structure is unfavorable
A recommended context message indicating whether the chart matches the optimized setup (TSLA on the 15-minute timeframe)
This message is informational only and does not restrict signals or functionality on other symbols or timeframes.
Flexibility & Controls
Users can customize:
Take-profit and stop-loss display behavior
Tight or standard stop-loss logic
Quiet windows near session close to suppress alerts
Visual settings and table positioning
This allows the indicator to be adapted to different instruments, volatility profiles, and execution styles.
Important Notes
This indicator does not execute trades and does not include automated backtesting or performance statistics.
TP/SL markers are visual aids only and are intended for manual review, not statistical validation.
Results will vary by symbol, timeframe, execution, and market conditions.
This indicator is intended as a research and decision-support tool for experienced intraday traders who understand execution risk, volatility, and position sizing. It should be used alongside proper risk management and independent analysis.
EDGE Momentum Cloud═════════════════════════════════════════════════════════════
EDGE MOMENTUM CLOUD
═════════════════════════════════════════════════════════════
█ OVERVIEW
The EDGE Momentum Cloud is a confluence-based trading system that combines adaptive volatility zones with trend direction analysis to identify high-probability trade setups. Rather than relying on a single indicator, this tool creates a visual "momentum zone" that helps traders understand the current market regime while filtering signals through trend confirmation.
The indicator generates two tiers of signals:
• Standard Signals — Based on trend direction changes
• Premium Signals — Require additional confluence with momentum zone positioning
Premium signals represent higher-conviction setups where multiple factors align.
█ HOW IT WORKS
The EDGE Momentum Cloud combines two core components working together:
❶ MOMENTUM ZONE (CLOUD)
Two ATR-based trailing bands create a dynamic volatility envelope
❷ TREND FILTER
A customizable moving average determines trend direction
❸ SIGNAL ENGINE
Evaluates confluence between trend changes and zone positioning
█ THE MOMENTUM ZONE EXPLAINED
At the core of this indicator are two ATR-based trailing bands that form the "momentum zone":
INNER BAND (FAST)
• Tighter trailing stop using a smaller ATR multiplier (default: 3.0×)
• Reacts quickly to price changes
• Defines the near-term momentum boundary
OUTER BAND (SLOW)
• Wider trailing stop using a larger ATR multiplier (default: 6.0×)
• Provides a more forgiving boundary
• Represents the broader momentum envelope
The space between these bands creates the Momentum Zone —a visual cloud that expands during volatile conditions and contracts during consolidation.
ZONE COLOR INTERPRETATION:
• Green Zone = Bullish bias (bands trailing below price)
• Red Zone = Bearish bias (bands trailing above price)
█ THE TREND FILTER EXPLAINED
A customizable moving average acts as the trend direction filter. When the trend line changes direction (turns up or down), the indicator evaluates whether conditions support a trade signal.
The trend filter supports 13 different calculation methods , allowing you to match the indicator's responsiveness to your trading style:
SMA • EMA • WMA • HMA • VWMA • RMA • LSMA
TMA • DEMA • TEMA • DWMA • SSMA • MEDIAN
Direction is determined by comparing the current value to a previous value (controlled by Direction Smoothing). Higher smoothing values reduce noise and false direction changes.
█ SIGNAL LOGIC
┌────────────────────────────────────────────────────────────
│ STANDARD SIGNALS
├────────────────────────────────────────────────────────────
│ These trigger when the trend filter changes direction:
│
│ LONG — Trend filter turns from falling to rising
│ SHORT — Trend filter turns from rising to falling
│
│ Standard signals indicate a potential trend change but
│ do not require zone confluence.
└────────────────────────────────────────────────────────────
┌────────────────────────────────────────────────────────────
│ PREMIUM SIGNALS
├────────────────────────────────────────────────────────────
│ These require confluence between trend change AND
│ favorable positioning relative to the momentum zone:
│
│ PREMIUM LONG
│ • Trend turns up while filter is ABOVE the zone, OR
│ • Price breaks into/out of zone during recent bullish trigger
│
│ PREMIUM SHORT
│ • Trend turns down while filter is BELOW the zone, OR
│ • Price breaks into/out of zone during recent bearish trigger
│
│ Premium signals have built-in confluence and typically
│ offer better risk/reward setups.
└────────────────────────────────────────────────────────────
█ VISUAL ELEMENTS
ZONE COMPONENTS
• Inner Band — Fast trailing stop (thin line)
• Outer Band — Slow trailing stop (thick line)
• Zone Fill — Shaded area between bands showing momentum regime
TREND COMPONENTS
• Trend Line — Moving average with slope-based coloring
• Green = Rising trend
• Red = Falling trend
• Purple = Neutral (if color by direction disabled)
SIGNAL MARKERS
• Triangle Up + "Long" — Standard long signal
• Triangle Down + "Short" — Standard short signal
• Label Up + "P.Long" — Premium long signal
• Label Down + "P.Short" — Premium short signal
CROSS MARKERS
• Small triangles appear when price crosses the inner or outer bands
• Up triangles = Price crossing above band
• Down triangles = Price crossing below band
BAR COLORING
• Teal bars = Price above the zone (bullish territory)
• Pink bars = Price below the zone (bearish territory)
• Purple bars = Price inside the zone (transitional)
█ CONFIGURABLE SETTINGS
┌────────────────────────────────────────────────────────────
│ GENERAL SETTINGS
├────────────────────────────────────────────────────────────
│ Confirmed Signals Only (Default: ON)
│ • When enabled, signals wait for bar close before triggering
│ • Prevents repainting on live bars
│ • Recommended: Keep ON for live trading
│
│ Display Standard Signals (Default: ON)
│ • Show/hide basic trend-change signals
│
│ Display Premium Signals (Default: ON)
│ • Show/hide confluence-based signals
│
│ Tint Price Bars (Default: ON)
│ • Color bars based on position relative to zone
└────────────────────────────────────────────────────────────
┌────────────────────────────────────────────────────────────
│ MOMENTUM ZONE SETTINGS
├────────────────────────────────────────────────────────────
│ Fast ATR Length (Default: 10)
│ • Lookback period for inner band's ATR calculation
│ • Lower = More reactive to recent volatility
│ • Higher = Smoother, less reactive
│
│ Fast Band Factor (Default: 3.0)
│ • Multiplier for inner band distance from price
│ • Lower = Tighter band, more signals
│ • Higher = Wider band, fewer signals
│
│ Slow ATR Length (Default: 10)
│ • Lookback period for outer band's ATR calculation
│
│ Slow Band Factor (Default: 6.0)
│ • Multiplier for outer band distance from price
│ • Should be larger than Fast Band Factor
│ • Creates the width of the momentum zone
└────────────────────────────────────────────────────────────
┌────────────────────────────────────────────────────────────
│ TREND FILTER SETTINGS
├────────────────────────────────────────────────────────────
│ Display Trend Line (Default: ON)
│ • Show/hide the moving average line
│
│ Resolution (Default: Chart Timeframe)
│ • Timeframe for MA calculation
│ • Leave blank to use current chart timeframe
│ • Set higher timeframe for broader trend alignment
│
│ Lookback Period (Default: 20)
│ • Moving average period length
│ • Lower = Faster, more signals
│ • Higher = Slower, fewer signals
│
│ Calculation Method (Default: SMA)
│ • Choose from 13 MA types
│ • HMA and TEMA are faster/more responsive
│ • SMA and TMA are slower/smoother
│
│ Direction Smoothing (Default: 2)
│ • Bars to look back for slope comparison
│ • Higher values reduce false direction changes
│ • Range: 1-10
│
│ Color By Direction (Default: ON)
│ • Color the trend line based on its slope
└────────────────────────────────────────────────────────────
┌────────────────────────────────────────────────────────────
│ VISUAL SETTINGS
├────────────────────────────────────────────────────────────
│ Bullish Color — Color for bullish elements (default: green)
│ Bearish Color — Color for bearish elements (default: red)
│ Neutral Color — Color for neutral/transitional states
│ Zone Fill — Opacity for the momentum zone fill
└────────────────────────────────────────────────────────────
█ ALERTS
This indicator includes five configurable alerts:
① STANDARD LONG
Triggers on basic bullish trend change signal
② STANDARD SHORT
Triggers on basic bearish trend change signal
③ PREMIUM LONG
Triggers on high-confluence bullish signal
④ PREMIUM SHORT
Triggers on high-confluence bearish signal
⑤ ANY SIGNAL
Triggers on any of the above conditions
To enable alerts:
1. Right-click on the indicator → "Add Alert"
2. Select the condition you want to be alerted on
3. Configure notification method (popup, email, webhook, etc.)
█ RECOMMENDED USAGE
TIMEFRAME
• Works on any timeframe
• Lower timeframes (1m-15m) generate more signals
• Higher timeframes (1H-Daily) generate fewer, higher-quality signals
BEST PRACTICES
• Keep "Confirmed Signals Only" enabled for live trading
• Premium signals typically offer better risk/reward than Standard
• Use zone position as context—bullish setups above zone, bearish below
• Consider higher timeframe resolution for trend filter to align with broader trend
• Combine with support/resistance or supply/demand for complete trade plans
INTERPRETATION TIPS
• Wide zones suggest increased volatility
• Narrow zones suggest consolidation
• Cross markers at bands can serve as early warnings of regime changes
• Bar colors provide quick visual reference of market position
█ SIGNAL QUALITY GUIDE
┌─────────────────┬────────────────────────────────────────┐
│ HIGHEST QUALITY │ Premium signal + Price clearly │
│ │ positioned on correct side of zone │
├─────────────────┼────────────────────────────────────────┤
│ GOOD QUALITY │ Premium signal + Price inside zone │
├─────────────────┼────────────────────────────────────────┤
│ MODERATE │ Standard signal + Price on correct │
│ │ side of zone │
├─────────────────┼────────────────────────────────────────┤
│ LOWER QUALITY │ Standard signal + Price on wrong │
│ │ side or inside zone │
└─────────────────┴────────────────────────────────────────┘
█ Final Note
This Indicator was designed specifically for the ATR cloud and the levels it provides. The buy and sell signals are a byproduct of development but more of a secondary feature. This product is published so you can take advantage of the proprietary calculations we used to make our own ATR cloud that provides excellent areas of support and resistance.
PLEASE NOTE: The "EDGE MTF ATR Bias Matrix" study that supplies the table notifying you of support and resistance is made through these ATR calculations and would pair perfectly with this study.
█ DISCLAIMER
This indicator is provided for educational and informational purposes only. It is not financial advice and should not be construed as a recommendation to buy or sell any financial instrument.
The signals generated by this indicator are based on technical analysis calculations and do not guarantee any specific outcome. Always conduct your own analysis and use proper risk management.
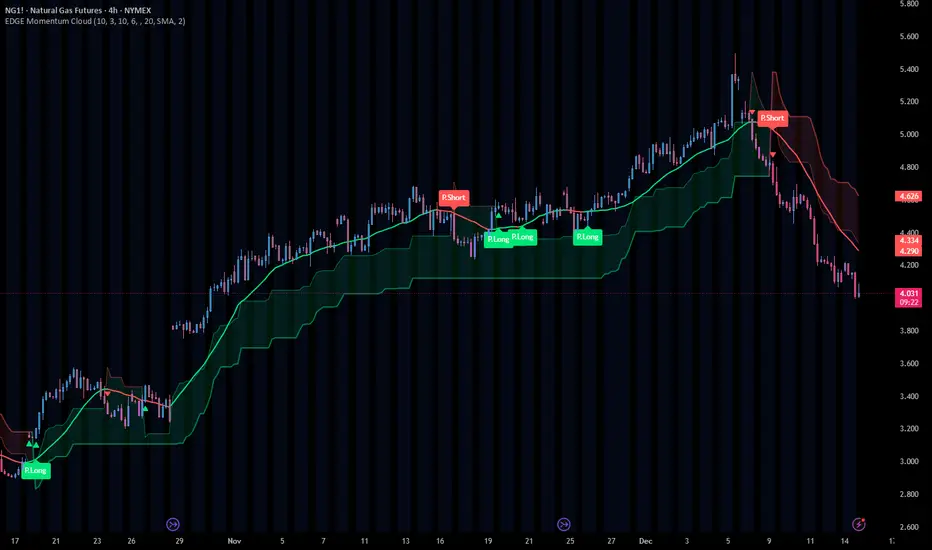
Daily High/Low Breakout Strategy v2Long and Short trade signal strategy, connects via API key to any exchange, can be used as an indicator. Based on the break of maximum and minimum levels. preferred timeframe 5 minutes.

PFA_PahadiPFA Pahadi Indicator
Market Structure through Swing Triangles
What is the PFA Pahadi Indicator?
The **PFA Pahadi Indicator** is a *price-structure visualization tool* that converts raw market movement into a series of **connected swing triangles**. By linking **Pivot Low → Pivot High → Pivot Low** and additionally connecting the **bases (Low → Low)**, the indicator visually resembles a *mountain (pahadi) range*—hence the name.
It focuses purely on **market structure**, not prediction, helping traders and analysts understand how price is *actually climbing, resting, and declining* over time.
Key Benefits
• Clear Market Structure
The indicator highlights **higher highs, higher lows, lower highs, and lower lows** in a clean, uncluttered way, making trend identification intuitive even on higher timeframes.
• Noise Reduction
By relying only on **confirmed pivots**, minor fluctuations are filtered out. This helps traders avoid reacting to short-term volatility and focus on meaningful swings.
• Visual Trend Strength Assessment
The *slope and shape* of the triangles reveal whether the trend is:
* Expanding (strong trend)
* Contracting (distribution / accumulation)
* Flattening (range / base building)
• Excellent for Positional & Swing Trading
Works particularly well on **weekly and daily charts**, where price structure matters more than intraday noise.
• No Repainting
All lines are drawn only after pivot confirmation. Once plotted, the structure does **not change retroactively**, ensuring analytical integrity.
• Complements Moving Averages & Volume
When combined with long-term averages or volume trends, the PFA Pahadi Indicator helps identify:
* Healthy pullbacks
* Structural breakdowns
* Failed rallies
Practical Use-Cases
• Trend Continuation Analysis
Higher base lines (Low → Low) indicate sustained accumulation and trend continuation.
• Structural Weakness Detection
Flattening or declining bases despite new highs may indicate **distribution** or **trend exhaustion**.
• Long-Term Support Mapping
The connected bases often act as *dynamic structural support zones* rather than exact price levels.
Limitations
• Not a Timing Indicator
The PFA Pahadi Indicator does **not provide entry or exit signals** on its own. It is a *context tool*, not a trigger.
• Lag Due to Confirmation
Because pivots require confirmation, the structure appears **after the move has occurred**. This is intentional for accuracy but unsuitable for scalping.
• Sensitive to Pivot Length Settings
Short pivot lengths may create too many triangles; longer lengths may miss smaller but tradable swings.
• Works Best in Trending Markets
In sideways or choppy conditions, the structure may appear flat and less informative.
Disclaimer
The PFA Pahadi Indicator is a market structure visualization tool and does not constitute investment advice, trading recommendations, or a guarantee of future performance. It is designed for educational and analytical purposes only.
All market decisions should be taken in conjunction with other tools such as volume analysis, risk management rules, broader market context, and individual financial suitability. Past price structures do not ensure future outcomes. Users are advised to validate the indicator across multiple securities and timeframes before applying it in live trading.
Philosophy Behind the Name
Markets don’t move in straight lines. They climb, pause, retrace, and climb again—just like a pahadi path. This indicator simply helps you see that path clearly.

Box Indicator - Auto Draw Previous Day's - High / Midline / LowThis indicator draws a box around the previous day’s high and low, calculates the midline, and displays them on the current day’s chart. It helps visualize key support/resistance levels from the prior trading day.
This script gives you a static reference box from the prior day’s trading range, including a midpoint. It’s useful for spotting potential reversal zones, breakout levels, or intraday targets based on yesterday’s price action.
