EMA Strategy by HoomanThe "EMA Hooman Strategy" indicator contains 3 Moving Average Exponential with 6, 12 and 18 lengths along with close source, which can be used as a LONG or SHORT trading strategies.
How it works :
When the GREEN line crosses the RED line from UP to DOWN , it means that the price tends to FALL DOWN and you can start a SHORT position.
When the GREEN line crosses the RED line from DOWN to UP , it means that the price tends to RISE UP and you can start a LONG position.
Whether you are in a LONG or SHORT position, the RED line can play as a STOP LOSS for you.
NOTE : It's best to be used in 1H time frame.
Enjoy it :)
Scalping

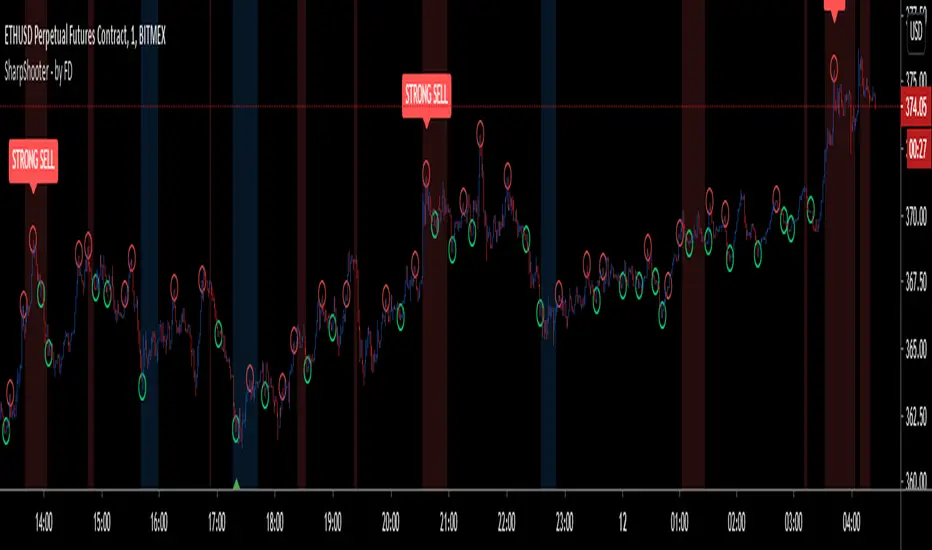
Sharp Shooter - by FiatDropoutThis is an experimental script and is intended to be used only on LTF charts for scalping. It may or may not be useful on other charts and time frame, but that is subject to back testing.
Now, coming back to this script. It has multiple features yet i tried to keep it as clean in representation as possible.
As obvious, few things are easily recognizable on chart, such as:
BUY - Go LONG
STRONG BUY - Heavy Uptrend is expected, Go LONG
SELL - Go SHORT
STRONG SHORT - Heavy Downtrend is expected, Go SHORT.
on addition to above signals, there are few other plot-shapes, which are:
Red Circle - Acts as TP for LONG during uptrend and acts as Add-On SHORT during downtrend
Green Circle - Acts as TP for SHORT during downtrend and acts as Add-on LONG during uptrend.
Red Background - Bearish Peak, potential start of downtrend
Blue Background - Bullish Peak, potential start of uptrend
------------------------------------------------------------------------------------------------------------------------------------------------------------------------------------
Now that plots are over, lets go to how to use them. As name of this script suggests, it intends to find most optimal entry and exit for long and short while taking profit on the way and adding to the position until trend changes.
Be aware that trend here is very much based on current time-frame and does not represent other time-frame's bias. Also, trend here is intended to be used as a scalp trend and not a swing trend.
Now once, you get a signal for BUY(example), then wait for "Bullish Peak"(blue background) to appear with either "STRONG BUY" or just "BUY" and take an entry at respective price, next look for "red circle" which acts as TP for long(refer sec, above) and either move stop to entry, or take partial profits or close position entirely.
Now every subsequent "green circle" will act as add-on for long and every "red circle" will act as TP for long, until "Bearish Peak" appears, which will reverse the order of how circles are used and direction of the trade. Now during "Bearish Peak" and until "Bullish Peak" appears, "red circle" will act as add-on for short and "green circle" will act as TP for short.
It might take some time to adjust to the plots, but i have decided to keep it that way in order to keep chart clean of too many signals.
------------------------------------------------------------------------------------------------------------------------------------------------------------------------------------
NOTE : Please use stops and be sure to place orders quickly as prices move faster on minute charts and you should be able to place orders and stop right away, so if you are new to trading and are currently in early stage of the business, scalping is strongly not advised, let alone this indicator. Also, past performance are not guarantee of future results and most importantly, this indicator does not repaint. By using this indicator, you accept that i am not responsible for any losses or gains made by user by trading with help of this bot.
Also, in next update, i will fix some bug, add some SS and also add alerts. Alerts are not being added currently because of high volatile nature of the bot signals which if tried on automation can give varied results. Once everything is set, i shall add alerts.
for any other queries, feel free to get back here on chat or DM.
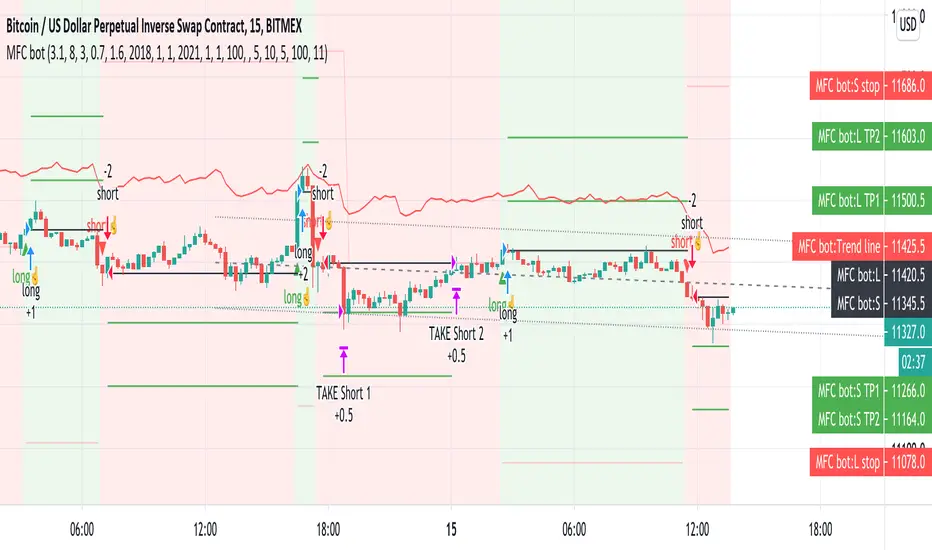
Money Flow Club Bot Strategy 1-15 min ALLENG:
Friends, in this script, there is a function that calls the closing of the candle by Heikin ASHI candles.
You can disable it in the indicator settings.
There is no redrawing of the indicator on regular candlesticks.
The indicator is easy to set up for any trading pairs and any exchanges.
It has an entry point and provides 2 take profit.
It also contains consolidation zones when the price moves for a short time in the range that is visible on the indicator.
In order to try the indicator write in your personal messages.
The strategy does not specify a condition for exiting the position when the first take is taken, the stop is moved to breakeven, so the chart in the strategy turned out to be torn.
RUS:
Друзья, в этом скрипте присутствует функция вызывающая закрытие свечи по свечам Хейкин Аши.
Её можно отключить в настройках индикатора. На обычных свечах перерисовка индикатора отсутствует.
Индикатор легко настроить на любые торговые пары и любые биржи. А нем есть точка входа и предусмотрены 2 тейк профита.
Так же в нем присутствуют зоны консолидации когда цена короткое время движется в диапазоне который виден на индикаторе.
Для того что бы попробовать индикатор напишите в личные сообщения.
В стратегии не прописано условие выхода из позиции когда первый тейк взят, то стоп переносится в безубыток, поэтому график в стратегии получился рваный.
BlueswimmersMinorsBoxV1sloth288Something different to what you usually see in the pine world Part 2
This is an add on to BlueswimmersMajorBoxV1sloth288.
Custom currency screener, to be used with BlueswimmerDoesPine at the same time. to get an idea of whats going on change lookback setting to 0, and go to minute candles.
But in a nutshell.
With lookback being 1, and if currency pair says NEUTRAL LONG, it means last close of candle the long signal happened.
With lookback being 0, and if currency pair says NEUTRAL LONG, it means last candle was neutral and current candle is sitting at long.
If scalping minute candles. Have trading screen split in two, BlueswimmersMajorsBoxV1sloth288 on one side, and BlueswimmerDoesPine on the other. that way when flicking between different charts the indicator does not need to load security data over and over again. This is also the reason why the time frame setting is there, so on the screener it can be just loaded to low time frames, and to double check a trade on the other screen you can zoom out to larger time frames and not reloading data over and over again.

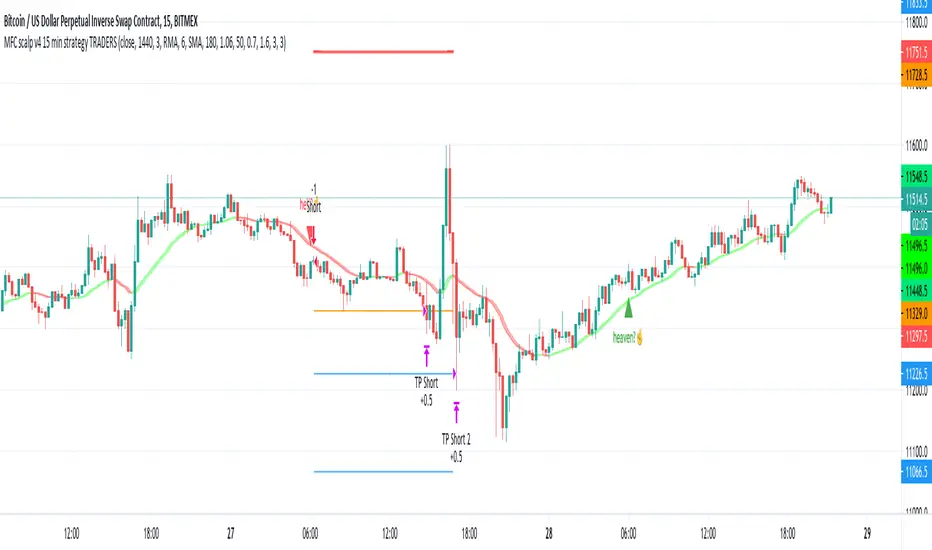
MFC scalp v4 15 min strategy TRADERSthis indicator to trade for a short time in a TF of 15 minutes.
We have created takeprofit zones for you so that you can understand where we can get to and take your profit. these points are mostly very helpful.
There are basic settings that allow you to adjust the indicator individually for each situation; because of this, this indicator can be used for any exchange and any currency pair.
For Scalp trading, we use 4 different strategies available to our clients. If you enter them correctly, you can never see the minus sign.
Use the link below to obtain access to this indicator.
Full strategy AllinOne with risk management MACD RSI PSAR ATR MAHey, I am glad to present you one of the strategies where I put a lot of time in it.
This strategy can be adapted to all type of timecharts like scalping, daytrading or swing.
The context is the next one :
First we have the ATR to calculate our TP/SL points. At the same time we have another rule once we enter(we enter based on % risk from total equity, in this example 1%, at the same time, lowest ammount for this example is 0.1 lots, but can be modified to 0.01), so we can exit both by tp/sl points, or by losing 1% of our equity or winning 1% of our total equity. It's dinamic.
The strategy is made from
Trend direction :
PSAR
First confirmation point :
Crossover between 10EMA and Bollinger bands middle point
Second confirmation
MACD histogram
Third confirmation
RSI overbought/oversold levels
For entries : we check trend with psar, then once ema cross bb middle point, we confirm together with rsi level for overbought/oversold and macd histogram ( > 0 or <0).
We exit, when we have opposite sign, like from buy to sell or sell to buy, or when we reach tp/sl points, or when we reach % basaed equity points.
It can be changed to be fixed lots, or fixed tp/sl , you just have to uncomment the size from entries, and tp/sl lines.
At the same time, it has the possibility if one desires, to trade only concrete forex session like european, asian and so on for intraday trading.
Hope you enjoy it.
Let me know how it goes.

Scalper [SystemAlpha]This is a scalping tool designed for a two pane chart layout.
Includes:
- EMAs
- Price Action Channel
- Bar Color based on PAC, Impulse and TTM
- Pivot HL - Price, Shape, Text
- Pivot Extensions
- Dynamic Support Resistance
Reference:
- Scalping Swing Trading Tool R1-4 by JustUncle
- Support Resistance - Dynamic by LonesomeTheBlue
Candle checker for long/short for scalping/day tradingHey.
This strategy is still in working.
For it I check a x amount of candles in the past if they been for example all red/green in row, and based on that I enter. For example candle 7 < candle 6 .... candle 3 < candle 2 .... candle 1 < candle current for long and viceversa for short.
After that,once the trade is initiated, I exit based on 2 possibilities : candle color is different than the color of candle when entry, or based tp/sl.
Let me know what you think of it.
I will try to make the process to calculate automatically and input the number of candles to check like 5-10-15 and so on.

SCALPING & WOLFEBold line name is TRENDLINE.
Thin line name is SCALPINGLINE.
Chronosphere line time changeable scalpingline. And ninja line fast line. Experience to use.
When TRENDLINE is 100 or TRENDLINE color green and SCALPINGLINE is 0 , this is a buying opportunity.
When TRENDLINE is 0 or TRENDLINE color red and SCALPINGLINE is the opportunity of selling when it is between 80 and 100.
When when the vertical green bar shows this is bullish wolfe formation occurs and check the scalping black and blue indicator position goes to upward the you will see the trend is up and so when the vertical red bar shows this is bearish wolfe pattern.
For access indicator use link on may profile or message me.
Enjoy:)

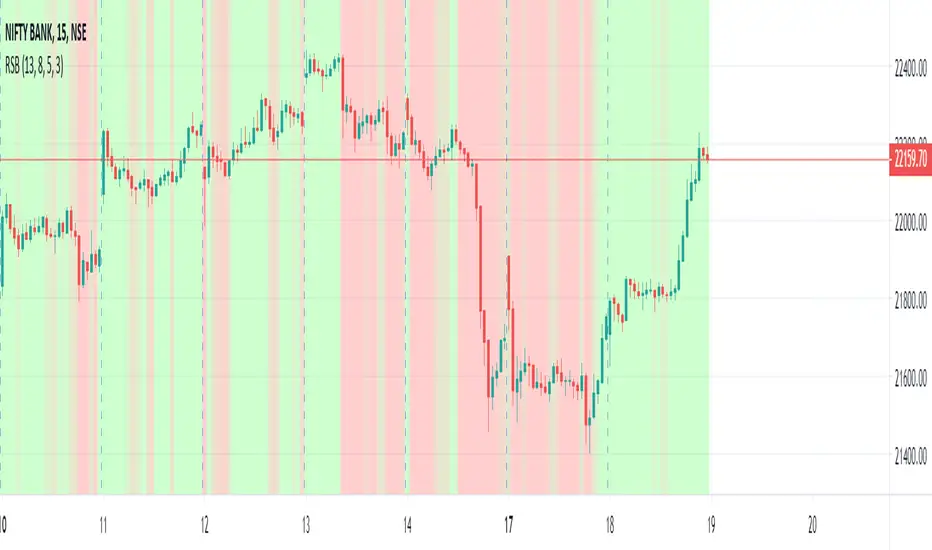
Relative Strength Background [RSB] - Scalping / Intraday / SwingThis script uses Relative Strength Index to display the strength of the trend as a background. The trend can be filtered as there are multiple RSI working synchronously in order to provide the best possible view of the trend and get favourable entry and exits.
Hope This Helps.
5/13/62 EMA CloudsThis indicator is an adaptation of Rob Booker's 5/13/62 strategy, with the addition of shaded clouds to help visualize when momentum is shifting and entry and exit points are near.
When the 5 EMA crosses the 13 EMA upward, it signals a bullish move, and it is extremely bullish when it crosses the 62 EMA. When the 5 crosses downward, it signals a bearish move.
This indicator also overlays RSI and ATR lines below for additional confirmation of signals.

Scalpy MFI*Modified version of my Scalpy indicator replacing RSI with MFI*
It is made up of a 2 main parts.
- The cloud comprising of a 10 period SMA and a 30 period SMA .
- When the cloud is green you should be looking for long entries.
- When the cloud is red you should be looking for short entries.
- Price is most bullish above a green cloud and most bearish below a red cloud.
- Being within the cloud indicates indecision.
The red line represents the MFI

YSG Scalper V2Ysg Scalper
A powerful scalping indicator that generates multiple buy and sell signals with a good amount of accuracy
How does it work?
As we all know the markets/scripts are not always in trending, many times it moves in a tight range, ysg scalping indicator helps you in identifying the trading opportunities by giving you trading zones and non-trading zones by paining the candles in three different colors Red, Yellow, and Green. When the candles are red it means the script is in the selling zone and when the candles are green the script is in the buying zone, when the candles in yellow it means the script is in no trading zone.
How to trade?
Trading with ysg scalper is very easy as it gives two zones called the trading zone and non-trading zone. If the candles are green or red the script is in trading zone and if the candles are yellow the script is in the non-trading zone.
Buy: when the candles change color to green wait for the first arrow and enter the trade after closing of the candle.
Sell: when the candles change color to red wait for the first arrow and enter the trade after closing of the candle.
What markets does it work best?
Works on indices, forex, and high beta stocks.
What's the best time frame to use?
3mins or 5mins (for forex and commodities)
How to get access?
Please click on the link in the signature or send me a private message to get access.

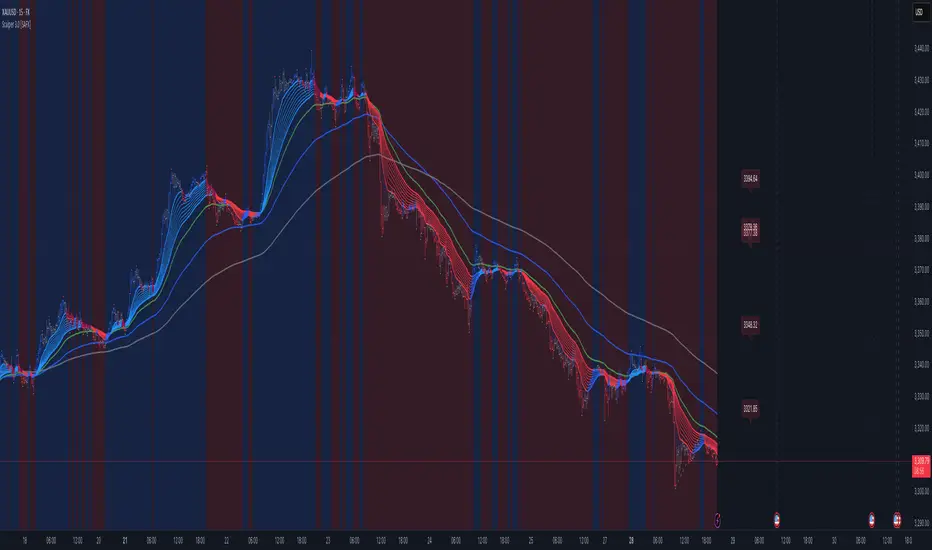
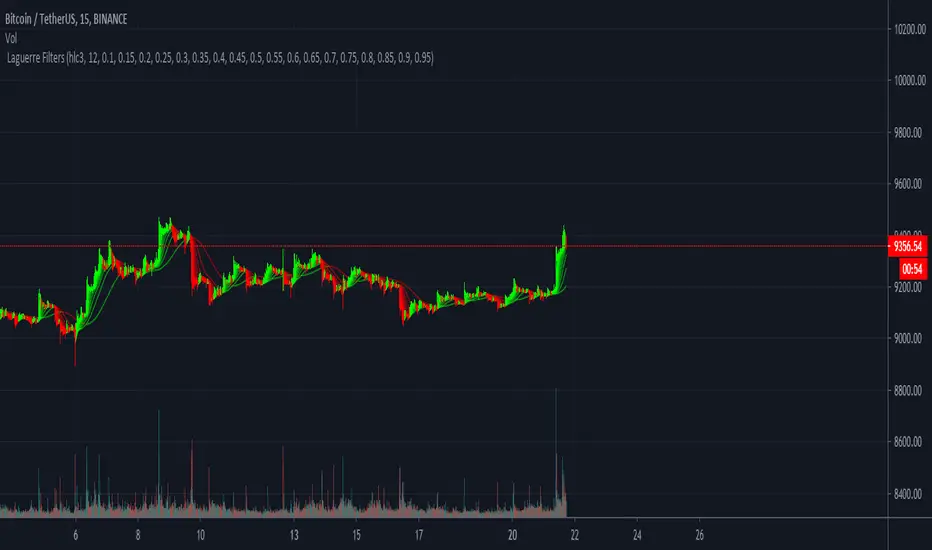
Laguerre Filters Crypto Scalping Tool This is an indicator designed to follow trends on the 15m/30m/1h Timeframe. It works best if you can recognise a larger trend into a direction and combining it then with for example longing the dip. Escpecially for crypto assets this can be used for scalping and if paired with S&R can be an especially powerful tool if paired correctly. Like it is shown here.
As soon as there is a flip to green for example with upwards momentum over the last period of time and no higher Timeframe Resistance ahead. On lower timeframes like the 15m and 30m this can be used for scalping and works especially well in Ranges, say for example a 100 Tick range. At the time of writing we heavily used this Indicator for scalping up and down the current bitcoin range and it worked suprisingly well.
One user was able to trade the EOSUSDT pump, chart shown here.
The cool thing is that the single filters can also be used as a Trailing Stop.
If interested please direct message us. Thank you !
PM_Scalper_AlertsFriends,
Welcome to ProfitMaximizer(PM) Scalper Alert Indicator. This is same Indicator as that published by me on Dec 26, 2018 .
Since the old script was published using "heikin ashi" ,As per recent house rules it was moderated and hidden by Admin.
Based on the discussion with Admin and direction given by them republishing as it is with no change in the code but the chart is now with Real CANDLEs .
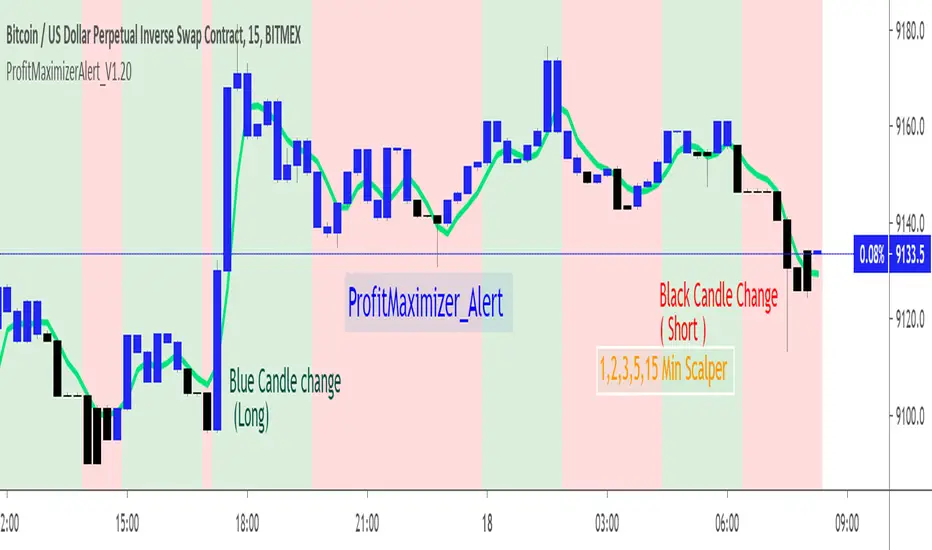
This indicator basically uses multiple time-frame and checks the price variation to determine the long and short candles.
On accumulation on good up moving candles the plot is done as Blue color that shows sign for LONG .
On accumulation on good down moving candles the plot is done as Black color that shows sign for SHORT .
Long : Change of Candle from Black to Blue Candle (U can customize color in Styles settings of this indicator)
Short : Change of Candle from Blue to Black Candle.
Alerts : Alerts are inbuilt in this indicator that can be used to get Alerts when the direction of the Candle(Blue to Black,Black to Blue) is getting changed . Financial Market is always risky.Any trade you make based on this indicator and its result is your responsibility.As an author i will be held no responsibility of your trade gain or loss.Be Cautious.
Note : This is scalper indicator and only works only in
1min ,2min, 5min, 15min .
In Higher timeframe the chart wont paint the colors.
Use the JETLINE to detect good entries ,Price above the JET line good for Long,Price Below the JET line good for short.
The Strategy version of this indicator published on 3-Sep-2018 is here for your study and reference.
Find the indicator useful,Share your feedback in comments and appreciate if this is useful.
Note : This chart can be applied for any TV supported charts.Examples Below.Thank you!
ETH Chart : 5min
EURUSD Chart :5min
SPX500 Chart :5min
Ehlers Bandpass FilterThis script uses @cheatcountry script to determine Ehlers Bandpass Filter.
Backtest offers 3 capital management tools. One that will always calculate order size as initial capital/close, one that uses the same calculation but adds or substracts profit. The last one allows you to enter manually the size you want to trade.
The time-based stop will close the position after a set number of bars.

mForex - Keltner channel + EMA Scalping systemTransaction setup parameters
Time frame: M5, M15
Currency pair: EUR / USD , GPB / USD
Transaction: London, USA
Number of orders / day: 10 - 15 orders
Trading strategies
=== BUY ===
Candles close on the upper Keltner
EMA10 crosses the upper Keltner range from below
Stop loss in the middle band or up to 12 pips
Profit target: 15-25 pips
=== SELL ===
Candles close below Keltner below
EMA10 crosses the Keltner range below from above
Stop loss in the middle band or up to 12 pips
Profit target: 15-25 pips

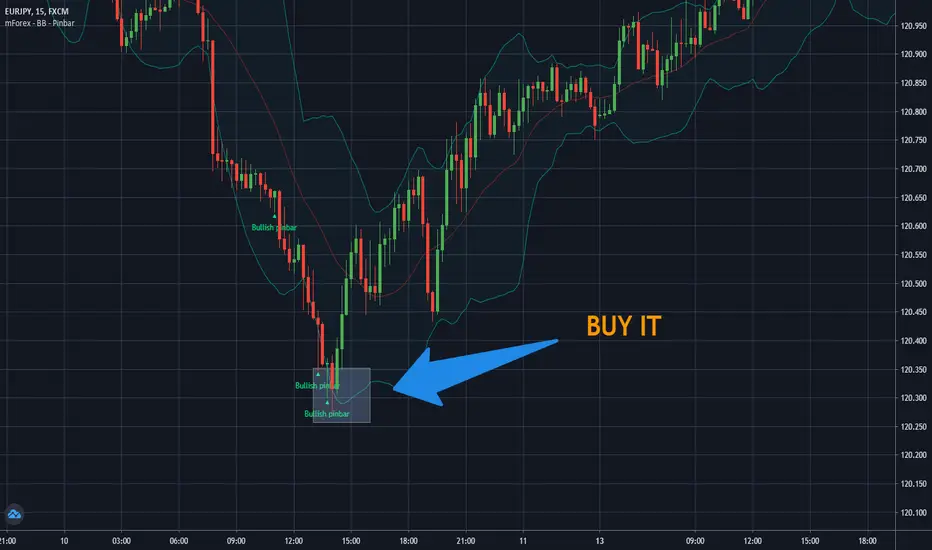
mForex - Bollinger Bands - Pinbar scalping systemTransaction setup parameters
Time frame: M5, M15
Currency pair: Any except XAU/USD
Trading strategies
=== BUY ===
Price break out of the lower Bollinger Bands
The Pinbar reversal candlestick appears and closes the candle on the lower Bollinger Bands
Stop loss: Nearest bottom + 3-5 pips
Profit target: 10-20 pips
=== SELL ===
Price break out of the upper Bollinger Bands
The Pinbar reversal candle appeared and closed below the upper
Stop loss: Nearest peak + 3-5 pips
Profit target: 10-20 pips
* If you have any questions or suggestions for this strategy, feel free to ask us.
PS ATR VariantProfit Sniper ATR Variant v0.1 is completely new but based off of the Profit Sniper 3.0 you know and love :
The original SNIPER operates off two timeframes in parallel, your Trend Timeframe (Higher Timeframe concerned with identifying market up & down trends), and your Trade Timeframe (Lower Timeframe to actually trade Longs & Shorts in).
Within each timeframe, you can tailor your preference for waiting for either Stochastic Ribbon cross only, or Ribbon Cross followed by Chande Confirmation for that additional market structure confidence. Flags & Alerts will then provide you with numerous trading Long & Short trading opportunities per day.
You also have the option to trade with trend so the indicator will automatically flag & alert only Shorts in a Short trend, and Longs in a Long Trend.
This version has the ATR (Average True Range) Indicator incorporated, to give trend direction (only tke longs in long trend and vice versa) and some additional safety features using ATR values.
For access please send a DM
With some extra features. such as ATR ( Average True Range ) trade entry which measures market volatility by analysing the range of asset price during a specified period.

MTF TZ-CXThis is a Beta version of Trend Indicator using Multi Time Frame Analysis to suggest a long or a short
the main use of this indicator is quick scalping and Intra-day trading.
The Indicator shows the option to show the Trend Zone and Buy/Sell Signals which the use can on or off
Also to avoid false positives we have introduced a double check using RSI,
it is defaulted to 60/30 - the users are free to change it as per their preferences
The system will not suggest a trade when the the counter in inside the RSI limits
Stop Loss - That should be done by following ones risk appetite , Ideally the open/close of the previous candle should be the stop loss for the buy/sell
but everyone has their own Risk Management Strategies based on the capital deployed.
Disclaimer : There could be scenarios when the candle is shown as a long or short and then the candle turns into opposite direction red/green .
In such scenarios , Please refer to the just preceding candle and if this candle is moving into positive direction (forming green candle) only then buy ,
Similarly Sell/Short only if this candle is forming a red candle

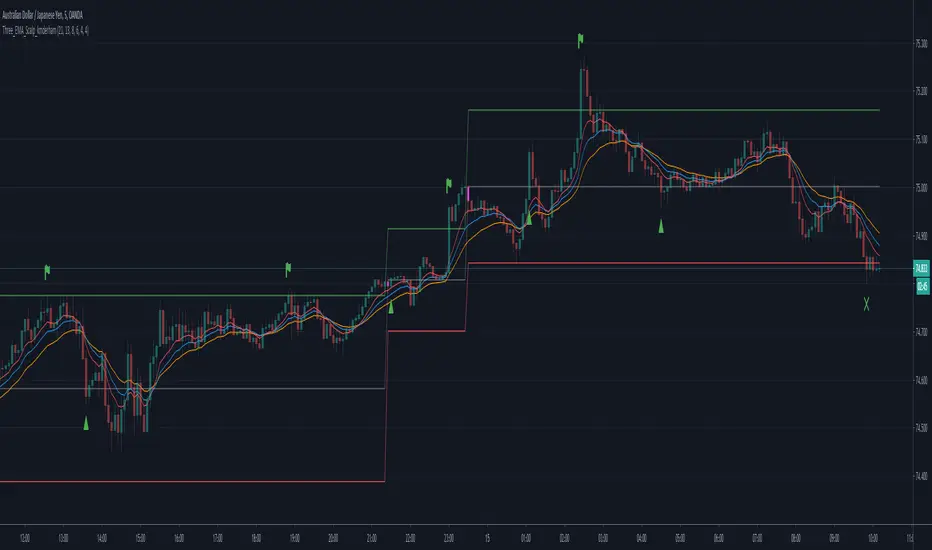
Three EMA Scalp Signals by kmderhamThis script looks for a set up condition where 5 consecutive candles have broken away from the fast EMA (set to 8 by default) followed by a "trigger" candle that crosses back over the fast EMA but not the medium EMA (set to 13 by default). It then determines the entry point based on the bar high or low (not tail or wick) depending on direction of the trend. Once the entry point is crossed, we can enter the position. Win or loss is determined whether the lower or upper levels are crossed (as per trend). After the position is won or lost and if the entry level is re-crossed before a new set up condition is found then a new entry signal is given.
Please note that this should really be used in conjunction with a higher timeframe "Anchor" chart with a fast and a slow EMA so setups and positions should should correspond to the trend of the higher timeframe chart. This was designed for a 5 minute timeframe and a 60 minute anchor chart.
Ehlers BandPass Filter [CC]The BandPass Filter was created by John Ehlers (Cycle Analytics For Traders pgs 56-57) and this indicator only works well in choppy markets so I figured it would be useful for the scalpers out there. As you will notice it correctly identifies the peaks and valleys in the underlying stock data but it doesn't work as well when the stock is trending. The black line is a leading signal for the indicator and so I use that as the basis for the buy and sell signals. Make sure to experiment with this one and let me know if you find any better buy and sell signals to work with since I believe this is the first time I have seen this script published. Buy when the line turns green and sell when it turns red.
Let me know if there are other indicators you would like to see me publish or if you want something custom done!

Dragonfly Doji with DMI and Volume FiltersA Dragonfly Doji is a type of candlestick pattern that can signal a potential reversal in price to the downside or upside, depending on past price action. It's formed when the asset's high, open, and close prices are the same. The long lower shadow suggests that there was aggressive selling during the period of the candle, but since the price closed near the open it shows that buyers were able to absorb the selling and push the price back up.
The study enhances standard Dragonfly Doji accuracy by clearing out market noises and manipulations from the indicator's triggers. Specially selected values of Directional Movement Index (DMI) components detect only strong signals while RSI bands indicator is used to find the safiest signals' closure moments.
The indicator can be applied to trading pairs with USD, USDT, ETH and BTC quote currencies. It is better to check the recent performance on each particular trading pair before apply it. The Indicator supports spot, futures and marginal trading exchanges. The best performance is obtained while using at 15m timeframe and for scalping signals
Advantages of this indicator:
1. Weak signals and market noises are filtered. This allows to receive only strong and confirmed alerts
2. The indicator includes both
Study with built-in custom alerts to use with your own software through web hook connection.
Strategy with configurable risk management settings (order size, commission, take profit, stop loss and trailing). This provides you opportunity of direct broker connection and allows to conduct backtests before applying the strategy to real account
How to use?
Long signals:
1. Apply indicator to the trading pair your are interested in at 15m timeframe chart
2. Once conditions are met price action candle will be colored yellow and DD label will be drawn. Place a long position and wait. The
3. Once price action breaks RSI resistance band, retraces and closes below the band the signal is finished and the position should be closed
Automatic strategy:
When conditions of long or short position from the strategy are met the script opens position.
Strategy.exit closes the position once risk management settings are met.
Strategy.close closes the position once RSI band rejection is confirmed
If you want to obtain access to the indicator please send us a personal message
If you want to obtain access to the indicator please send us a personal message or leave a comment
