Volume-Gated Trend Ribbon [QuantAlgo]🟢 Overview
The Volume-Gated Trend Ribbon employs a selective price-updating mechanism that filters market noise through volume validation, creating a trend-following system that responds exclusively to significant price movements. The indicator gates price updates to moving average calculations based on volume threshold crossovers, ensuring that only bars with significant participation influence the trend direction. By interpolating between fast and slow moving averages to create a multi-layered visual ribbon, the indicator provides traders and investors with an adaptive trend identification framework that distinguishes between volume-backed directional shifts and low-conviction price fluctuations across multiple timeframes and asset classes.
🟢 How It Works
The indicator first establishes a dynamic baseline by calculating the simple moving average of volume over a configurable lookback period, then applies a user-defined multiplier to determine the significance threshold:
avgVol = ta.sma(volume, volPeriod)
highVol = volume >= avgVol * volMult
The gated price mechanism employs conditional updating where the close price is only captured and stored when volume exceeds the threshold. During low-volume periods, the indicator maintains the last qualified price level rather than tracking every minor fluctuation:
var float gatedClose = close
if highVol
gatedClose := close
Dual moving averages are calculated using the gated price input, with the indicator supporting various MA types. The fast and slow periods create the outer boundaries of the trend ribbon:
fastMA = volMA(gatedClose, close, fastPeriod)
slowMA = volMA(gatedClose, close, slowPeriod)
Ribbon interpolation creates intermediate layers by blending the fast and slow moving averages using weighted combinations, establishing a gradient effect that visually represents trend strength and momentum distribution:
midFastMA = fastMA * 0.67 + slowMA * 0.33
midSlowMA = fastMA * 0.33 + slowMA * 0.67
Trend state determination compares the fast MA against the slow MA, establishing bullish regimes when the faster average trades above the slower average and bearish regimes during the inverse relationship. Signal generation triggers on state transitions, producing alerts when the directional bias shifts:
bullish = fastMA > slowMA
longSignal = trendState == 1 and trendState != 1
shortSignal = trendState == -1 and trendState != -1
The visualization architecture constructs a three-tiered opacity gradient where the ribbon's core (between mid-slow and slow MAs) displays the highest opacity, the inner layer (between mid-fast and mid-slow) shows medium opacity, and the outer layer (between fast and mid-fast) presents the lightest fill, creating depth perception that emphasizes the trend center while acknowledging edge uncertainty.
🟢 How to Use This Indicator
▶ Long and Short Signals: The indicator generates long/buy signals when the trend state transitions to bullish (fast MA crosses above slow MA) and short/sell signals when transitioning to bearish (fast MA crosses below slow MA). Because these crossovers only reflect volume-validated price movements, they represent significant level of participation rather than random noise, providing higher-conviction entry signals that filter out false breakouts occurring on thin volume.
▶ Ribbon Width Dynamics: The spacing between the fast and slow moving averages creates the ribbon width, which serves as a visual proxy for trend strength and volatility. Expanding ribbons indicate accelerating directional movement with increasing separation between short-term and long-term momentum, suggesting robust trend development. Conversely, contracting ribbons signal momentum deceleration, potential trend exhaustion, or impending consolidation as the fast MA converges toward the slow MA.
▶ Preconfigured Presets: Three optimized parameter sets accommodate different trading styles and market conditions. Default provides balanced trend identification suitable for swing trading on daily timeframes with moderate volume filtering and responsiveness. Fast Response delivers aggressive signal generation optimized for intraday scalping on 1-15 minute charts, using lower volume thresholds and shorter moving average periods to capture rapid momentum shifts. Smooth Trend offers conservative trend confirmation ideal for position trading on 4-hour to weekly charts, employing stricter volume requirements and extended periods to filter noise and identify only the most robust directional moves.
▶ Built-in Alerts: Three alert conditions enable automated monitoring: Bullish Trend Signal triggers when the fast MA crosses above the slow MA confirming uptrend initiation, Bearish Trend Signal activates when the fast MA crosses below the slow MA confirming downtrend initiation, and Trend Change alerts on any directional transition regardless of direction. These notifications allow you to respond to volume-validated regime shifts without continuous chart monitoring.
▶ Color Customization: Six visual themes (Classic, Aqua, Cosmic, Ember, Neon, plus Custom) accommodate different chart backgrounds and display preferences, ensuring optimal contrast and visual clarity across trading environments. The adjustable fill opacity control (0-100%) allows fine-tuning of ribbon prominence, with lower opacity values create subtle background context while higher values produce bold trend emphasis. Optional bar coloring extends the trend indication directly to the price bars, providing immediate directional reference without requiring visual cross-reference to the ribbon itself.
Scalping

Smart MA Zone Crossover [HMA-EMA]Smart MA Zone Crossover is a trend-following indicator designed to capture early momentum shifts using the crossover between Hull Moving Average (HMA) and Exponential Moving Average (EMA).
The indicator visually highlights trend direction using a dynamic colored zone, making it easy to identify bullish and bearish market phases at a glance.
🔸 Step 1: Moving Average Calculation
HMA (Hull Moving Average) → Faster, smoother, reacts quickly to price
EMA (Exponential Moving Average) → Stable trend reference
Both MA lengths are **fully adjustable** from the settings panel.
🔸 Step 2: Trend Detection
Bullish Trend: HMA is above EMA
Bearish Trend: HMA is below EMA
The area between the two averages is filled with color to visually represent the current trend state.
Step 3: Signal Generation (Non-Repainting)
Signals are generated **only on confirmed crossovers**:
✅ BUY Signal- HMA crosses above EMA
❌ SELL Signal-HMA crosses belowEMA
Signals do **not repaint** and appear only once per crossover.
🔸 Step 4: Visual Customization
Users can enable or disable:
* Moving average lines
* Colored MA zone fill
* Buy/Sell arrows
* Buy/Sell text labels
This allows the indicator to remain **minimal or detailed**, depending on user preference.
🔹 Key Features
✔ Non-repainting logic
✔ Clean crossover-based signals
✔ Customizable HMA & EMA lengths
✔ Optional MA zone fill
✔ Buy/Sell arrows & labels
✔ Works on all timeframes
✔ Beginner-friendly & scalper-ready
🔹 Best Use Cases
* Trend confirmation
* Momentum trading
* Scalping & intraday trading
* Swing trend filtering
For best results, combine with:
* Support & resistance
* Volume
* Higher-timeframe trend
🔹 Disclaimer
This indicator is provided for **educational purposes only**.
It is **not financial advice**. Always backtest and use proper risk management before trading live markets.

SMMA Breakout ATR retest systemA fast, ATR-based SMMA breakout scalping system designed for Gold (XAUUSD). It can also be used on other Forex and Indices pairs. Uses breakout-retest confirmation, no-chase protection, and clean visual risk levels. Optimized for quick TP1 scalps with controlled drawdowns.
Quick Scalp TP1 — Checklist
🔧 Setup
☐ Symbol: XAUUSD
☐ Timeframe: 5m
☐ SMMA Length: 5
☐ ATR Length: 14
⚙️ Settings
☐ Stop Loss: 1.5× ATR
☐ Take Profit: ATR 1.2× (TP1 only)
☐ Show Entry/SL?TP Lines & Labels✅ ON
☐ Show Entry Arrows✅ ON
☐ Show Early Warning Labels on Chart✅ ON
☐ ATR Range Filter: ❌ OFF
☐ HTF Bias (15m / 1H): ❌OFF
☐ 15m Candle Body Filter: ❌ OFF
☐ NY Session Filter: ❌ OFF
☐ Retest Entry: ✅ ON
☐ No-Chase Filter: ✅ ON
📈 BUY and SELL Entry Rules :
✅ Long setup (BUY)
If Retest Entry is ON:
☐ 1. Price breaks above the 5-SMMA (raw breakout begins)
☐ 2. Price pulls back and retests near/into the SMMA
☐ 3. A confirmation candle closes back up and breaks the retest high
➡️ BUY arrow prints + risk panel switches to SIDE: LONG
If Retest Entry is OFF:
• The BUY arrow prints immediately when the price crosses above the 5-SMMA (if filters pass)
✅ Short setup (SELL)
Same idea, reversed:
☐ 1. Break below SMMA
☐ 2. Retest near/into SMMA
☐ 3. Confirmation closes down, and breaks retest low
➡️ SELL arrow prints + panel shows SIDE: SHORT
🎯 Trade Management
When a confirmed entry happens, the script prints/plot lines to show clearly:
• ENTRY
• SL (ATR-based)
• TP1
☐ Do not hold runners in this mode, take full profit at TP1
🔔 Alerts (Recommended) - Tradingview Essential Package will allow you to use alerts
Create these alerts:
Confirmed Entry Alerts
• GG BUY CONFIRMED
• GG SELL CONFIRMED
• Set to: ✅ Once per bar close
•Type in Alert Name and Message - SELL CONFIRMED or BUY CONFIRMED
• Enable: Popup + Sound
Early Warning Alerts (Optional)
• GG EARLY BUY WARNING
• GG EARLY SELL WARNING
• Set to: ✅ Once per bar
•Type in Alert Name and Message - Potential Buy forming of Potential Sell forming
• Used only as a heads-up, not an entry
⚠️ Important Notes / Disclaimer
This script is a technical analysis tool, not financial advice.
All trading involves risk. Always test settings on a demo before live use.
Results will vary depending on market conditions, broker execution, and risk settings.

TDZZ ETH 15min Vault: No-Loss Martin Gale StrategyStrategy Overview
The ETH 15min Vault is an enhanced, high-frequency Martin Gale strategy designed specifically for Ethereum on the 15-minute chart. Its core innovation lies in integrating pre-calculated margin management with a multi-layer exit system, transforming the traditional high-risk Martingale approach into a controlled, calculated growth engine. The strategy aims for sustainable compound growth of small capitals (e.g., 1000U) in ranging markets while systematically eliminating the risk of account blow-up.
Core Concept: The "No-Loss" Guarantee
Unlike conventional Martingale systems that risk infinite losses, this strategy pre-calculates and logically reserves the total margin required for all potential layers (configurable, e.g., up to 30) at the initial entry. This ensures sufficient capital is always available for the next averaging order, preventing liquidation due to margin shortage. Combined with intelligent, proactive take-profit and safety-net closures, it creates a theoretically "No-Loss" framework for the Martin Gale method.
Key Mechanisms
1、Smart Position Averaging:
Averaging distances expand geometrically (configurable multiplier), preventing rapid layer depletion during sharp drops.
Averaging order size increases progressively (configurable multiplier) to effectively lower the break-even point.
2、Dynamic Multi-Stage Exit Logic:
Rebound TP: Partially closes a position when price rebounds a certain percentage from its entry, locking in profits early during oscillations.
Cycle TP: Closes the remaining position upon reaching the primary profit target, which is dynamically recalculated after each average to reflect the new aggregate cost.
Safety-Net Close (Defense Mode): Activates after a defined number of averages. Triggers a full exit if price: a) rallies significantly from the lowest point, b) retraces from a recent high, or c) fails to make a new low within a set time. This forms the final protective layer for capital preservation.
Main Advantages
✅ True Risk Isolation: Transforms Martingale's "unlimited risk" into a "defined and manageable drawdown" via pre-calculated margins and safety-net exits.
✅ Active Profit Capture: The "Rebound TP" mechanism increases win rate and capital efficiency in ranging markets.
✅ Adaptive to Volatility: Adjustable parameters for averaging distance and size allow tuning for different market conditions.
✅ High-Frequency Compounding Potential: Operates on the 15-min timeframe, offering numerous opportunities to complete profit cycles in consolidating phases.
Configuration & Parameters
Key adjustable inputs include: Initial Capital %, Averaging Distance % and Multiplier, Order Size Multiplier, Max Layers, Take-Profit %, Rebound Close %, and all Defense Mode thresholds.
This strategy significantly reduces liquidation risk through its design but does not eliminate trading risk. Substantial drawdowns can occur during strong, sustained trends. "No-Loss" refers to prevention of margin-call liquidation, not guaranteed profitability. Always conduct thorough backtesting and forward testing in a simulated environment before committing real capital. Past performance is not indicative of future results. Trade responsibly.

Kinetic Scalper [BULLBYTE]KINETIC SCALPER - ADVANCED MOMENTUM & CONFLUENCE TRADING SYSTEM
A SOPHISTICATED MULTI-FACTOR ANALYSIS INDICATOR FOR PRECISION ENTRIES
The Kinetic Scalper is a comprehensive trading analysis tool that combines volume-weighted momentum calculations, multi-oscillator divergence detection, and a proprietary 15-factor confluence scoring system to identify high-probability reversal setups across all timeframes.
WHAT MAKES THIS INDICATOR ORIGINAL
This is NOT a simple mashup of existing indicators.
The Kinetic Scalper features a completely custom momentum engine called the "Kinetic Pulse" - a volume-weighted momentum oscillator with Fisher Transform normalization that fundamentally differs from standard RSI or other momentum indicators. Every component feeds into a unified algorithmic framework designed specifically for this system.
KEY INNOVATIONS:
KINETIC PULSE ENGINE
Unlike standard RSI which uses simple price changes, the Kinetic Pulse applies:
→ Volume weighting to price movements (high-volume moves carry more weight)
→ EMA smoothing instead of traditional SMA (faster response to changes)
→ Fisher Transform normalization for improved signal clarity
→ Adaptive period adjustment based on current volatility regime
→ Result: A momentum oscillator that responds to conviction, not just price noise
15-FACTOR CONFLUENCE SCORING SYSTEM
Every signal is graded based on the number of confirming factors present:
→ Momentum position (oversold/overbought extremes)
→ Momentum velocity (direction change confirmation)
→ Momentum acceleration (strength of reversal)
→ Multi-oscillator divergence (price vs. 3 oscillators)
→ Volume confirmation (above-average participation)
→ Volume delta analysis (buying vs. selling pressure)
→ Higher timeframe alignment (trend confirmation from larger timeframe)
→ Session timing (major forex session awareness)
→ Structure clearance (clear path to profit targets)
→ Support/resistance proximity (confluence with key levels)
→ Market regime filtering (trending vs. choppy conditions)
Signals are graded A+, A, or B based on how many factors align:
• CONSERVATIVE MODE: A+ requires 12+ factors, A requires 9+, B requires 7+
• BALANCED MODE: A+ requires 10+ factors, A requires 7+, B requires 5+
• AGGRESSIVE MODE: A+ requires 8+ factors, A requires 5+, B requires 3+
TRADE ANALYSIS STATE MACHINE
A sophisticated monitoring system that tracks trade conditions in real-time using:
→ 5-state analysis framework (Factors Aligned / Positive Bias / Mixed Signals / Factors Weakening / Negative Bias)
→ Hysteresis-based transitions (different thresholds to enter vs. exit states)
→ Confidence smoothing with EMA (reduces noise, prevents flip-flopping)
→ Minimum commitment periods before state changes
→ Override logic for significant events (near TP/SL, momentum reversals)
→ Result: Stable, actionable guidance that doesn't change on every bar
INSTRUMENT-AWARE CALIBRATION
Automatically detects what you're trading and applies optimized parameters:
→ Forex Majors: Standard ATR, high session weight
→ Forex Crosses: Tighter stops, moderate session weight
→ Crypto: Wider stops (1.8x multiplier), reduced session weight (24/7 markets)
→ Indices: Moderate-wide stops, high session weight
→ Commodities: Moderate stops, moderate session weight
WHAT THIS INDICATOR DOES
The Kinetic Scalper is designed to identify high-confluence reversal opportunities by analyzing multiple dimensions of market behavior simultaneously.
CORE FUNCTIONS:
1. SIGNAL GENERATION
→ Identifies potential reversal points at oversold/overbought extremes
→ Confirms with multi-oscillator divergence detection
→ Validates with volume, higher timeframe, and structural analysis
→ Filters out low-probability setups automatically
→ Grades signals based on total confluence factors present
2. AUTOMATED TRADE TRACKING
→ Calculates structure-based or ATR-based stop loss levels
→ Projects take profit targets using risk-to-reward ratios
→ Monitors live position status (P/L, distance to targets, R-multiple)
→ Tracks TP1 and TP2 hits automatically
→ Displays outcome markers (TP HIT, PARTIAL WIN, STOPPED)
3. REAL-TIME CONDITION MONITORING
→ Analyzes 6 factor categories during active trades
→ Provides confidence scoring (0-100 scale)
→ Generates actionable guidance based on current market state
→ Alerts when conditions deteriorate or improve
→ Helps with trade management decisions
4. COMPREHENSIVE MARKET ANALYSIS
→ Session detection (Asian, London, New York, Overlap)
→ Volatility regime identification (Low, Normal, High, Extreme)
→ Trend state classification (Trending Up/Down, Ranging, Transitioning)
→ Volume analysis (relative volume and delta approximation)
→ Choppiness filtering (blocks signals in ranging markets)
WHY USE THIS INDICATOR
PROBLEM: Most momentum indicators generate too many false signals at extremes.
SOLUTION: The Kinetic Scalper requires MULTIPLE confirming factors before generating a signal, dramatically reducing noise and focusing on high-confluence setups.
ADVANTAGES:
✓ QUALITY OVER QUANTITY
→ Signal grading ensures you can filter for only the highest-quality setups
→ A+ signals have 10-12+ confirming factors aligned
→ Cooldown periods prevent over-trading the same move
✓ COMPLETE TRADE FRAMEWORK
→ Entry signals with confluence justification
→ Calculated stop loss based on market structure or ATR
→ Two profit targets with clear risk-to-reward ratios
→ Live trade monitoring with factor analysis
→ Outcome tracking and visual markers
✓ ADAPTIVE TO MARKET CONDITIONS
→ Volatility-based period adjustment for momentum calculations
→ Instrument-specific ATR multipliers
→ Session awareness for forex traders
→ Higher timeframe trend filtering
→ Automatic regime detection (trending vs. choppy)
✓ TRANSPARENT METHODOLOGY
→ Every input has detailed tooltips explaining its purpose
→ Signal tooltips show exactly why a signal was generated
→ Dashboard displays all relevant market conditions
→ Factor scores are visible during trades
→ No "black box" mystery calculations
✓ NON-REPAINTING & RELIABLE
→ All signals use barstate.isconfirmed (only on closed bars)
→ Higher timeframe data uses lookahead_off with historical offset
→ No future data access or repainting behavior
→ What you see is what you get - signals don't disappear or move
HOW THE INDICATOR WORKS
SIGNAL GENERATION PROCESS:
STEP 1: MOMENTUM ANALYSIS
The Kinetic Pulse engine calculates volume-weighted momentum:
→ Price changes are weighted by volume ratio vs. 20-bar average
→ High-volume moves have more influence on the oscillator
→ Gains and losses are smoothed using EMA (not SMA like RSI)
→ Fisher Transform is applied for normalization to 0-100 scale
→ Result: Momentum reading that emphasizes conviction, not noise
STEP 2: REVERSAL DETECTION
The indicator looks for potential reversal conditions:
→ Kinetic Pulse reaching oversold zone (below dynamic lower threshold)
→ Momentum velocity turning positive after being negative (for longs)
→ OR bullish divergence detected on multiple oscillators
→ Price making lower lows while oscillators make higher lows = divergence
STEP 3: MULTI-OSCILLATOR DIVERGENCE CONFIRMATION
Divergence is validated across three sources:
→ Kinetic Pulse divergence
→ CCI divergence
→ Stochastic divergence
→ Multiple oscillators confirming divergence increases signal reliability
STEP 4: CONFLUENCE FACTOR SCORING
The system evaluates all 15 possible confirming factors:
→ Momentum position: Is pulse oversold/overbought? (+0 to +2 points)
→ Momentum direction: Is velocity reversing? (+0 to +2 points)
→ Momentum acceleration: Is reversal strengthening? (+0 to +1 point)
→ Divergence count: How many oscillators show divergence? (+0 to +2 points)
→ Volume strength: Is volume above 1.3x average? (+0 to +1 point)
→ Volume delta: Is cumulative delta positive/negative? (+0 to +1 point)
→ HTF alignment: Does higher timeframe support direction? (+0 to +2 points)
→ Session timing: Is it a prime trading session? (+0 to +1 point)
→ Clear air: Is path to targets clear of obstacles? (+0 to +1 point)
→ Structure confluence: Are we near support/resistance? (+0 to +1 point)
→ Market regime: Is market trending, not choppy? (+0 to +1 point)
Total possible score: 15 points
Minimum for signal: 3-12 points depending on sensitivity mode
STEP 5: FILTER VALIDATION
Before generating a signal, additional checks are performed:
→ Volume must be above minimum threshold (if filter enabled)
→ Higher timeframe must not oppose the signal direction (if filter enabled)
→ Target path must be clear of major resistance/support (if filter enabled)
→ Volatility must not be EXTREME (blocks signals in chaos)
→ Risk-to-reward ratio must meet minimum requirement
→ Cooldown period must have elapsed since last signal
STEP 6: SIGNAL GRADING
If all filters pass, the signal is graded based on score:
→ A+ Grade: Highest confluence (8-12+ factors depending on sensitivity)
→ A Grade: High confluence (5-9+ factors)
→ B Grade: Moderate confluence (3-7+ factors)
Only graded signals (A+, A, or B) are displayed.
STEP 7: TRADE LEVEL CALCULATION
Stop loss and targets are calculated automatically:
STOP LOSS METHODS:
• Structure-Based: Uses recent swing low/high with ATR buffer, constrained by min/max ATR limits
• ATR-Based: Pure ATR multiplier with min/max constraints
• Fixed ATR: Simple ATR multiplier, no adjustments
TARGET CALCULATION:
• TP1: Entry ± (Stop Distance × Target 1 R:R)
• TP2: Entry ± (Stop Distance × Target 2 R:R)
• Default: TP1 at 1.0 R:R (1:1), TP2 at 2.0 R:R (1:2)
STEP 8: TRADE MONITORING
Once a signal is taken, the indicator tracks:
→ Current P/L in ticks and R-multiples
→ Distance to each target in ATR units
→ Distance to stop loss in ATR units
→ TP1 hit detection (marks with label, updates lines)
→ TP2 hit detection (closes trade, marks outcome)
→ Stop loss hit detection (closes trade, differentiates partial vs. full loss)
STEP 9: FACTOR ANALYSIS (DURING TRADES)
The Trade Analysis Panel monitors 6 key factor categories:
→ Momentum: Is momentum still aligned with trade direction? (-15 to +15 pts)
→ Position: Current R-multiple position (-12 to +12 pts)
→ Volume: Is volume still supportive? (-6 to +6 pts)
→ HTF Alignment: Does HTF still support trade? (-6 to +8 pts)
→ Target Proximity: How close are we to targets? (0 to +10 pts)
→ Stop Proximity: Are we dangerously close to stop? (-15 to +3 pts)
Raw scores are summed and smoothed using 5-bar EMA to create Confidence Score (0-100).
STEP 10: STATE MACHINE TRANSITIONS
Based on smoothed confidence, the system transitions between 5 states:
→ FACTORS ALIGNED (72+): Everything looks good
→ POSITIVE BIAS (58-72): Conditions favorable
→ MIXED SIGNALS (48-58): Neutral conditions
→ FACTORS WEAKENING (22-48): Concerning signals
→ NEGATIVE BIAS (<22): Poor conditions
Hysteresis prevents rapid flipping between states (different entry/exit thresholds).
RECOMMENDED TIMEFRAMES & INSTRUMENTS
TIMEFRAME VERSATILITY:
Despite the name "Scalper," this indicator works on ALL timeframes:
✓ LOWER TIMEFRAMES (1m - 15m)
→ Ideal for: Scalping and very short-term trades
→ Expect: More signals, faster trades, requires active monitoring
→ Best for: Forex majors, liquid crypto pairs
→ Tip: Use Conservative sensitivity to reduce noise
✓ MID TIMEFRAMES (15m - 1H)
→ Ideal for: Intraday trading and day trading
→ Expect: Moderate signal frequency, 1-4 hour trade duration
→ Best for: Forex, indices, major crypto
→ Tip: Balanced sensitivity works well here
✓ HIGHER TIMEFRAMES (4H - Daily)
→ Ideal for: Swing trading and position trading
→ Expect: Fewer signals, higher-quality setups, multi-day trades
→ Best for: All instruments
→ Tip: Can use Aggressive sensitivity for more opportunities
INSTRUMENT COMPATIBILITY:
✓ FOREX MAJORS (EUR/USD, GBP/USD, USD/JPY, etc.)
→ Auto-detected or manually select "Forex Major"
→ Session filtering is highly valuable here
→ London/NY overlap generates best signals
✓ FOREX CROSSES (EUR/GBP, AUD/NZD, etc.)
→ Auto-detected or manually select "Forex Cross"
→ Slightly tighter stops applied automatically
→ Session weight reduced vs. majors
✓ CRYPTOCURRENCIES (BTC, ETH, SOL, etc.)
→ Auto-detected or manually select "Crypto"
→ Wider stops (1.8x multiplier) due to volatility
→ Session filtering less relevant (24/7 markets)
→ Works well on both spot and perpetual futures
✓ INDICES (S&P 500, NASDAQ, DAX, etc.)
→ Auto-detected or manually select "Index"
→ Session opens (NY, London) are important
→ Moderate stop widths applied
✓ COMMODITIES (Gold, Silver, Oil, etc.)
→ Auto-detected or manually select "Commodity"
→ Moderate stops and session awareness
→ Works well on both spot and futures
VISUAL ELEMENTS EXPLAINED
SIGNAL MARKERS:
The indicator offers 3 display styles (choose in settings):
• PREMIUM STYLE (Default)
→ Signal appears below/above candles with connecting line
→ Background panel with grade badge (LONG , SHORT , etc.)
→ Entry price displayed
→ Direction arrow pointing to entry candle
→ Most informative, best for detailed analysis
• MINIMAL STYLE
→ Simple dot marker with grade text next to it
→ Clean, unobtrusive design
→ Best for mobile devices or cluttered charts
→ Less visual noise
• CLASSIC STYLE
→ Diamond marker with grade badge below/above
→ Traditional indicator aesthetic
→ Good balance between info and simplicity
ALL STYLES INCLUDE:
→ Signal tooltips with complete trade plan details
→ Grade display (A+, A, or B)
→ Color coding (bright colors for A+, standard for A/B)
SIGNAL TOOLTIP CONTENTS:
When you hover over any signal marker, you'll see:
→ Signal direction and grade
→ Confluence score (actual points vs. required)
→ Reason for signal (divergence type, reversal pattern)
→ Complete trade plan (Entry, Stop, TP1, TP2)
→ Risk in ticks
→ Risk-to-reward ratios
→ Market conditions at signal (Pulse value, HTF status, Volume, Session)
TRADE LEVEL LINES:
When Trade Tracking is enabled:
• ENTRY LINE (Yellow/Gold)
→ Solid horizontal line at entry price
→ Shaded zone around entry (±ATR buffer)
→ Label showing entry price
→ Extends 20-25 bars into future
• STOP LOSS LINE (Orange/Red)
→ Dashed line at stop level
→ Label showing stop price and distance in ticks
→ Turns dotted and changes color after TP1 hit (breakeven implied)
→ Deleted when trade closes
• TAKE PROFIT 1 LINE (Blue)
→ Dotted line at TP1 level
→ Label showing price and R:R ratio (e.g., "1:1.0")
→ Turns solid and changes to green when hit
→ Deleted after TP1 hit
• TAKE PROFIT 2 LINE (Blue)
→ Solid line at TP2 level
→ Label showing price and R:R ratio (e.g., "1:2.0")
→ This is the "full win" target
→ Deleted when trade closes
OUTCOME MARKERS:
When trade milestones are reached:
• - Green label appears when first target is touched
• - Green label when second target is touched (trade complete)
• - Red label if stop loss hit before any target
• - Orange label if TP1 hit but then stopped out
PREVIOUS DAY LEVELS:
If enabled (Show Previous Day Levels):
• PDH (Previous Day High) - Solid red/orange line
→ Label shows "PDH: "
→ Useful resistance reference for intraday trading
• PDL (Previous Day Low) - Solid green line
→ Label shows "PDL: "
→ Useful support reference for intraday trading
BACKGROUND TINTS:
Subtle background colors indicate states:
→ Light green tint: Active long position being tracked
→ Light red tint: Active short position being tracked
→ Light orange tint: Extreme volatility warning (signals blocked)
DASHBOARD GUIDE
The indicator features TWO dashboard panels:
━━━━━━━━━━━━━━━━━━━━━━━━━━━━━━━━━━━━━━━━━━━━━━━━━━━━━━━━━━━━━━━━━━━━━━━━━━━━━
MAIN DASHBOARD (Top Right by default)
━━━━━━━━━━━━━━━━━━━━━━━━━━━━━━━━━━━━━━━━━━━━━━━━━━━━━━━━━━━━━━━━━━━━━━━━━━━━━
WHEN NO TRADE IS ACTIVE:
→ Bias: Current market bias (BULLISH, BEARISH, NEUTRAL, LEAN LONG/SHORT)
→ Based on Kinetic Pulse position and velocity
→ Helps you understand overall momentum direction
→ Pulse: Current Kinetic Pulse value (0-100 scale)
→ <30 = Oversold (potential long setups developing)
→ >70 = Overbought (potential short setups developing)
→ 40-60 = Neutral zone
→ Volatility: Current volatility regime (LOW, NORMAL, HIGH, EXTREME)
→ Calculated from ATR ratio vs. 100-period average
→ EXTREME volatility blocks all signals (too chaotic)
→ Trend: Market state classification
→ TREND UP / TREND DOWN: ADX > 25, directional movement clear
→ RANGING: ADX < 20, choppy conditions
→ TRANSITIONING: ADX 20-25, developing conditions
→ VOLATILE: Extreme ATR regime
→ Session: Current forex session
→ ASIAN (00:00-08:00 UTC)
→ LONDON (07:00-16:00 UTC)
→ NEW YORK (13:00-22:00 UTC)
→ LDN/NY (13:00-16:00 UTC) - Overlap period, highest volatility
→ OFF-HOURS: Outside major sessions
→ Volume: Current volume vs. 20-bar average
→ Displayed as multiplier (e.g., "1.45x" = 45% above average)
→ Green if >1.3x (high volume, bullish for signal quality)
→ Red if <0.8x (low volume, bearish for signal quality)
→ HTF: Higher timeframe analysis status
→ BULLISH: HTF momentum supports longs
→ BEARISH: HTF momentum supports shorts
→ NEUTRAL: No clear HTF direction
→ Best Score: Highest confluence score currently available
→ Shows both long and short scores
→ Format: " / "
→ Example: "8/7 " means long score is 8, threshold is 7, long is leading
→ Helps you anticipate which direction might signal next
→ PDH/PDL: Previous day high and low prices
→ Quick reference for intraday support/resistance
WHEN TRADE IS ACTIVE:
→ Trade: Direction and grade (e.g., "LONG ")
→ Entry: Entry price of current trade
→ P/L: Current profit/loss
→ Shown in ticks and R-multiples
→ Format: "+45 | +0.75R" or "-20 | -0.35R"
→ Green when positive, red when negative
→ TP1: First target status
→ Shows price and distance if not hit
→ Shows "HIT" in green if reached
→ TP2: Second target price and distance
→ Stop: Stop loss price and current distance from stop
→ Bars: Number of bars since entry (trade duration)
━━━━━━━━━━━━━━━━━━━━━━━━━━━━━━━━━━━━━━━━━━━━━━━━━━━━━━━━━━━━━━━━━━━━━━━━━━━━━
TRADE ANALYSIS PANEL (Bottom Left by default)
━━━━━━━━━━━━━━━━━━━━━━━━━━━━━━━━━━━━━━━━━━━━━━━━━━━━━━━━━━━━━━━━━━━━━━━━━━━━━
This panel provides algorithmic analysis of market conditions. It does NOT provide investment advice or recommendations.
WHEN NO TRADE IS ACTIVE:
Shows scanning status and signal readiness:
→ Long/Short Readiness Gauges
→ Visual bar showing proximity to signal threshold
→ Score display (e.g., "8/7" means 8 points scored, 7 needed)
→ "RDY" indicator when threshold reached
→ Status Messages
→ "Scanning for setups..." - Normal scanning mode
→ "Long setup ready - cooldown: X bars" - Signal qualified but in cooldown
→ "Oversold conditions - watch for reversal" - Setup developing
→ "Choppy conditions detected" - Warning about market state
→ "Extreme volatility - signals blocked" - Safety filter active
WHEN TRADE IS ACTIVE:
Header shows current analysis state:
→ FACTORS ALIGNED (Green) - Everything looks good, confidence 72+
→ POSITIVE BIAS (Light Green) - Conditions favorable, confidence 58-72
→ MIXED SIGNALS (Blue) - Neutral conditions, confidence 48-58
→ FACTORS WEAKENING (Orange) - Concerning signals, confidence 22-48
→ NEGATIVE BIAS (Red) - Poor conditions, confidence <22
Confidence Score:
→ Displayed as percentage (0-100%)
→ Visual gauge (|||||.....)
→ Trend indicator (Rising, Falling, Stable)
→ Shows momentum of confidence change
Factor Breakdown (if enabled):
Shows 6 factor categories with individual scores:
→ Momentum: Is momentum aligned with trade? (-15 to +15 points)
→ Positive if velocity matches trade direction
→ Negative if momentum opposes trade
→ Position: Current R-multiple analysis (-12 to +12 points)
→ Positive if trade is in profit
→ Negative if underwater
→ Score increases as profit grows
→ Volume: Is volume supportive? (-6 to +6 points)
→ Positive if volume above average
→ Negative if volume weak
→ HTF Align: Higher timeframe status (-6 to +8 points)
→ Positive if HTF still supports trade direction
→ Negative if HTF turned against trade
→ Target: Proximity to profit targets (0 to +10 points)
→ Higher score when approaching targets
→ Bonus if TP1 already hit and near TP2
→ Stop Dist: Distance from stop loss (-15 to +3 points)
→ Negative if dangerously close to stop (<0.3 ATR)
→ Positive if well away from stop (>1.5 ATR)
Each factor shows:
• Score value with +/- indicator
• Trend symbol: + (improving), - (deteriorating), = (stable)
• Visual gauge
Guidance Messages:
→ "TARGET 2 APPROACHING" - TP2 within 0.3 ATR
→ "TARGET 1 APPROACHING" - TP1 within 0.3 ATR
→ "STOP PROXIMITY WARNING" - Stop within 0.3 ATR
→ "Factors aligned - Holding" - Positive state, stay in trade
→ "Conditions favorable" - Still looking good
→ "Conditions mixed - " - Neutral assessment
→ "Factors deteriorating" - Warning of weakening setup
→ "Confluence weakening - secure gains" - Consider exit if profitable
COMPACT MODE (Mobile-Friendly):
→ Reduces panel size by showing only essential info
→ Factor icons instead of full breakdowns
→ Simplified guidance messages
→ Perfect for smaller screens
SETTINGS GUIDE
MASTER SETTINGS:
Instrument Type
→ Purpose: Optimizes ATR multipliers and session weights for your asset
→ Options: Auto-Detect (recommended), Forex Major, Forex Cross, Crypto, Index, Commodity
→ Default: Auto-Detect
→ When to change: If auto-detection is incorrect for your symbol
Signal Sensitivity
→ Purpose: Controls how many factors required before generating signals
→ Options:
• Conservative: Requires 12+ for A+, 9+ for A, 7+ for B (fewer, highest quality)
• Balanced: Requires 10+ for A+, 7+ for A, 5+ for B (recommended)
• Aggressive: Requires 8+ for A+, 5+ for A, 3+ for B (more frequent)
→ Default: Balanced
→ When to change: If you want fewer signals (Conservative) or more opportunities (Aggressive)
Enable Trade Signals
→ Purpose: Master on/off switch for signal generation
→ Default: ON
→ When to disable: If you only want to use the analysis dashboards without signals
Enable Trade Tracking
→ Purpose: Tracks active trades and monitors conditions until TP/SL hit
→ Default: ON
→ When to disable: If you manage trades manually and don't want automatic tracking
Show Entry/Stop/Target Levels
→ Purpose: Displays trade plan lines and labels on chart
→ Default: ON
→ When to disable: If you prefer clean charts or manage levels yourself
DISPLAY SETTINGS:
Color Theme
→ Purpose: Optimizes colors for your chart background
→ Options: Dark (for dark charts), Light (for light charts)
→ Default: Dark
Signal Display Style
→ Purpose: Visual style of signal markers
→ Options:
• Premium: Badge with line and background panel (most detailed)
• Minimal: Simple dot with grade text (cleanest)
• Classic: Diamond marker with badge (traditional)
→ Default: Premium
Signal Distance
→ Purpose: How far signal labels appear from price bars (in ATR units)
→ Range: 0.5 to 10.0
→ Default: 2.0
→ When to adjust: Increase to 3.0-4.0 if signals hide behind candle wicks
TP/SL Label Distance
→ Purpose: Spacing of price labels to prevent overlap
→ Range: 0.5 to 5.0
→ Default: 1.5
Show Previous Day Levels
→ Purpose: Display PDH/PDL reference lines
→ Default: ON
→ Best for: Intraday traders who respect previous day levels
MAIN DASHBOARD:
Show Main Dashboard
→ Purpose: Toggle visibility of market conditions table
→ Default: ON
Main Dashboard Position
→ Options: Top Right, Top Left, Bottom Right, Bottom Left
→ Default: Top Right
→ When to change: To avoid overlap with TradingView's built-in panels
TRADE ANALYSIS PANEL:
Show Trade Analysis Panel
→ Purpose: Toggle factor analysis dashboard
→ Default: ON
Analysis Panel Position
→ Options: Top Right, Top Left, Bottom Right, Bottom Left, Middle Right, Middle Left
→ Default: Bottom Left
→ Recommended: Bottom Right or Middle Right to avoid overlap with Main Dashboard
Compact Mode
→ Purpose: Reduces panel size for mobile or smaller screens
→ Default: OFF
→ When to enable: Mobile trading, small screens, or minimalist preference
Show Factor Details
→ Purpose: Displays individual factor scores vs. overall confidence only
→ Default: ON
→ When to disable: For more compact view showing only state and confidence
RISK MANAGEMENT:
Stop Loss Method
→ Purpose: How stop loss distance is calculated
→ Options:
• Structure-Based: Uses swing highs/lows with ATR buffer (recommended)
• ATR-Based: Pure ATR multiplier with min/max constraints
• Fixed ATR: Simple multiplier, no adjustments
→ Default: Structure-Based
→ Impact: Structure-Based respects market geometry but constrains within safe limits
ATR Stop Multiplier
→ Purpose: Multiplier for ATR-based stop calculation
→ Range: 0.5 to 3.0
→ Default: 1.5
→ When to adjust:
• Increase to 2.0-2.5 for more breathing room (fewer false stops)
• Decrease to 1.0-1.2 for tighter stops (but more stop-outs)
Maximum Stop Distance (ATR)
→ Purpose: Cap on stop width to prevent excessive risk
→ Range: 1.0 to 5.0
→ Default: 2.5
→ Impact: If structure-based stop exceeds this, ATR-based stop is used instead
Minimum Stop Distance (ATR)
→ Purpose: Floor on stop width to avoid noise-induced stops
→ Range: 0.2 to 1.0
→ Default: 0.5
→ Impact: Prevents stops too tight to survive normal volatility
Target 1 Risk/Reward Ratio
→ Purpose: R:R for first profit target
→ Range: 0.5 to 2.0
→ Default: 1.0 (1:1 ratio)
→ Common values: 1.0 for quick profit taking, 1.5 for patient trading
Target 2 Risk/Reward Ratio
→ Purpose: R:R for second profit target (full win)
→ Range: 1.0 to 4.0
→ Default: 2.0 (1:2 ratio)
→ Common values: 2.0-3.0 for balanced risk/reward
Minimum R:R Required
→ Purpose: Filters out signals with poor risk/reward
→ Range: 0.5 to 2.0
→ Default: 1.0
→ Impact: Signals where potential reward doesn't meet this ratio are rejected
→ WARNING: Always ensure your position sizing means a stop loss = no more than 1-2% of your account, regardless of R:R ratio
SIGNAL FILTERS:
Session Awareness
→ Purpose: Weights signals higher during major forex sessions
→ Default: ON
→ Impact: Doesn't block signals, but session quality factors into scoring
→ Best for: Forex traders
Session Timezone
→ Purpose: Timezone for session calculations
→ Options: UTC, America/New_York, Europe/London, Asia/Tokyo, Asia/Hong_Kong
→ Default: UTC
→ When to change: Match your broker's server time
Higher Timeframe Alignment
→ Purpose: Checks HTF momentum before generating signals
→ Default: ON
→ Impact: Filters counter-trend signals, improves quality
→ Recommended: Keep enabled
HTF Timeframe
→ Purpose: Which higher timeframe to check
→ Default: Auto (blank field)
→ Auto selection:
• 1m chart → 5m HTF
• 5m chart → 15m HTF
• 15m chart → 1H HTF
• 1H chart → 4H HTF
• 4H+ chart → Daily HTF
→ Manual override: Enter any timeframe (e.g., "60" for 1-hour)
Volume Confirmation
→ Purpose: Requires above-average volume for signals
→ Default: ON
→ Impact: Filters low-liquidity false signals
→ Recommended: Keep enabled
Minimum Volume Ratio
→ Purpose: Volume threshold vs. 20-bar average
→ Range: 0.3 to 2.0
→ Default: 0.8 (80% of average)
→ When to adjust:
• Increase to 1.2-1.5 for only high-volume signals
• Decrease to 0.5-0.7 for more permissive filtering
Structure Clearance Check
→ Purpose: Ensures clear path to targets (no nearby resistance/support)
→ Default: ON
→ Impact: Prevents trades with immediate obstacles
→ Recommended: Keep enabled
Minimum Bars Between Signals
→ Purpose: Cooldown period after each signal
→ Range: 1 to 10
→ Default: 3
→ Impact: After a signal, this many bars must pass before another in same direction
→ When to adjust:
• Increase to 5-7 to prevent over-trading
• Decrease to 1-2 for faster re-entries
ADVANCED TUNING:
Momentum Period
→ Purpose: Base period for Kinetic Pulse calculation
→ Range: 5 to 30
→ Default: 14
→ When to adjust:
• Lower (8-10): More responsive, noisier
• Higher (18-21): Smoother, slower to react
→ Note: If Adaptive Period enabled, this is adjusted automatically
Adaptive Period
→ Purpose: Auto-adjusts momentum period based on volatility
→ Default: ON
→ Impact: Shortens period in high volatility, lengthens in low volatility
→ Recommended: Keep enabled for automatic optimization
Divergence Lookback
→ Purpose: How far back to search for divergence patterns
→ Range: 10 to 60
→ Default: 30
→ When to adjust:
• Shorter (15-20): Only recent divergences
• Longer (40-50): Catches older divergences (may be less relevant)
Swing Detection Bars
→ Purpose: Bars required on each side to confirm swing high/low
→ Range: 2 to 7
→ Default: 3
→ Impact on stops:
• Lower (2-3): More swing points, potentially tighter stops
• Higher (5-7): Only major swings, wider stops
Choppiness Index Threshold
→ Purpose: Threshold above which market considered choppy
→ Range: 38.2 to 80.0
→ Default: 61.8
→ Impact:
• Lower (50-55): Stricter quality filter (fewer signals in ranging markets)
• Higher (65-70): More permissive (allows signals in choppier conditions)
HOW TO READ SIGNALS
SIGNAL ANATOMY:
When a signal appears, you'll see:
1. DIRECTIONAL MARKER
→ Arrow, dot, or diamond pointing to entry candle (depends on style)
→ Positioned below price for LONG, above price for SHORT
→ Connected to price with line (Premium style)
2. GRADE BADGE
→ Displays signal quality: LONG , SHORT , etc.
→ Color coding:
• Bright green/cyan for A+ longs
• Standard green for A/B longs
• Bright pink/magenta for A+ shorts
• Standard red for A/B shorts
3. ENTRY PRICE (Premium style only)
→ Shows exact entry price at signal generation
4. TOOLTIP (all styles)
→ Hover over signal to see complete trade plan
→ Includes: Entry, Stop, TP1, TP2, Risk, R:R ratios, market conditions, signal reason, confluence score
INTERPRETING GRADES:
→ A+ SIGNALS (Highest Quality)
• 8-12+ confirming factors aligned
• Multiple divergences OR strong momentum reversal
• HTF alignment + volume + session timing + clear structure
• These are your highest-probability setups
• Recommended action: Give these priority, consider larger position size
→ A SIGNALS (High Quality)
• 5-9+ confirming factors aligned
• Good confluence, most key factors present
• Missing 1-2 optimal conditions
• These are still quality trades
• Recommended action: Standard position size, solid setups
→ B SIGNALS (Moderate Quality)
• 3-7+ confirming factors aligned
• Minimum viable confluence
• May be missing HTF alignment, volume, or session timing
• Higher variance outcomes
• Recommended action: Smaller position size or skip if conservative
SIGNAL NARRATIVE:
Each signal tooltip includes a narrative explaining WHY it was generated:
→ "Multi-divergence at oversold extreme"
• Multiple oscillators showing bullish divergence
• Kinetic Pulse in oversold zone
• High-quality reversal setup
→ "Bullish divergence near support"
• Divergence detected
• Price near key support level (swing low or PDL)
• Structure confluence
→ "Momentum reversal with HTF alignment"
• Kinetic Pulse velocity reversing
• Higher timeframe supports direction
• Strong trend-following setup
→ "Oversold momentum reversal"
• Extreme Kinetic Pulse reading reversing
• May not have divergence but strong momentum shift
READING THE TRADE PLAN:
Every signal comes with a complete trade plan:
→ ENTRY: The close price of the signal candle
• This is where the signal triggered
• If using limit orders, you might improve on this price
→ STOP: Calculated stop loss level
• Based on your Stop Loss Method setting
• Distance shown in ticks
• Risk tolerance: Ensure this represents ≤1-2% of your account
→ TP1: First profit target
• Default: 1:1 risk-reward
• This is your partial profit or first exit
• Consider taking 50% off at TP1
→ TP2: Second profit target
• Default: 1:2 risk-reward
• This is your "full win" target
• Hold remaining position for this level
SIGNAL FREQUENCY EXPECTATIONS:
Frequency varies by timeframe, sensitivity, and market conditions:
→ AGGRESSIVE MODE
• Lower timeframes (1m-5m): 5-15 signals per day
• Mid timeframes (15m-1H): 2-5 signals per day
• Higher timeframes (4H-D): 1-3 signals per week
→ BALANCED MODE (Default)
• Lower timeframes: 3-8 signals per day
• Mid timeframes: 1-3 signals per day
• Higher timeframes: 2-5 signals per week
→ CONSERVATIVE MODE
• Lower timeframes: 1-4 signals per day
• Mid timeframes: 0-2 signals per day
• Higher timeframes: 1-3 signals per week
Note: Frequency also depends on market volatility and trending vs. ranging conditions.
Example - Kinetic Scalper Trade Sequence
Here's an example showing the complete trade lifecycle with all dashboard transitions, annotations, and descriptions.
INSTRUMENT & TIMEFRAME DETAILS
Symbol: Nifty 50 Index (NSE)
Date: December 15, 2025
Session: London session (active trading hours)
Instrument Type: Index (auto-detected)
TRADE SEQUENCE BREAKDOWN
SCREENSHOT 1: Pre-Signal Setup Building (Image 1)
Time: ~12:00-14:30 UTC+5:30(approx.)
Price Action: Uptrend showing signs of exhaustion near 26,200
Market State: Price at session highs
Main Dashboard (Top Right):
- Bias: LEAN SHORT
- Pulse: 58.9 (approaching overbought)
- Volatility: NORMAL
- Trend: TRANSITIONING
- Session: LONDON (favorable timing)
- Volume: 0.98x (slightly below average)
- HTF: BULLISH (caution for counter-trend)
- Best Score: 9/5 (Short score building)
- PDH/PDL: 26098.25 / 25938.95
Trade Analysis Panel (Bottom Left):
- Status: NO ACTIVE TRADE
- Long Score: 5/5 (RDY)
- Short Score: 9/5 (RDY)
- Panel Message: "Short pattern developing - score: 9"
Description :
Setup Development Phase: The indicator identifies a potential short opportunity as price reaches the previous day's high. The short confluence score has climbed to 9/15 points, meeting the 'Balanced' sensitivity threshold for a Grade B signal. Notice the 'LEAN SHORT' bias and the Kinetic Pulse reading of 58.9 approaching overbought territory. The Trade Analysis panel shows 'Short pattern developing' with 9/5 factors aligned. Key factors: momentum approaching reversal zone, price at resistance (PDH), and London session providing favorable conditions.
SCREENSHOT 2: Signal Generated & Trade Entered (Image 2)
Time: ~13:00 UTC+5:30 (signal bar)
Entry Price: 26,184.65
Signal Grade: Grade
Main Dashboard (Top Right):
- Trade: SHORT
- Entry: 26184.65
- P/L: 5.95 pts | +0.2R (early positive movement)
- TP1: 26157.00 (33.2 pts away)
- TP2: 26129.35 (60.84 pts away)
- Stop: 26212.30 (22.1 pts away)
- Bars: 1 (just entered)
Trade Analysis Panel (Bottom Left):
- Header: TRADE ANALYSIS
- Status Bar: "Conditions mixed - improving 57%"
- Confidence: 57% RISING
- Factor Breakdown:
- Momentum: -4 (velocity not yet aligned)
- Position: +4 (slight profit)
- Volume: +2 = (volume present)
- HTF Align: +2 = (not strongly aligned)
- Target: +0 - (far from TP)
- Stop Dist: +3 - (good distance)
- Bottom Status: "Conditions mixed - Monitoring"
- Disclaimer: "Analysis only - Not financial advice"
Description:
Signal Activation: A Grade A short signal triggers at 26,184.65 after the short confluence score reached qualifying levels. The indicator places a structure-based stop loss at 26,212.30 (27.65 points risk) with dual targets at 1:1 and 1:2 risk-reward ratios.
The Trade Analysis Panel immediately begins monitoring with an initial confidence score of 57% - classified as 'MIXED SIGNALS' but showing a 'RISING' trend. Factor analysis reveals: momentum not yet aligned (-4 points as price just reversed), position slightly favorable (+4 points already +0.2R), volume adequate (+2), HTF showing weak alignment (+2 as we're counter-trend), stop well-placed (+3), but targets still distant (0 points).
Notice how the Main Dashboard switches from market scanning mode to active trade tracking, now displaying entry price, live P/L in both points (5.95 pts) and R-multiples (+0.2R), and distances to all key levels. The analysis panel provides real-time factor scoring to help monitor trade health.
SCREENSHOT 3: TP1 Hit - Trade Performing Well (Image 3)
Time: ~14:20 UTC+5:30(approx)
Price: ~26,154 (TP1 zone)
Bars in Trade: 29
Main Dashboard (Top Right):
- Trade: SHORT
- Entry: 26184.65
- P/L: 30.85 pts | +1.12R (excellent progress)
- TP1: HIT (displayed in green)
- TP2: 26129.35 (24.44 pts away)
- Stop: 26212.30 (58.5 pts away - well protected)
- Bars: 29
Trade Analysis Panel (Bottom Left):
- Header: TRADE ANALYSIS
- Status Bar: "Multiple factors positive"
- Confidence: 78% RISING
- Factor Breakdown:
- Momentum: +8 = (ALIGNED)
- Position: +8 + (strong profit zone)
- Volume: +2 + (continued support)
- HTF Align: +8 = (now strongly aligned)
- Target: +10 + (TP1 achieved, approaching TP2)
- Stop Dist: +3 + (excellent cushion)
- Bottom Status: "Multiple factors positive"
- Visual State: Green background (FACTORS ALIGNED state)
Description:
Trade Execution Phase - First Target Achieved: After 29 bars , price reaches the first take-profit target at 26,157.00. The ' ' marker confirms partial profit taking. Current P/L shows +30.85 points (+1.12R), exceeding the initial 1:1 risk-reward.
The Trade Analysis Panel shows dramatic improvement - confidence has surged to 78% (FACTORS ALIGNED state) with most factors now positive:
- Momentum factor improved to +8 (velocity aligned with trade direction)
- Position factor at +8 (over +1R profit zone)
- HTF Align jumped to +8 (higher timeframe now confirming the move)
- Target factor maxed at +10 (TP1 achieved, TP2 within reach)
- Stop Distance at +3 (58.5 points cushion providing safety)
Notice the panel status displays 'Multiple factors positive' with a green-tinted background, indicating optimal trade conditions. The confidence trend shows 'RISING' suggesting continued momentum. With TP1 secured and only 24.44 points to TP2, the trade is well-positioned for a full 1:2R win.
SCREENSHOT 4: TP2 Reached - Trade Complete (Image 4)
Time: ~15:00+ UTC+5:30
Final Exit: 26,129.35 (TP2)
Final Result: Full TP2 win
Main Dashboard (Top Right):
- Bias: NEUTRAL (reverted to scanning mode)
- Pulse: 45.2 (returned to neutral zone)
- Volatility: NORMAL
- Trend: TREND DOWN (confirmed the move)
- Session: LONDON
- Volume: 1.26x (increased as move developed)
- HTF: BEARISH (fully aligned post-trade)
- Best Score: 5/5 (neutral after completion)
Trade Analysis Panel (Bottom Left):
- Status: NO ACTIVE TRADE (reverted)
- Long Score: 5/5 (RDY)
- Short Score: 5/5 (RDY)
- Panel Message: "Scanning - prime session active"
- Light blue/cyan background (back to scanning mode)
Description:
Trade Completion - Full Target Achieved: The short trade reaches its second take-profit target at 26,129.35, securing a complete 1:2 risk-reward win. The ' ' marker confirms the exit. Final results:
- Entry: 26,184.65
- Exit: 26,129.35
- Profit: 55.30 points (approximately +2.0R)
- Outcome: Full TP2 success
Post-Trade Analysis: After trade closure, the indicator automatically returns to market scanning mode. The Main Dashboard reverts to showing market conditions rather than trade metrics. Notice how the 'Trend' now displays 'TREND DOWN' - confirming the move we captured. Volume increased to 1.26x during the winning move, validating the signal quality.
The Trade Analysis Panel switches back to 'NO ACTIVE TRADE' status and resumes displaying long/short setup scores. The confidence-based factor monitoring was instrumental throughout the trade:
- Initial entry at 57% confidence (MIXED SIGNALS)
- Peak confidence of 78% at TP1 (FACTORS ALIGNED)
- Real-time factor updates helped confirm trade validity
This example demonstrates the indicator's complete workflow: setup identification → signal generation → entry execution → live trade monitoring → systematic exit at targets.
KEY FEATURES DEMONSTRATED
1. Dual Dashboard System
- Main Dashboard: Market conditions (scanning) → Trade metrics (active position)
- Analysis Panel: Setup scores (scanning) → Factor-based confidence (in-trade)
2. Visual Trade Management
- Color-coded entry zones (yellow)
- Risk levels clearly marked (red dashed stop)
- Profit targets with R:R ratios labeled
- Achievement markers ( , )
3. Real-Time Factor Analysis
- 6-factor scoring system (Momentum, Position, Volume, HTF, Target, Stop Dist)
- Confidence percentage with trend indicators
- State machine (MIXED → FACTORS ALIGNED)
- Hysteresis prevents false state changes
4. Risk Management
- Structure-based stop placement (respects swing highs)
- Multiple take-profit levels (1:1 and 1:2 R:R)
- Live P/L tracking in points and R-multiples
- Distance monitoring to all key levels
This complete example showcases the indicator's progression from setup identification through trade completion, demonstrating how the dual-dashboard system and factor-based analysis provide continuous trade guidance. The structured stop-loss and dual-target approach delivered the planned 1:2 risk-reward ratio with systematic, rule-based execution.
ALERT SYSTEM
The indicator includes 9 built-in alert conditions:
SIGNAL ALERTS:
→ High-Grade Long Signal (A+)
• Triggers only on A+ long signals
• For traders who want only the highest-quality longs
• Message: "KINETIC SCALPER: LONG @ "
→ High-Grade Short Signal (A+)
• Triggers only on A+ short signals
• For traders who want only the highest-quality shorts
• Message: "KINETIC SCALPER: SHORT @ "
→ Long Signal
• Triggers on ANY qualified long signal (A+, A, or B)
• For traders who want all long opportunities
• Message: "KINETIC SCALPER: LONG @ "
→ Short Signal
• Triggers on ANY qualified short signal
• For traders who want all short opportunities
• Message: "KINETIC SCALPER: SHORT @ "
TRADE MANAGEMENT ALERTS:
→ TP1 Hit
• Triggers when first profit target is reached
• Useful for partial profit taking notifications
• Message: "KINETIC SCALPER: TP1 REACHED"
→ TP2 Reached
• Triggers when second profit target is reached
• Trade is complete, full win achieved
• Message: "KINETIC SCALPER: TP2 REACHED"
→ Stop Loss Hit
• Triggers when stop loss is reached
• Important for trade management and risk tracking
• Message: "KINETIC SCALPER: STOP LOSS"
ANALYSIS STATE ALERTS:
→ Analysis State: Negative Bias
• Triggers when factor analysis enters "Negative Bias" state
• Warning that trade conditions are deteriorating
• Consider reducing position or preparing to exit
• Message: "KINETIC SCALPER: Analysis state changed to NEGATIVE BIAS"
→ Analysis State: Factors Weakening
• Triggers when factor analysis enters "Factors Weakening" state
• Caution that confluence is diminishing
• Monitor trade closely
• Message: "KINETIC SCALPER: Analysis state changed to FACTORS WEAKENING"
HOW TO SET UP ALERTS:
1. Click the "Create Alert" button in TradingView
2. Condition: Select "Kinetic Scalper "
3. Choose your desired alert from the dropdown
4. Configure your alert options:
→ Once Per Bar Close (recommended for non-repainting)
→ Frequency: Once Per Bar Close or Only Once
5. Set expiration and notification methods (popup, email, webhook, etc.)
6. Create alert
RECOMMENDED ALERT STRATEGY:
For active traders:
→ Set "Long Signal" and "Short Signal" alerts for all opportunities
→ Set "TP1 Hit", "TP2 Reached", and "Stop Loss Hit" for trade management
→ Consider "Analysis State: Negative Bias" for trade monitoring
For selective traders:
→ Set only "High-Grade Long Signal (A+)" and "High-Grade Short Signal (A+)"
→ Focus on the absolute highest-quality setups
→ Set TP/SL alerts for position management
USAGE TIPS & BEST PRACTICES
SIGNAL SELECTION:
✓ GRADE MATTERS
→ A+ signals have statistically more confluence factors
→ If you're conservative, trade only A+ signals
→ B signals can work but require more discretion
✓ CONFLUENCE WITH YOUR ANALYSIS
→ Use this indicator as CONFIRMATION, not sole decision criteria
→ Combine with your own support/resistance analysis
→ Check for fundamental events (news, economic data)
→ Respect major round numbers and psychological levels
✓ SESSION TIMING (Forex)
→ Best signals often occur during London/NY overlap
→ Avoid signals 10 minutes before major news releases
→ Asian session signals can be valid but lower liquidity
✓ TIMEFRAME CONFLUENCE
→ If you get an A+ signal on 15m, check if 1H chart agrees
→ Higher timeframe confirmation adds conviction
→ Avoid signals that oppose the daily/4H trend
TRADE MANAGEMENT:
✓ POSITION SIZING
→ ALWAYS size positions so stop loss = 1-2% of account
→ Never risk more than you can afford to lose
→ Smaller position on B signals, standard on A, larger on A+ (within limits)
✓ PARTIAL PROFIT TAKING
→ Consider taking 50% off at TP1
→ Move stop to breakeven after TP1 hit
→ Let remaining position run to TP2
✓ TRAILING STOPS
→ The indicator doesn't auto-trail stops (manual decision)
→ After TP1, you might manually move stop to entry (breakeven)
→ Consider ATR-based trailing stop for runners
✓ WATCH THE ANALYSIS PANEL
→ If state changes to "Factors Weakening" while in profit, consider exit
→ "Negative Bias" during a trade is a strong warning
→ "Factors Aligned" confirms your trade thesis is still valid
RISK MANAGEMENT:
✓ NEVER IGNORE STOPS
→ The calculated stop is there for a reason
→ Moving stop further away increases risk exponentially
→ If stopped out, accept it and wait for next setup
✓ AVOID REVENGE TRADING
→ If you get stopped out, resist urge to immediately re-enter
→ Signal cooldown helps with this
→ Wait for next qualified signal
✓ RESPECT VOLATILITY WARNINGS
→ If indicator shows "EXTREME" volatility, signals are blocked for a reason
→ Don't force trades in chaotic conditions
→ Wait for regime to normalize
✓ CORRELATION RISK
→ Be aware of correlation if trading multiple pairs
→ EUR/USD and GBP/USD are highly correlated
→ Don't stack risk on correlated instruments
OPTIMIZATION:
✓ START WITH DEFAULTS
→ Default settings are well-tested
→ Don't over-optimize for recent market behavior
→ Give settings at least 20-30 trades before judging
✓ TIMEFRAME-SPECIFIC ADJUSTMENTS
→ Lower timeframes: Consider increasing Signal Distance to 3.0-4.0
→ Higher timeframes: ATR Stop Multiplier might go to 2.0-2.5
→ Crypto: Ensure Instrument Type is set to "Crypto" for proper stops
✓ SENSITIVITY CALIBRATION
→ Too many signals? Switch to Conservative
→ Missing good setups? Try Balanced or Aggressive
→ Quality > Quantity always
✓ KEEP A JOURNAL
→ Track which signal grades work best for you
→ Note which sessions produce best results
→ Review stopped trades for patterns
THINGS TO AVOID:
✗ DON'T chase signals after several bars have passed
✗ DON'T ignore the stop loss or move it further away
✗ DON'T overtrade by taking every B-grade signal
✗ DON'T trade during major news if you're not experienced
✗ DON'T use this as your only analysis tool
✗ DON'T expect 100% win rate (no indicator has this)
✗ DON'T risk more than 1-2% per trade regardless of signal grade
UNDERSTANDING THE METHODOLOGY
WHY VOLUME WEIGHTING?
Traditional momentum oscillators treat all price moves equally. A 10-point move on low volume is weighted the same as a 10-point move on high volume.
The Kinetic Pulse corrects this by:
→ Calculating volume ratio vs. 20-bar average
→ Applying square root transformation to volume ratio (prevents extreme weights)
→ Multiplying price changes by volume weight
→ Result: High-volume moves influence the oscillator more than low-volume noise
This helps filter false breakouts and emphasizes moves with participation.
WHY FISHER TRANSFORM?
Fisher Transform is a mathematical transformation that:
→ Normalizes probability distributions
→ Creates sharper turning points
→ Amplifies extremes while compressing the middle
→ Makes overbought/oversold levels more distinct
Applied to the Kinetic Pulse, it helps identify genuine extremes vs. noise.
WHY MULTI-OSCILLATOR DIVERGENCE?
Single-source divergence can give false signals. By requiring divergence confirmation across multiple oscillators (Kinetic Pulse, CCI, Stochastic), the system filters out:
→ Divergences caused by calculation quirks in one oscillator
→ Temporary momentum anomalies
→ False divergence on noisy, low-timeframe charts
Multiple sources confirming the same pattern increases reliability.
WHY ADAPTIVE PERIODS?
Fixed periods can be:
→ Too slow during high volatility (miss fast reversals)
→ Too fast during low volatility (generate noise)
The adaptive system:
→ Shortens period when ATR ratio > 1.3 (high volatility = need faster response)
→ Lengthens period when ATR ratio < 0.7 (low volatility = need noise filtering)
→ Keeps period in reasonable range (60% to 140% of base period)
→ Result: Oscillator adjusts to current market pace automatically
WHY HYSTERESIS IN STATE MACHINE?
Without hysteresis, the analysis state would flip-flop on every bar, creating:
→ Confusing, contradictory guidance
→ Analysis paralysis
→ Lack of actionable information
Hysteresis solves this by:
→ Using different thresholds to ENTER vs. EXIT a state
→ Example: Enter "Factors Aligned" at 72+ confidence, but don't exit until <62
→ This creates stable states that persist through minor fluctuations
→ Requires minimum commitment period (3 bars) before state changes
→ Overrides commitment for significant events (near TP/SL)
→ Result: Stable, trustworthy analysis that changes only when truly warranted
WHY CONFIDENCE SMOOTHING?
Raw factor scores fluctuate bar-by-bar based on momentary conditions. Smoothing:
→ Uses 5-period EMA on raw confidence scores
→ Filters out single-bar anomalies
→ Preserves genuine trends in confidence
→ Prevents false state transitions
→ Result: More reliable assessment of actual trade health
WHY INSTRUMENT-SPECIFIC PARAMETERS?
Different instruments have different characteristics:
→ Forex is highly liquid, respects technical levels well, standard ATR works
→ Crypto is extremely volatile, needs wider stops (1.8x) to avoid false stops
→ Indices respect session opens strongly, session weighting is important
→ Commodities fall in between
Auto-detection applies research-based multipliers automatically.
WHY STRUCTURE-BASED STOPS?
ATR-based stops can:
→ Place stop in middle of consolidation (easily hit)
→ Ignore obvious invalidation levels
→ Be too tight during expansion or too wide during contraction
Structure-based stops:
→ Use actual swing highs/lows (where traders actually place stops)
→ Add small ATR buffer to avoid stop hunting
→ Constrain within min/max ATR limits for safety
→ Result: Stops that respect market geometry while managing risk
DISCLAIMER & RISK WARNING
READ THIS CAREFULLY BEFORE USING THIS INDICATOR
This indicator is provided for EDUCATIONAL and INFORMATIONAL purposes only.
❌ NOT FINANCIAL ADVICE
This indicator does NOT constitute financial advice, investment recommendations, or solicitation to buy or sell any financial instrument. All information is for educational purposes only.
❌ NO GUARANTEES
→ Past performance does NOT guarantee future results
→ No indicator can predict future price movements with certainty
→ Signal grades represent confluence, NOT win probability
→ A+ signals can lose, B signals can win - markets are probabilistic
❌ SUBSTANTIAL RISK
Trading financial instruments involves SUBSTANTIAL RISK of loss:
→ You can lose your entire investment
→ Leveraged trading amplifies both gains AND losses
→ Never trade with money you cannot afford to lose
→ Never risk more than 1-2% of your account per trade
❌ YOUR RESPONSIBILITY
→ All trading decisions are YOUR responsibility
→ You must conduct your own analysis before entering trades
→ Consult a licensed financial advisor before trading
→ Understand the risks specific to your jurisdiction and situation
→ Only trade with capital you can afford to lose completely
❌ NO HOLY GRAIL
→ This indicator is a TOOL, not a complete trading system
→ It should be used as part of a broader analysis framework
→ Combine with your own technical analysis, risk management, and judgment
→ No indicator works 100% of the time in all market conditions
❌ ANALYSIS PANEL DISCLAIMER
The "Trade Analysis Panel" provides ALGORITHMIC ANALYSIS of market factors.
→ It does NOT provide investment advice or recommendations
→ Factor scores are mathematical calculations, not predictions
→ Guidance messages are informational, not directives
→ All trading decisions remain your responsibility
❌ BACKTESTING LIMITATIONS
→ This is an indicator, not a strategy, so no backtesting results are provided
→ Any backtesting you perform includes hindsight bias and optimization bias
→ Historical performance does not indicate future performance
→ Slippage, commissions, and real-world execution differ from backtests
❌ MARKET CONDITIONS
→ This indicator performs differently in trending vs. ranging markets
→ Extreme volatility can produce false signals or whipsaws
→ Low liquidity periods increase execution risk
→ Major news events can invalidate technical analysis
BY USING THIS INDICATOR, YOU ACKNOWLEDGE:
→ You have read and understood this disclaimer
→ You accept full responsibility for your trading decisions
→ You understand the substantial risks involved in trading
→ You will not hold the author liable for any losses incurred
→ You are using this tool as part of your own due diligence process
KEY FEATURES SUMMARY
✅ Volume-Weighted Kinetic Pulse Engine (proprietary momentum calculation)
✅ 15-Factor Confluence Scoring System (graded signals: A+, A, B)
✅ Multi-Oscillator Divergence Detection (Pulse + CCI + Stochastic)
✅ Higher Timeframe Trend Alignment Filter
✅ Adaptive Period Adjustment (volatility-responsive)
✅ Instrument-Aware Calibration (Forex, Crypto, Indices, Commodities)
✅ Structure-Based Stop Loss Calculation (respects swing highs/lows)
✅ Automated Trade Tracking (entry, stop, TP1, TP2, P/L)
✅ Real-Time Factor Analysis State Machine (5-state system with hysteresis)
✅ Session Awareness (Asian, London, New York, Overlap)
✅ Volatility Regime Detection (blocks signals in extreme conditions)
✅ Choppiness Filter (reduces signals in ranging markets)
✅ Volume Confirmation (relative volume and delta analysis)
✅ Clean Air Check (validates clear path to targets)
✅ Comprehensive Dashboards (market conditions + trade analysis)
✅ Customizable Display (3 signal styles, color themes, positioning)
✅ 9 Built-In Alert Conditions (signals, TP/SL hits, state changes)
✅ Fully Non-Repainting (barstate.isconfirmed, lookahead_off)
✅ Previous Day Levels (PDH/PDL reference lines)
✅ Mobile-Friendly Compact Mode (for smaller screens)
TECHNICAL SPECIFICATIONS
→ Pine Script Version: v6
→ Indicator Type: Overlay (displays on price chart)
→ License: Mozilla Public License 2.0
→ Copyright: BULLBYTE
→ Object Limits: 300 labels, 100 lines, 50 boxes
→ Memory Management: Automatic cleanup system (FIFO queue)
→ Repainting: Non-repainting (signals confirmed on bar close)
→ Timeframe Support: All timeframes (1s to Monthly)
→ Instrument Support: Forex, Crypto, Indices, Commodities, Stocks
→ HTF Data Handling: lookahead_off with historical offset
VERSION HISTORY
v1.0 - Initial Release
→ Kinetic Pulse engine with volume weighting and Fisher Transform
→ 15-factor confluence scoring system
→ Trade analysis state machine with hysteresis
→ Automated trade tracking and monitoring
→ Dual dashboard system (market conditions + factor analysis)
→ 9 alert conditions
→ 3 signal display styles
→ Instrument-aware calibration
→ Full risk management framework
WHO IS THIS INDICATOR FOR?
IDEAL FOR:
✓ Scalpers and day traders seeking high-confluence reversal entries
✓ Swing traders who want quality over quantity
✓ Traders who appreciate systematic, rules-based analysis
✓ Multi-timeframe traders who value HTF confirmation
✓ Forex traders who respect session timing
✓ Crypto traders needing volatility-adjusted parameters
✓ Traders who want complete trade management (entry, stop, targets)
✓ Analytical traders who want transparency in signal generation
NOT IDEAL FOR:
✗ Traders seeking a "set and forget" holy grail system
✗ Traders who don't want to learn the methodology
✗ Traders unwilling to accept losing trades as part of the process
✗ Traders who need constant signals (this is a quality-focused system)
✗ Traders who ignore risk management
FINAL THOUGHTS
The Kinetic Scalper is the result of extensive research into momentum behavior, volume confirmation, and multi-factor confluence analysis. It's designed to identify high-probability reversal setups while maintaining strict risk management and providing complete transparency.
This is NOT a magic solution. It's a sophisticated TOOL that requires:
→ Understanding of the methodology
→ Proper risk management discipline
→ Patience to wait for quality setups
→ Willingness to accept losses as part of trading
→ Integration with your own analysis and judgment
Used properly as part of a complete trading plan, the Kinetic Scalper can help you identify high-confluence opportunities and manage trades systematically.
Remember: Quality over quantity. Discipline over emotion. Risk management over everything.
Trade smart. Trade safe.
© 2025 BULLBYTE | Kinetic Scalper v1.0 | For Educational Purposes Only

Ghost Scalp Protocol By [@Ash_TheTrader]
# 👻 GHOST SCALP PROTOCOL
### 💀 Stop Getting Trapped. Start Tracking the Banks.
Most retail traders lose because they enter exactly where institutions are exiting. They get caught in **"Stop Hunts"** and **"Fake-Outs."**
The **Ghost Scalp Protocol** is not just an indicator; it is a complete institutional trading system designed for **M1 & M5 Scalpers**. It combines **Smart Money Concepts (SMC)** with a **Physics-Based Momentum Engine ($p=mv$)** to detect high-probability reversals.
---
### ⚛️ THE LOGIC: 3-STAGE CONFIRMATION
This algorithm does not rely on lagging indicators. It uses a 3-step "Protocol" to validate every trade:
**1. THE GHOST TRAP (Liquidity Sweeps)**
* The script automatically draws "Ghost Lines" at key Swing Highs/Lows where retail Stop Losses are hiding.
* It waits for price to **sweep** these levels (Stop Hunt).
* **The Signal:** A Neon **Skull (☠️)** appears *only* if price aggressively rejects the level with high volume. This is the "Turtle Soup" pattern.
**2. THE PHYSICS ENGINE ($p = mv$)**
* Momentum is not just price speed; it is **Mass (Volume) x Velocity (Range)**.
* The dashboard calculates the "Force" of every candle.
* **The Signal:** An **Arrow (⬆/⬇)** appears when momentum surges **5x** above the average. This confirms the banks are pushing the move.
**3. BANK BIAS (Elasticity Filter)**
* Markets move like a rubber band.
* The script calculates a hidden "Fair Value" baseline.
* It creates a **Bias**: It only looks for Shorts in **PREMIUM (Shorting)** zones and Longs in **DISCOUNT (Accumulating)** zones.
---
### 📊 THE SMART DASHBOARD (HUD)
A futuristic, non-intrusive Heads-Up Display keeps you focused on the data that matters:
* **🏦 BANK BIAS:** Tells you if Institutions are likely **Accumulating** or **Shorting**.
* **📈 HTF TREND:** Automatically checks the **1-Hour Trend**. Don't fight the tide.
* **🚀 MOMENTUM:** Real-time Physics calculation.
* **Green Text:** Acceleration (Move is getting stronger).
* **Red Text:** Deceleration (Move is dying).
* **🌍 SESSION:** Shows active Bank Sessions (Tokyo, London, NY).
* **⚠️ OVERLAP ALERT:** Flashes GOLD when London & New York are open simultaneously (Peak Volatility).
---
### 🔥 STRATEGY: HOW TO TRADE
Use this checklist to execute high-probability scalps:
#### 📉 SHORT SETUP (SELL)
1. **Liquidity:** Wait for price to break above a **Red Ghost Line** (Sweep Highs).
2. **Signal:** Wait for the **Pink Skull ☠️** (Trap Detected).
3. **Confluence:**
* Dashboard Bias says: **"SHORTING"**
* HTF Trend says: **"BEARISH 📉"** (Optional but recommended).
4. **Entry:** On the Close of the Skull candle.
5. **Stop Loss:** Just above the wick swing high.
#### 📈 LONG SETUP (BUY)
1. **Liquidity:** Wait for price to break below a **Blue Ghost Line** (Sweep Lows).
2. **Signal:** Wait for the **Blue Skull ☠️** (Trap Detected).
3. **Confluence:**
* Dashboard Bias says: **"ACCUMULATING"**
* HTF Trend says: **"BULLISH 📈"** (Optional but recommended).
4. **Entry:** On the Close of the Skull candle.
5. **Stop Loss:** Just below the wick swing low.
---
### 🏆 RECOMMENDED PAIRS & TIMEFRAMES
* **⚡ Best Timeframes:**
* **1 Minute (M1):** For aggressive "Sniper" entries (High Frequency).
* **5 Minute (M5):** The "Gold Standard" for balanced Scalping.
* **15 Minute (M15):** Safer, higher win-rate Day Trading.
* **💎 Best Assets:**
* **Gold (XAUUSD):** Highly effective on liquidity sweeps.
* **Indices:** US100 (Nasdaq), US30 (Dow Jones).
* **Crypto:** BTCUSD, ETHUSD (High volatility).
* **Forex:** GBPUSD, EURUSD (London/NY Session).
---
### 🛠️ SETTINGS & CUSTOMIZATION
* **Surge Factor:** Default is **5.0x**. Lower this to 3.0 if you want more aggressive Momentum Arrows.
* **Smart Sessions:** Automatically converts to **New York Time** (EST) regardless of your location. No more time zone math.
* **Visuals:** Designed with "Ghost Glow" technology—97% transparent backgrounds that look classy and don't clutter your chart.
---
**"The Ghost Algo sees what you can't."**
*Trade Safe. Trade Smart.*
**~ Ash_TheTrader**

JAM ALGO Signals
"Remove the filters to view signals, then customize the parameters to your preference and enjoy using the indicator!" ✅
JAM ALGO Signals
Description:
🚀 Advanced Trading Signals with Risk Management & Alerts
This indicator is a complete all-in-one tool for traders seeking precise entries and exits with built-in risk management and real-time statistics. It combines RSI and EMA-based analysis, projected Take Profit (TP) and Stop Loss (SL) levels, customizable filters, and premium alerts directly on your TradingView chart.
✨ Key Features:
Entry Signals 🔹
Buy & Sell signals based on price action and RSI conditions.
Trend confirmation via EMA (200 and optional 50-period filters).
Visual signals: Labels, Arrows, Triangles, or Text.
Risk Management (RR) ⚖️
Define Stop Loss (SL) and multiple Take Profit levels (TP1, TP2, TP3) based on risk ratio (R).
Configurable projection bars to visualize target levels.
Colored zones for TP & SL, with optional borders for clarity.
Premium Alerts 🔔
Alerts for BUY / SELL signals, TP1 / TP2 / TP3, and SL hits.
Instant notifications when levels are reached.
Advanced Filters 🛡️
EMA50 Trend Filter: confirms short-term trend.
RSI Direction Filter: ensures momentum alignment.
Volatility Filter (ATR14 > Range): ensures enough market movement.
Candle Size Filter: avoids entries on too small candles.
SL Overlap Filter: prevents trades overlapping existing SL levels.
Real-Time Statistics 📊
Total trades, wins (TP1), and losses (SL).
Winrate (%), cumulative profit, and average RR ratio.
Optimizes strategy tracking directly on the chart.
Customizable Visuals 🎨
TP & SL line colors and styles (solid, dashed, dotted).
Fully adjustable signal labels (color, size, type).
Configurable stats table with background & text colors.
🔥 Advantages:
Complete tool for day trading and swing trading.
Clear visualization of critical risk/reward levels.
Automatic alerts for fast reaction without constant monitoring.
Integrated statistics for performance evaluation and strategy improvement.
Recommended for:
Traders using price action, intraday strategies, scalping, or swing trading, who want advanced risk management with visual signals and performance analytics on TradingView.

Ghost Protocol: Smart Money HUD [Ash_TheTrader]👻 GHOST PROTOCOL: The Institutional HUD
"Stop trading blind. Start seeing where the Smart Money is hiding."
Most indicators lag. They tell you what happened. Ghost Protocol tells you what is happening right now by combining two powerful concepts: Volume Absorption (Whale Defense) and Kinematic Physics (Price Velocity).
This is not just an indicator; it is a complete Heads-Up Display (HUD) for scalpers and day traders on NQ, ES, Gold, and Crypto.
🧠 The Concept: Why It Works
Retail traders lose money for two reasons:
Selling into a bottom (where Whales are absorbing orders).
Buying a fake breakout (where price lacks the energy to continue).
Ghost Protocol solves both by visualizing the invisible battle between aggressive orders (Retail) and passive limit orders (Institutions).
🛠️ The 3 Core Features
1. The "Ghost Walls" (Reversal Detector) 🛡️
What it is: Detects when massive volume hits the market but Price fails to progress. This is Absorption. A "Whale" is using a Limit Order Wall to absorb panic selling or FOMO buying.
The Visual:
🟢 Green Ghost Bubble + Beam: Buyers are absorbing sellers. (Bullish Wall).
🔴 Red Ghost Bubble + Beam: Sellers are absorbing buyers. (Bearish Wall).
Sticky Tech: The bubbles "stick" to the wicks perfectly, regardless of zoom level.
2. The "Velocity Terminal" (Breakout Validator) 🚀
What it is: A Physics Engine for price. It calculates Jerk (Change in Acceleration). Standard breakouts often fail, but a breakout with high "Jerk" (Surge) rarely comes back.
The Visual:
🟣 Plasma Purple Candle: Valid Breakout. Price is moving with high physical energy. Safe to follow.
⚪ Grey/Dull Candle: Fakeout. Price broke a level but lacks energy. The move is likely a trap.
3. The Smart Money Dashboard 💻
A sleek, "Classy" panel in the bottom right corner.
Monitors both engines simultaneously:
GHOST WALL: Scans for Reversals (Buy/Sell Walls).
VELOCITY: Scans for Momentum (Surge/Fakeout).
🎯 How to Trade This Script
Strategy A: The "Whale Reversal" (Scalping)
Step 1: Wait for price to push hard into a level.
Step 2 : A Ghost Wall (Ghost Icon 👻) appears.
Step 3 : A vertical Neon Beam lights up the background.
Action: Take the reversal immediately. Place stop loss just behind the bubble.
Strategy B: The "Physics Breakout" (Trend Following)
Step 1: Price breaks a key resistance or support level.
Step 2: Look at the candle color.
If it is Plasma Purple: ENTER. The physics engine confirms true momentum.
If it is Grey: WAIT. It is likely a fakeout designed to trap you.
⚙️ Settings & Customization
Bubble Distance: Adjust how close the Ghost bubbles sit to the candles.
Sensitivity: Tune the "Jerk Threshold" for the physics engine.
Visuals: Toggle the Background Beams, Dashboard size, and Neon colors to fit your dark/light mode setup.
Created by @Ash_TheTrader Trade with the Whales, not against them.
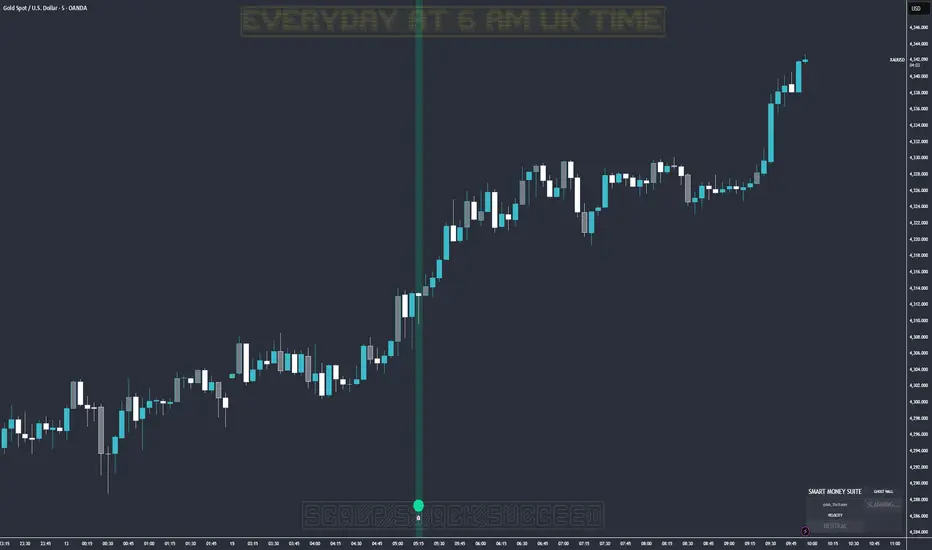
Trading Module [BackQuant]Trading Module
A modular overlay that lets you combine three core components, a Trend Model, an Impulse Model, and an optional Stop Loss framework, then layer in a multi-symbol RSI screener plus a full price action toolkit (market structure, FVGs, order blocks, volumetric S/R). Built for discretionary execution and study, not for blind automation.
────────────────────────────────────────────────────────────
What this script is
This indicator is designed like a “module picker”. Instead of forcing one opinionated system, it gives you selectable models that can be combined into a workflow:
1) Trend Model , answers “what side is the market biased to?”
2) Impulse Model , answers “is there currently expansion, pressure, or a momentum event worth paying attention to?”
3) Stop Loss Layer , answers “where are reasonable invalidation zones if I’m managing risk manually?”
4) RSI Screener , answers “what are my watchlist assets doing right now, on multiple timeframes, in one place?”
5) Price Action Concepts , answers “what structure levels, imbalances, institutional zones, and volume-based levels matter?”
You can run it as a lightweight overlay (trend + impulse only), or turn on the heavier price action stack when you want deeper context.
────────────────────────────────────────────────────────────
How to use it, the intended workflow
Step 1, pick your Trend Model
The trend model is your baseline directional filter. It is meant to reduce “random trading” by keeping you aligned with the dominant structure or momentum bias.
Trend Models (examples)
Typical usage:
- If the trend model reads bullish, you focus on long setups and avoid shorting into strength.
- If the trend model reads bearish, you focus on short setups and avoid catching bottoms.
- If the trend model is neutral or mixed, you reduce size or wait for confirmation.
What you can expect from the options (without exposing internal weighting or thresholds):
- Universal Trend+ , a composite trend regime model that blends multiple families of trend evidence. It is designed to be more robust than a single indicator and reduce “one-indicator failure modes”.
- EMA Cross , a classic fast vs slow trend bias. Simple, responsive, but can whipsaw in ranges.
- DEMA ATR , a smoother trend anchor that adapts to volatility. Often cleaner in chop than basic crosses.
- Relative Strength Overlay , a strength scoring style bias built from an RSI-style internal scoring process. Useful when you want “strength state” more than “moving average state”.
Color conventions:
- Long color and short color are user-defined, so you can keep consistent visuals across your BackQuant suite.
Step 2, pick your Impulse Model
Impulse is separate from trend on purpose. Trend answers direction, impulse answers timing. A market can be trending but not currently impulsing, or impulsing in a counter-trend squeeze.
Impulse Models (examples)
How to use impulse signals:
- Treat impulse as “permission” to engage, not as a standalone trade trigger.
- Best pairing is trend aligned impulse, meaning bullish trend model plus bullish impulse, bearish plus bearish.
- Counter-trend impulses can be used as warning signals, take-profit cues, or short-lived mean reversion opportunities, depending on your style.
The impulse options in this module are built around pressure and expansion detection. They are meant to identify moments where conditions shift from “noise” to “initiative activity”.
Step 3, choose a Stop Loss framework
This script includes optional stop visualization modes. These are not meant to be blindly used as a “one true stop”, they are tools for structuring invalidation around volatility or defined percentage bands.
Stop Loss (examples)
Stop loss options:
- None , no overlay.
- Dynamic , a volatility-aware band. Useful when you want stops to widen in high vol and tighten in low vol.
- Fixed , preset percentage bands. Useful for quick structure around risk units, scaling, or rule-based journaling.
- Bar-to-Bar , a micro-structure invalidation reference that uses the prior bar as a risk anchor. Useful for very tight management and fast invalidation.
How to apply them properly:
- Stops should be placed where the trade idea is wrong, not where you “feel pain”.
- A volatility stop is usually an environment stop, while a fixed stop is usually a plan stop.
- If you use impulses for entries, your stop should account for impulse volatility, otherwise you get stopped on the exact move you’re trying to capture.
────────────────────────────────────────────────────────────
RSI Screener module
This module is built for scanning multiple symbols and timeframes from one chart, without switching tabs.
RSI Screener (example)
What it does:
- Lets you define up to 10 symbols (defaults to major crypto pairs).
- Each slot can have its own timeframe.
- Computes an RSI value per symbol and assigns a directional state relative to a midline threshold.
- Displays a stacked overlay readout using a monospace label style for quick scanning.
How to use it:
- Set slots 1–5 as your majors, 6–10 as your rotation candidates.
- Use higher timeframes for regime, lower timeframes for timing.
- Use the midline threshold as a “trend bias” line, not an overbought or oversold line.
- Treat the screener as context, not a signal. Your chart model and price action still decide the trade.
Performance note:
- Screeners are heavy by nature because each symbol is a security() request. Keep the number of enabled slots reasonable if you are on lower-end hardware or running many scripts.
────────────────────────────────────────────────────────────
Price Action Concepts and Market Structure stack
This script includes a full price action toolkit intended to provide “where” context, levels, zones, and structural breaks, so the trend and impulse models are not operating in a vacuum.
Price Action Concepts / Market Structure (example)
This section is split into five major blocks:
1) Market Structure, Swing and Internal
You can enable swing structure and internal structure separately, with independent lookbacks.
- Swing structure tracks larger, slower pivots, better for macro trend structure.
- Internal structure tracks tighter pivots, better for entry timing and micro shifts.
It prints structure events as:
- BOS (Break of Structure), continuation-style break.
- MSB (Market Structure Break), shift-style break. Some traders call this CHoCH, here it’s presented as an MSB concept.
Usage:
- Swing BOS is good for confirming a larger regime.
- Internal structure is good for timing entries within the swing context.
- If internal flips but swing does not, treat it as a warning, not necessarily a full reversal.
2) Fair Value Gaps (FVG)
Optional imbalance boxes that highlight displacement zones.
Key controls:
- Timeframe selection (or current timeframe).
- How many to keep on chart.
- How far to extend them right.
Usage:
- FVGs are best treated as “areas of interest”, not guaranteed support/resistance.
- They help you frame where price might rebalance after an impulse event.
3) Order Blocks (OB)
Optional institutional-style zones detected from structure and candle logic, with filters.
Key controls:
- Fractal type (3 or 5) changes how “strict” structure detection is.
- Break method (close vs high/low) changes confirmation strictness.
- Optional filter with FVG distance to reduce low-quality blocks.
- Extend, delete-when-filled, and label options for chart hygiene.
Usage:
- OBs are strongest when aligned with swing context and confirmed by volume or displacement.
- Filled blocks are informational, they can be removed to reduce clutter.
4) Volumetric Support and Resistance
This module creates support and resistance “zones” based on high-volume pivot events, then manages them over time.
Key controls:
- Detection sensitivity, volume multiplier, and lookback period.
- Minimum distance between zones to avoid stacking duplicates.
- Remove broken, extend, and volume display toggles.
How to interpret:
- Levels are thicker zones, not single price lines.
- “Touches” are tracked as an interaction count, useful for identifying repeatedly defended or attacked zones.
- High-volume zones are visually emphasized, these tend to matter more than low volume pivots.
Usage:
- Pair volumetric levels with impulse signals, an impulse into a high-volume resistance zone is not the same as an impulse in open space.
- Use volumetric levels as structure anchors for invalidation and targets.
5) Alerts
The price action stack includes alerts for new levels, touches, breaks, and order block creation or interaction.
Use alerts for:
- Watchlist management, you get notified when price hits an area.
- Avoiding screen-watching, especially when you run multi-timeframe setups.
────────────────────────────────────────────────────────────
Core philosophy of the module
This indicator is not “one model to rule them all”. It is meant to let you build a trading process:
- Trend decides bias.
- Impulse decides engagement timing.
- Price action decides location and structure.
- Stops decide risk containment.
- Screener decides where to look.
If you only use one layer, you are throwing away most of the edge this style of framework is designed to create. The strength is in confluence and filtering.
────────────────────────────────────────────────────────────
Suggested presets
Preset A, clean trend-following overlay
- Trend Model, Universal Trend+ or DEMA ATR
- Impulse Model, either option
- Stop Loss, Dynamic
- Price action modules off (structure off, FVG off, OB off, volumetric off)
- Screener on (high timeframe)
Preset B, execution and structure mode
- Trend Model on
- Impulse Model on
- Market Structure on (swing + internal)
- FVG on (current timeframe or one higher)
- Order Blocks on with FVG filter
- Volumetric S/R on
- Stop Loss, Dynamic or Bar-to-Bar depending on speed
Preset C, watchlist scanner mode
- Screener on
- Minimal chart overlays on
- Use alerts for touches and breaks
- Only open charts that show alignment across trend and impulse
────────────────────────────────────────────────────────────
Notes and limitations
- This is a heavy script when multiple modules are enabled, because it draws objects and can request multiple symbols.
- The models are designed to be modular, so not every combination will be optimal for every market or timeframe.
────────────────────────────────────────────────────────────
Quick input map
Main Settings/Models
- Select Trend Model
- Select Impulse Model
- Select Stop Loss
- Show Screener
- Long/Short colors
Screener Settings
- Label size and offsets
- RSI length and midline
- Up to 10 symbol slots with per-slot timeframe and enable toggle
Market Structure
- Swing and internal structure mode and lookbacks
- Bull and bear colors
Fair Value Gaps
- Enable, count, timeframe, extend, colors
Order Blocks
- Enable, labels, fractal type, break method
- FVG filter and distance
- Lookback, extend, delete-when-filled, colors
Volumetric S/R
- Sensitivity, volume multiplier, analysis window
- Level limits, distance rules, extension and cleanup rules
- Volume display preferences
────────────────────────────────────────────────────────────
End note
This is intended as a full visual decision-support module for discretionary traders who want trend, timing, structure, and watchlist scanning in one place. Use it to build a repeatable process, then validate that process with proper testing and journaling before risking real capital.

"VWAP Multi-Timeframe Pro - 6 VWAPs + Session Analysis"═════════════════════════════════════════════════════════════════════════════
VWAP MULTI-TIMEFRAME PRO - COMPLETE TUTORIAL
By Alphaomega18 (OA18)
═══════════════════════════════════════════════════════════════════════════════
📌 DESCRIPTION
VWAP Multi-Timeframe Pro is a professional trading tool that simultaneously
displays 6 different VWAPs with customizable sessions and dynamic standard
deviation bands. Ideal for day trading, swing trading, and institutional
order flow analysis.
═══════════════════════════════════════════════════════════════════════════════
🎯 KEY FEATURES
✅ 3 CUSTOMIZABLE SESSION VWAPS
• Asia Session: Configurable hours (default 0h-8h Paris time)
• London Session: Configurable hours (default 8h-16h Paris time)
• NY Session: Configurable hours (default 15h30-22h Paris time)
• Each session automatically stops at end time
• Customizable colors and thickness for each session
✅ 3 STANDARD TIMEFRAME VWAPS
• Daily VWAP (resets at midnight)
• Weekly VWAP (resets on Monday)
• Monthly VWAP (resets on 1st of month)
✅ ADVANCED STANDARD DEVIATION BANDS
• 3 levels of standard deviation (1σ, 2σ, 3σ)
• Timeframe selection for bands (Asia/London/NY/Daily/Weekly/Monthly)
• Colored zones for quick extreme identification
• Perfect for mean reversion trading
✅ DYNAMIC LABELS
• Real-time value display
• Labels visible only during active sessions
• Adjustable size (tiny/small/normal/large)
• Automatic positioning
✅ ALERT SYSTEM
• Price / Daily VWAP crossover
• Price reaching ±3σ bands
• Real-time notifications
═══════════════════════════════════════════════════════════════════════════════
📖 INSTALLATION GUIDE
STEP 1: Add the indicator
1. Open TradingView
2. Click on "Indicators" at the top of the chart
3. Search for "VWAP Multi-Timeframe Pro" or "Alphaomega18"
4. Click to add the indicator to your chart
STEP 2: Basic configuration
1. Click on the ⚙️ (settings) icon of the indicator
2. You will see 8 parameter groups
3. Start by enabling/disabling the VWAPs you want
═══════════════════════════════════════════════════════════════════════════════
⚙️ DETAILED CONFIGURATION
┌─────────────────────────────────────────────────────────────────────────────┐
│ GROUP 1: VWAP ASIA SESSION │
├─────────────────────────────────────────────────────────────────────────────┤
│ • Show VWAP Asia: YES/NO │
│ • Start Hour: 0 (24h format, 0-23) │
│ • Start Minute: 0 (minutes, 0-59) │
│ • End Hour: 8 │
│ • End Minute: 0 │
│ • Color: Yellow (customizable) │
│ • Line Width: 2 (1-5) │
│ │
│ 💡 EXAMPLE: For Tokyo 1h-9h Paris → Start: 1h00, End: 9h00 │
└─────────────────────────────────────────────────────────────────────────────┘
┌─────────────────────────────────────────────────────────────────────────────┐
│ GROUP 2: VWAP LONDON SESSION │
├─────────────────────────────────────────────────────────────────────────────┤
│ • Show VWAP London: YES/NO │
│ • Start Hour: 8 │
│ • Start Minute: 0 │
│ • End Hour: 16 │
│ • End Minute: 0 │
│ • Color: Aqua (customizable) │
│ • Line Width: 2 (1-5) │
│ │
│ 💡 EXAMPLE: For LSE 9h-17h30 Paris → Start: 9h00, End: 17h30 │
└─────────────────────────────────────────────────────────────────────────────┘
┌─────────────────────────────────────────────────────────────────────────────┐
│ GROUP 3: VWAP NY SESSION │
├─────────────────────────────────────────────────────────────────────────────┤
│ • Show VWAP NY: YES/NO │
│ • Start Hour: 15 │
│ • Start Minute: 30 │
│ • End Hour: 22 │
│ • End Minute: 0 │
│ • Color: Orange (customizable) │
│ • Line Width: 2 (1-5) │
│ │
│ 💡 NOTE: US RTH = 9h30-16h00 ET = 15h30-22h00 Paris time │
└─────────────────────────────────────────────────────────────────────────────┘
┌─────────────────────────────────────────────────────────────────────────────┐
│ GROUPS 4-6: VWAP DAILY, WEEKLY, MONTHLY │
├─────────────────────────────────────────────────────────────────────────────┤
│ Each group has the same options: │
│ • Show VWAP: YES/NO │
│ • Color: Customizable │
│ • Line Width: 1-5 │
└─────────────────────────────────────────────────────────────────────────────┘
┌─────────────────────────────────────────────────────────────────────────────┐
│ GROUP 7: STANDARD DEVIATION BANDS │
├─────────────────────────────────────────────────────────────────────────────┤
│ • Show Bands: YES/NO │
│ • Bands Timeframe: Asia/London/NY/Daily/Weekly/Monthly │
│ • Standard Deviation 1: 1.0 (recommended) │
│ • Standard Deviation 2: 2.0 (recommended) │
│ • Standard Deviation 3: 3.0 (recommended) │
│ • Upper Band Color: Green (customizable) │
│ • Lower Band Color: Red (customizable) │
│ │
│ 💡 Bands are calculated on the selected VWAP │
└─────────────────────────────────────────────────────────────────────────────┘
┌─────────────────────────────────────────────────────────────────────────────┐
│ GROUP 8: DISPLAY │
├─────────────────────────────────────────────────────────────────────────────┤
│ • Show Labels: YES/NO │
│ • Label Size: tiny/small/normal/large │
└─────────────────────────────────────────────────────────────────────────────┘
═══════════════════════════════════════════════════════════════════════════════
🎨 PRESET CONFIGURATIONS
┏━━━━━━━━━━━━━━━━━━━━━━━━━━━━━━━━━━━━━━━━━━━━━━━━━━━━━━━━━━━━━━━━━━━━━━━━━┓
┃ CONFIGURATION 1: SCALPING / INTRADAY DAY TRADING ┃
┣━━━━━━━━━━━━━━━━━━━━━━━━━━━━━━━━━━━━━━━━━━━━━━━━━━━━━━━━━━━━━━━━━━━━━━━━━┫
┃ Chart timeframe: 1min - 5min ┃
┃ ┃
┃ Active VWAPs: ┃
┃ ☑ VWAP Asia : YES (to see overnight range) ┃
┃ ☑ VWAP London : YES (if trading EU session) ┃
┃ ☑ VWAP NY : YES (main US session) ┃
┃ ☑ VWAP Daily : YES (daily reference) ┃
┃ ☐ VWAP Weekly : NO ┃
┃ ☐ VWAP Monthly : NO ┃
┃ ┃
┃ Bands: ┃
┃ Timeframe: NY (if trading US session) ┃
┃ Levels: 1σ, 2σ, 3σ ┃
┃ ┃
┃ Labels: YES, size SMALL ┃
┗━━━━━━━━━━━━━━━━━━━━━━━━━━━━━━━━━━━━━━━━━━━━━━━━━━━━━━━━━━━━━━━━━━━━━━━━━┛
┏━━━━━━━━━━━━━━━━━━━━━━━━━━━━━━━━━━━━━━━━━━━━━━━━━━━━━━━━━━━━━━━━━━━━━━━━━┓
┃ CONFIGURATION 2: STANDARD DAY TRADING ┃
┣━━━━━━━━━━━━━━━━━━━━━━━━━━━━━━━━━━━━━━━━━━━━━━━━━━━━━━━━━━━━━━━━━━━━━━━━━┫
┃ Chart timeframe: 5min - 15min ┃
┃ ┃
┃ Active VWAPs: ┃
┃ ☐ VWAP Asia : NO ┃
┃ ☐ VWAP London : NO ┃
┃ ☑ VWAP NY : YES ┃
┃ ☑ VWAP Daily : YES ┃
┃ ☐ VWAP Weekly : NO ┃
┃ ☐ VWAP Monthly : NO ┃
┃ ┃
┃ Bands: ┃
┃ Timeframe: Daily ┃
┃ Levels: 1σ, 2σ, 3σ ┃
┃ ┃
┃ Labels: YES, size SMALL ┃
┗━━━━━━━━━━━━━━━━━━━━━━━━━━━━━━━━━━━━━━━━━━━━━━━━━━━━━━━━━━━━━━━━━━━━━━━━━┛
┏━━━━━━━━━━━━━━━━━━━━━━━━━━━━━━━━━━━━━━━━━━━━━━━━━━━━━━━━━━━━━━━━━━━━━━━━━┓
┃ CONFIGURATION 3: SWING TRADING ┃
┣━━━━━━━━━━━━━━━━━━━━━━━━━━━━━━━━━━━━━━━━━━━━━━━━━━━━━━━━━━━━━━━━━━━━━━━━━┫
┃ Chart timeframe: 1H - 4H ┃
┃ ┃
┃ Active VWAPs: ┃
┃ ☐ VWAP Asia : NO ┃
┃ ☐ VWAP London : NO ┃
┃ ☐ VWAP NY : NO ┃
┃ ☑ VWAP Daily : YES ┃
┃ ☑ VWAP Weekly : YES ┃
┃ ☐ VWAP Monthly : NO ┃
┃ ┃
┃ Bands: ┃
┃ Timeframe: Weekly ┃
┃ Levels: 1σ, 2σ, 3σ ┃
┃ ┃
┃ Labels: YES, size NORMAL ┃
┗━━━━━━━━━━━━━━━━━━━━━━━━━━━━━━━━━━━━━━━━━━━━━━━━━━━━━━━━━━━━━━━━━━━━━━━━━┛
┏━━━━━━━━━━━━━━━━━━━━━━━━━━━━━━━━━━━━━━━━━━━━━━━━━━━━━━━━━━━━━━━━━━━━━━━━━┓
┃ CONFIGURATION 4: MULTI-SESSION TRADING (FOREX, 24H FUTURES) ┃
┣━━━━━━━━━━━━━━━━━━━━━━━━━━━━━━━━━━━━━━━━━━━━━━━━━━━━━━━━━━━━━━━━━━━━━━━━━┫
┃ Chart timeframe: 15min - 1H ┃
┃ ┃
┃ Active VWAPs: ┃
┃ ☑ VWAP Asia : YES ┃
┃ ☑ VWAP London : YES ┃
┃ ☑ VWAP NY : YES ┃
┃ ☑ VWAP Daily : YES ┃
┃ ☐ VWAP Weekly : NO ┃
┃ ☐ VWAP Monthly : NO ┃
┃ ┃
┃ Bands: ┃
┃ Timeframe: Daily ┃
┃ Levels: 1σ, 2σ, 3σ ┃
┃ ┃
┃ Labels: YES, size SMALL ┃
┗━━━━━━━━━━━━━━━━━━━━━━━━━━━━━━━━━━━━━━━━━━━━━━━━━━━━━━━━━━━━━━━━━━━━━━━━━┛
═══════════════════════════════════════════════════════════════════════════════
📊 SIGNAL INTERPRETATION
┌─────────────────────────────────────────────────────────────────────────────┐
│ PRICE POSITION RELATIVE TO VWAP │
├─────────────────────────────────────────────────────────────────────────────┤
│ Price > VWAP → BULLISH TREND (bulls in control) │
│ Price < VWAP → BEARISH TREND (bears in control) │
│ Price = VWAP → EQUILIBRIUM ZONE (indecision) │
│ Price oscillates → RANGE / CONSOLIDATION │
└─────────────────────────────────────────────────────────────────────────────┘
┌─────────────────────────────────────────────────────────────────────────────┐
│ STANDARD DEVIATION BANDS SIGNALS │
├─────────────────────────────────────────────────────────────────────────────┤
│ Price at +1σ → Normal bullish extension │
│ Price at +2σ → OVERBOUGHT - possible reversal │
│ Price at +3σ → EXTREME OVERBOUGHT - high probability return to VWAP │
│ │
│ Price at -1σ → Normal bearish extension │
│ Price at -2σ → OVERSOLD - possible reversal │
│ Price at -3σ → EXTREME OVERSOLD - high probability return to VWAP │
└─────────────────────────────────────────────────────────────────────────────┘
┌─────────────────────────────────────────────────────────────────────────────┐
│ VWAP CONFLUENCE (POWERFUL SIGNALS) │
├─────────────────────────────────────────────────────────────────────────────┤
│ 3+ VWAPs aligned → VERY STRONG TREND │
│ VWAPs converging → MAJOR SUPPORT/RESISTANCE ZONE │
│ VWAPs diverging → CONSOLIDATION ZONE │
│ Price between 2 → CRITICAL DECISION ZONE │
└─────────────────────────────────────────────────────────────────────────────┘
═══════════════════════════════════════════════════════════════════════════════
💡 TRADING STRATEGIES
╔═════════════════════════════════════════════════════════════════════════════╗
║ STRATEGY 1: MEAN REVERSION ║
╠═════════════════════════════════════════════════════════════════════════════╣
║ TIMEFRAME: 5min - 15min ║
║ VWAP USED: Daily or NY Session ║
║ ║
║ LONG ENTRY RULES: ║
║ 1. Price touches -2σ or -3σ band ║
║ 2. Wait for rejection candle (hammer, pin bar) ║
║ 3. Volume above average ║
║ 4. Enter LONG above rejection candle high ║
║ ║
║ SHORT ENTRY RULES: ║
║ 1. Price touches +2σ or +3σ band ║
║ 2. Wait for rejection candle (shooting star, pin bar) ║
║ 3. Volume above average ║
║ 4. Enter SHORT below rejection candle low ║
║ ║
║ MANAGEMENT: ║
║ • Stop Loss: Beyond ±3σ band ║
║ • Take Profit: Return to VWAP (TP1), opposite VWAP (TP2) ║
║ • Risk/Reward: Minimum 1:2 ║
╚═════════════════════════════════════════════════════════════════════════════╝
╔═════════════════════════════════════════════════════════════════════════════╗
║ STRATEGY 2: TREND FOLLOWING ║
╠═════════════════════════════════════════════════════════════════════════════╣
║ TIMEFRAME: 15min - 1H ║
║ VWAP USED: Daily + Weekly ║
║ ║
║ LONG ENTRY RULES: ║
║ 1. Price > Daily VWAP AND > Weekly VWAP (confirmed trend) ║
║ 2. Wait for pullback to Daily VWAP ║
║ 3. Price rejects VWAP upward (doesn't break) ║
║ 4. Enter LONG on rejection ║
║ ║
║ SHORT ENTRY RULES: ║
║ 1. Price < Daily VWAP AND < Weekly VWAP (confirmed trend) ║
║ 2. Wait for pullback to Daily VWAP ║
║ 3. Price rejects VWAP downward (doesn't break) ║
║ 4. Enter SHORT on rejection ║
║ ║
║ MANAGEMENT: ║
║ • Stop Loss: Below/above Daily VWAP ║
║ • Take Profit: +1σ/+2σ bands or key support/resistance ║
║ • Trailing Stop: Use VWAP as dynamic trailing ║
╚═════════════════════════════════════════════════════════════════════════════╝
╔═════════════════════════════════════════════════════════════════════════════╗
║ STRATEGY 3: BREAKOUT CONFIRMATION ║
╠═════════════════════════════════════════════════════════════════════════════╣
║ TIMEFRAME: 5min - 30min ║
║ VWAP USED: NY Session + Daily ║
║ ║
║ LONG ENTRY RULES: ║
║ 1. Price consolidates around VWAP (range) ║
║ 2. Breakout above VWAP with HIGH VOLUME ║
║ 3. Simultaneous break of NY VWAP AND Daily VWAP ║
║ 4. Pullback test of VWAP (now support) ║
║ 5. Enter LONG on pullback rejection ║
║ ║
║ SHORT ENTRY RULES: ║
║ 1. Price consolidates around VWAP (range) ║
║ 2. Breakout below VWAP with HIGH VOLUME ║
║ 3. Simultaneous break of NY VWAP AND Daily VWAP ║
║ 4. Pullback test of VWAP (now resistance) ║
║ 5. Enter SHORT on pullback rejection ║
║ ║
║ MANAGEMENT: ║
║ • Stop Loss: Return to other side of VWAP ║
║ • Take Profit: ±2σ bands or measured move from range ║
║ • Failed breakout: Exit immediately if back in range ║
╚═════════════════════════════════════════════════════════════════════════════╝
╔═════════════════════════════════════════════════════════════════════════════╗
║ STRATEGY 4: SESSION HANDOFF ║
╠═════════════════════════════════════════════════════════════════════════════╣
║ TIMEFRAME: 5min - 15min ║
║ VWAP USED: Asia + London + NY ║
║ ║
║ CONCEPT: ║
║ Observe how each session respects or breaks the previous session's VWAP. ║
║ A break indicates sentiment change. ║
║ ║
║ LONG EXAMPLE: ║
║ 1. Asia Session: Price ranges around Asia VWAP ║
║ 2. London Open (8h): Price breaks Asia VWAP upward ║
║ 3. London VWAP forms above Asia VWAP ║
║ 4. NY Open (15h30): Price respects London VWAP (doesn't break) ║
║ 5. BULLISH SIGNAL: All 3 sessions aligned bullish ║
║ 6. Enter LONG on pullback to NY VWAP ║
║ ║
║ MANAGEMENT: ║
║ • Stop: Below current session VWAP ║
║ • Target: +2σ band or previous session high ║
║ • Invalid if: Price breaks below all session VWAPs ║
╚═════════════════════════════════════════════════════════════════════════════╝
═══════════════════════════════════════════════════════════════════════════════
🔔 ALERT CONFIGURATION
STEP 1: Create an alert
1. Click on "Alerts" button (alarm icon) top right
2. Click "Create alert"
3. In "Condition", select "VWAP Multi-Timeframe Pro"
STEP 2: Choose alert type
• Price > Daily VWAP: Alert when price crosses Daily VWAP upward
• Price < Daily VWAP: Alert when price crosses Daily VWAP downward
• Price at +3σ: Alert when price reaches extreme upper band
• Price at -3σ: Alert when price reaches extreme lower band
STEP 3: Configure alert
• Frequency: "Once per bar close" (recommended)
• Expiration: Set according to your needs
• Actions: Popup + Email + Mobile notification
RECOMMENDED ALERTS FOR DAY TRADING:
✓ Price crosses Daily VWAP (up and down)
✓ Price at ±3σ on NY Session VWAP
✓ Combine with other indicators for confirmation
═══════════════════════════════════════════════════════════════════════════════
💼 SPECIFIC USE CASES
┏━━━━━━━━━━━━━━━━━━━━━━━━━━━━━━━━━━━━━━━━━━━━━━━━━━━━━━━━━━━━━━━━━━━━━━━━━┓
┃ TRADING MNQ (E-MINI NASDAQ 100) ┃
┣━━━━━━━━━━━━━━━━━━━━━━━━━━━━━━━━━━━━━━━━━━━━━━━━━━━━━━━━━━━━━━━━━━━━━━━━━┫
┃ Optimal configuration: ┃
┃ • Timeframe: 5min ┃
┃ • VWAP Asia: 0h-8h (see overnight range) ┃
┃ • VWAP NY: 15h30-22h (RTH session) ┃
┃ • VWAP Daily: Active ┃
┃ • Bands: NY Session, 1σ/2σ/3σ ┃
┃ ┃
┃ Strategy: ┃
┃ 1. At 15h30: Observe if price respects or breaks Asia VWAP ┃
┃ 2. Enter in NY VWAP direction if confluence with Daily ┃
┃ 3. Use ±2σ bands for targets ┃
┃ 4. Stop below/above NY VWAP ┃
┗━━━━━━━━━━━━━━━━━━━━━━━━━━━━━━━━━━━━━━━━━━━━━━━━━━━━━━━━━━━━━━━━━━━━━━━━━┛
┏━━━━━━━━━━━━━━━━━━━━━━━━━━━━━━━━━━━━━━━━━━━━━━━━━━━━━━━━━━━━━━━━━━━━━━━━━┓
┃ TRADING FOREX EUR/USD ┃
┣━━━━━━━━━━━━━━━━━━━━━━━━━━━━━━━━━━━━━━━━━━━━━━━━━━━━━━━━━━━━━━━━━━━━━━━━━┫
┃ Optimal configuration: ┃
┃ • Timeframe: 15min ┃
┃ • VWAP Asia: 0h-8h ┃
┃ • VWAP London: 8h-16h (most liquid EUR/USD session) ┃
┃ • VWAP NY: 14h-22h (US overlap) ┃
┃ • Bands: London Session ┃
┃ ┃
┃ Strategy: ┃
┃ 1. London Session (8h): Trade in Asia breakout direction ┃
┃ 2. NY Session (14h): Observe London/NY VWAP confluence ┃
┃ 3. Exit before 22h (end of liquidity) ┃
┗━━━━━━━━━━━━━━━━━━━━━━━━━━━━━━━━━━━━━━━━━━━━━━━━━━━━━━━━━━━━━━━━━━━━━━━━━┛
┏━━━━━━━━━━━━━━━━━━━━━━━━━━━━━━━━━━━━━━━━━━━━━━━━━━━━━━━━━━━━━━━━━━━━━━━━━┓
┃ TRADING US STOCKS (AAPL, TSLA, etc.) ┃
┣━━━━━━━━━━━━━━━━━━━━━━━━━━━━━━━━━━━━━━━━━━━━━━━━━━━━━━━━━━━━━━━━━━━━━━━━━┫
┃ Optimal configuration: ┃
┃ • Timeframe: 5min or 15min ┃
┃ • VWAP NY: 15h30-22h (RTH only) ┃
┃ • VWAP Daily: Active ┃
┃ • VWAP Weekly: Active (for swing) ┃
┃ • Bands: Daily ┃
┃ ┃
┃ Strategy: ┃
┃ 1. Pre-market: Analyze sentiment vs Daily VWAP ┃
┃ 2. Open (15h30): Confirm direction with NY VWAP ┃
┃ 3. Institutional orders visible at Daily/Weekly VWAP confluence ┃
┗━━━━━━━━━━━━━━━━━━━━━━━━━━━━━━━━━━━━━━━━━━━━━━━━━━━━━━━━━━━━━━━━━━━━━━━━━┛
═══════════════════════════════════════════════════════════════════════════════
⚠️ COMMON MISTAKES TO AVOID
❌ MISTAKE 1: Trading against all VWAPs
→ If price < Daily, Weekly, Monthly VWAP → DON'T buy
→ Wait for confluence or trend change
❌ MISTAKE 2: Ignoring sessions
→ NY VWAP at 8am has NO validity
→ Respect session start/end times
❌ MISTAKE 3: Over-trading VWAP touches
→ Every VWAP touch is NOT a signal
→ Wait for confluence + volume + pattern
❌ MISTAKE 4: Wrong time configuration
→ Check your timezone
→ Adjust hours according to your location
❌ MISTAKE 5: Neglecting volume
→ VWAP crossover without volume is WEAK
→ Volume > average = more reliable signal
❌ MISTAKE 6: Forgetting HTF context
→ Always check higher timeframe
→ Daily chart for intraday, Weekly for swing
❌ MISTAKE 7: Too tight stop loss
→ Place stop BEYOND ±3σ band
→ Give position room to breathe
❌ MISTAKE 8: Using only VWAP
→ COMBINE with: RSI, Volume Profile, Support/Resistance
→ VWAP is a tool, not a complete strategy
═══════════════════════════════════════════════════════════════════════════════
📈 OPTIMIZATION & BACKTESTING
TIPS TO IMPROVE YOUR RESULTS:
1. JOURNAL YOUR TRADES
• Note which VWAP configuration worked
• Which session gives best results
• Which band level (1σ/2σ/3σ) is optimal
2. TEST DIFFERENT PERIODS
• Modify session hours according to your asset
• Crypto: Different 24h sessions
• EU Stocks: Adapt to XETRA/CAC hours
3. ADAPT BANDS
• Volatile assets: Use 1.5σ, 2.5σ, 3.5σ
• Calm assets: Keep standard 1σ, 2σ, 3σ
4. COMBINE WITH OTHER TOOLS
• Volume Profile (POC, VAH, VAL)
• Market Delta / Order Flow
• Horizontal Support/Resistance
• Fibonacci retracements
═══════════════════════════════════════════════════════════════════════════════
🆘 SUPPORT & FAQ
Q: Are times in local time or UTC?
A: Times are in your TradingView chart's timezone.
For Paris, use French local time.
Q: Can I use more than 3 sessions?
A: This version offers 3 customizable sessions. For more, duplicate
the indicator with different configurations.
Q: Does VWAP reset automatically?
A: Yes! Each VWAP resets automatically:
• Sessions: At defined start time
• Daily: At midnight
• Weekly: On Monday
• Monthly: On 1st of month
Q: Why isn't my session VWAP displaying?
A: Check:
1. Session is enabled in settings
2. You are WITHIN session time
3. Hours are correctly configured
Q: Can I export my configurations?
A: Yes, TradingView allows saving indicator templates.
Q: Compatible with free TradingView?
A: Yes, indicator works on all TradingView plans.
═══════════════════════════════════════════════════════════════════════════════
Version 1.0 | © 2025 Alphaomega18
Indicator developed for professional and passionate traders
═══════════════════════════════════════════════════════════════════════════════

KIMATIX LITE Crypto ScannerKIMATIX Crypto Scanner
This indicator visualizes institutional demand and supply zones based on an automated volume profile calculation.
The Lite version is designed for context and market structure only:
Displays dynamic long and short zones
Helps identify high-interest price areas
Intended for bias and location, not execution
No signals, alerts, confirmations, or execution logic are included.
All advanced filters, timing logic, probability validation,
and trade management are reserved for the full version.
Use this tool to understand where price matters — not when to trade.
The full version is distributed separately.
More information can be found here:
whop.com
The Golden Reaper 🟡 THE GOLDEN REAPER
HTF OTE + EMA50 — Futures Scalping Framework
The Golden Reaper is a high-timeframe execution framework designed specifically for futures scalpers who trade with precision, patience, and structure.
This indicator focuses on HTF market structure, Optimal Trade Entry (OTE) zones, and equilibrium (50%) reclaim confirmation to identify high-probability execution areas for fast, controlled scalps.
It is not a signal spam tool.
It is a framework built for disciplined traders who wait for price to come to them.
⸻
🔑 Designed For
✔ Futures markets (ES, NQ, MNQ, MES, GC, MGC, CL, etc.)
✔ Scalpers & intraday traders
✔ 1H structure → 5m / 1m execution
✔ Traders who prefer few high-quality setups
⸻
🧠 Core Logic (How It Works)
1️⃣ High-Timeframe Structure (HTF)
The indicator identifies the most recent HTF swing high and low to define the active trading leg.
2️⃣ OTE Zone (Premium / Discount)
Price is expected to react within the OTE zone where liquidity is commonly targeted.
3️⃣ Golden Entry (EQ 50%)
The 50% equilibrium level is marked as the Golden Entry.
Price must reclaim this level for a setup to become valid.
4️⃣ Golden Execution Zone
After reclaim, a golden execution zone appears to define where entries are allowed.
5️⃣ EMA 50 Trend Filter
Trades are taken only in the direction of the HTF EMA 50 to avoid counter-trend scalps.
⸻
⚡ How Futures Scalpers Use It
Recommended Timeframes
• HTF Structure: 1 Hour
• Execution: 5 Minute / 1 Minute
Process
• Wait for price to reach the OTE zone
• Allow the setup to arm
• Enter only after price reclaims the Golden Entry
• Execute within the Golden Execution Zone
• Manage stops and targets manually
This approach helps scalpers:
✔ Avoid chasing price
✔ Reduce over-trading
✔ Improve entry precision
✔ Maintain consistency
⸻
🔔 Alerts Included
• OTE Touched – Setup is armed
• C-Reclaim Confirmed – Entry condition met
(Alerts are designed to assist — not replace — trader judgment.)
⸻
⚠️ Important Notes
• Designed for futures markets only
• Best used with price action confirmation
• No built-in stop loss or take profit (manual risk management required)
• Not financial advice
⸻
🧬 Who This Indicator Is For
✔ Futures scalpers
✔ ICT / Smart Money traders
✔ Structure-based traders
✔ Traders who value patience over frequency
❌ Not for:
• Signal chasers
• Indicator stacking
• Automated trading
• Beginners who want instant entries
⸻
🟡 Created By
ChartReaper / Tactiko
Instagram:
@officialchartreaper
@tactiko
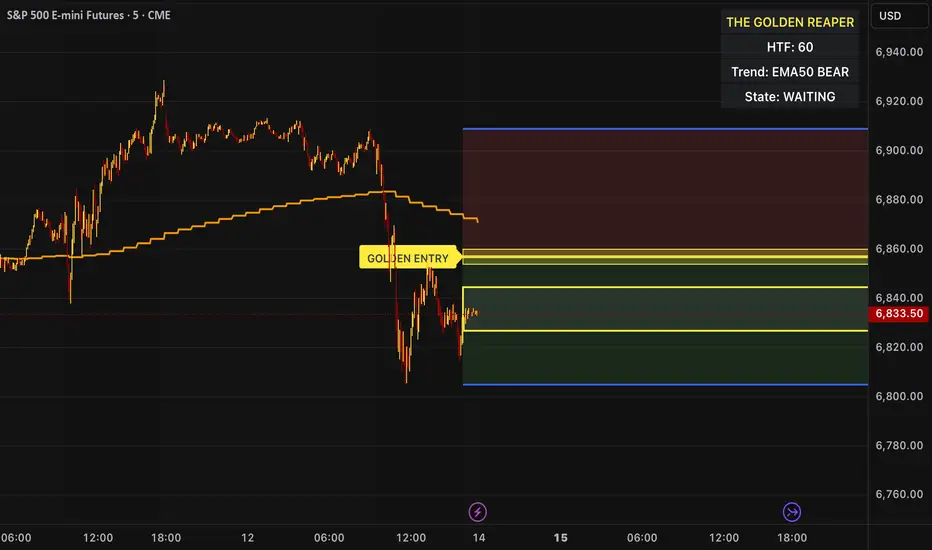
One Candle 5min Retest Strategy🚀 One Candle 5min Retest Strategy (OCRS) – Your Morning on Autopilot
Less drawing, more trading.
Sick of drawing the opening range manually every single morning? Or catching yourself FOMOing into trades before the candle even closes? The OCRS Indicator automates the heavy lifting for the "First Candle" / "One Candle Retest" strategy (Scarface Trades style).
It’s basically a tool to keep you honest and save you time.
🧠 Why use it?
Forced Patience: The range lines stay PURPLE while the first 5 minutes are playing out. That’s your sign to chill and wait. No early entries.
Instant Levels: Once the range closes, the lines snap to BLUE (High) and ORANGE (Low) . You see the levels immediately.
The "Zone" Finder: If price breaks out, the script finds the specific Order Block for you (the last contrary candle before the move) and draws the retest box.
Bullish Breakout? Catches the last red candle.
Bearish Breakout? Catches the last green candle.
No Confusion: Markets are messy. If price fakes a pump and then dumps, the indicator keeps the old zone and draws the new one. You see exactly what's happening.
🛠️ The Good Stuff:
Set and Forget: Auto-syncs to NY Open (09:30 EST). Works on any timeframe.
Clean Charts: Lines only run for 90 minutes. No clutter for the rest of the day.
Day Separator: A simple vertical line marks the next session. Perfect for backtesting —you know exactly when to hit pause before the next open.
No Wicks: Boxes only paint when the candle actually closes outside the range. Zero fakeouts.
Your Style: Turn boxes on/off or change colors to match your vibe.
🎯 How to trade it:
Chill for the first 5 minutes (09:30 - 09:35 NY). Purple lines = hands off.
Watch for the break.
Candle CLOSES above Blue? Wait for the Blue Box .
Candle CLOSES below Orange? Wait for the Orange Box .
The Setup: Wait for price to tap back into the box.
Entry: Find your confirmation inside that zone and take the trade.
Keep your morning simple. Install OCRS and trade with clarity.
Note: This is just a tool to help with the strategy. Risk management is still on you.

Bollinger Bands Forecast [QuantAlgo]🟢 Overview
Bollinger Bands are widely recognized for mapping volatility boundaries around price action, but they inherently lag behind market movement since they calculate based on completed bars. The Bollinger Bands Forecast addresses this limitation by adding a predictive layer that attempts to project where the upper band, lower band, and basis line might position in the future. The indicator provides three unique analytical models for generating these projections: one examines swing structure and breakout patterns, another integrates volume flow and accumulation metrics, while the third applies statistical trend fitting. Traders can select whichever methodology aligns with their market view or trading style to gain visibility into potential future volatility zones that could inform position planning, risk management, and timing decisions across various asset classes and timeframes.
🟢 How It Works
The core calculation begins with traditional Bollinger Bands: a moving average basis line (configurable as SMA, EMA, SMMA/RMA, WMA, or VWMA) with upper and lower bands positioned at a specified number of standard deviations away. The forecasting extension works by first generating predicted price values for upcoming bars using the selected method. These projected prices then feed into a rolling calculation that simulates how the basis line would update bar by bar, respecting the mathematical properties of the chosen moving average type. As each new forecasted price enters the calculation window, the oldest historical price drops out, mimicking the natural progression of the moving average. The system recalculates standard deviation across this evolving price window and applies the multiplier to determine where upper and lower bands would theoretically sit. This process repeats for each of the forecasted bars, creating a connected chain of potential future band positions that render as dashed lines on the chart.
🟢 Key Features
1. Market Structure Model
This forecasting approach interprets price through the lens of swing analysis and structural patterns. The algorithm identifies pivot highs and lows across a definable lookback window, then tracks whether price is forming higher highs and higher lows (bullish structure) or lower highs and lower lows (bearish structure). The system looks for break of structure (BOS) when price pushes beyond a previous swing point in the trending direction, or change of character (CHoCH) when price starts creating opposing swing patterns.
When projecting future prices, the model considers current distance from recent swing levels and the strength of the established trend (measured by counting higher highs versus lower lows). If bullish structure dominates and price sits near a swing low, the forecast biases upward. Conversely, bearish structure near a swing high produces downward bias. ATR scaling ensures the projection magnitude relates to actual market volatility.
Practical Implications for Traders:
Useful when you trade based on swing points and structural breaks
The Structure Influence slider (0 to 1) lets you dial in how much weight structure analysis carries versus pure trend
Helps visualize where bands could form around key structural levels you're watching
Works better in trending conditions where structure patterns are clearer
Might be less effective in choppy, sideways markets without defined swings
2. Volume-Weighted Model
This method attempts to incorporate volume flow into the price forecast. It combines three volume-based metrics: On-Balance Volume (OBV) to track cumulative buying/selling pressure, the Accumulation/Distribution Line to measure money flow, and volume-weighted price changes to emphasize moves that occur on high volume. The algorithm calculates the slope of these indicators to determine if volume is confirming price direction or diverging from it.
Volume spikes above a configurable threshold are flagged as potentially significant, with the direction of the spike (whether it occurred on an up bar or down bar) influencing the forecast. When OBV, A/D Line, and volume momentum all align in the same direction, the model projects stronger moves. When they conflict or show weak volume support, the forecast becomes more conservative.
Practical Implications for Traders:
Relevant if you use volume analysis to confirm price moves
More meaningful in markets with reliable volume data
The Volume Influence parameter (0 to 1) controls how much volume factors into the projection
Volume Spike Threshold adjusts sensitivity to what constitutes unusual volume
Helps spot scenarios where volume doesn't support a move, suggesting possible consolidation
Might be less effective in low-liquidity instruments or markets where volume reporting is unreliable
3. Linear Regression Model
The simplest of the three methods, linear regression fits a straight line through recent price data using least-squares mathematics and extends that line forward. This creates a clean trend projection without conditional logic or interpretation of market characteristics. The forecast simply asks: if the recent trend continues at its current rate of change, where would price be in 10 or 20 bars?
Practical Implications for traders:
Provides a neutral, mathematical baseline for comparison
Works well when trends are steady and consistent
Can be useful for backtesting since results are deterministic
Requires minimal configuration beyond lookback period
Might not adapt to changing market conditions as dynamically as the other methods
Best suited for trending markets rather than ranging or volatile conditions
🟢 Universal Applications Across All Models
Regardless of which forecasting method you select, the indicator projects future Bollinger Band positions that may help with:
▶ Pre-planning entries and exits: See where potential support (lower band) or resistance (upper band) might develop before price gets there
▶ Volatility context: Observe whether forecasted bands are widening (suggesting potential volatility expansion) or narrowing (possible compression or squeeze setup)
▶ Target setting: Reference projected band levels when determining profit targets or stop placement
▶ Mean reversion scenarios: Visualize potential paths back toward the basis line when price extends to a band extreme
▶ Breakout anticipation: Consider where upper or lower bands might sit if price begins a strong directional move
▶ Strategy development: Build trading rules around forecasted band interactions, such as entering when price is projected to return to the basis or exit when forecasts show band expansion
▶ Method comparison: Switch between the three forecasting models to see if they agree or diverge, potentially using consensus as a confidence filter
It's critical to understand that these forecasts are projections based on recent market behavior. Markets are complex systems influenced by countless factors that cannot be captured in a technical calculation or predicted perfectly. The forecasted bands represent one possible scenario of how volatility might unfold, so actual price action may still diverge from these projections. Past performance and historical patterns provide no assurance of future results. Use these forecasts as one input within a broader trading framework that includes proper risk management, position sizing, and multiple forms of analysis. The value lies not in prediction accuracy but in helping you think probabilistically about potential market states and plan accordingly.

LuxyEnergyIndexThe Luxy Energy Index (LEI) library provides functions to measure price movement exhaustion by analyzing three dimensions: Extension (distance from fair value), Velocity (speed of movement), and Volume (confirmation level).
LEI answers a different question than traditional momentum indicators: instead of "how far has price gone?" (like RSI), LEI asks "how tired is this move?"
This library allows Pine Script developers to integrate LEI calculations into their own indicators and strategies.
How to Import
//@version=6
indicator("My Indicator")
import OrenLuxy/LuxyEnergyIndex/1 as LEI
Main Functions
`lei(src)` → float
Returns the LEI value on a 0-100 scale.
src (optional): Price source, default is `close`
Returns : LEI value (0-100) or `na` if insufficient data (first 50 bars)
leiValue = LEI.lei()
leiValue = LEI.lei(hlc3) // custom source
`leiDetailed(src)` → tuple
Returns LEI with all component values for detailed analysis.
= LEI.leiDetailed()
Returns:
`lei` - Final LEI value (0-100)
`extension` - Distance from VWAP in ATR units
`velocity` - 5-bar price change in ATR units
`volumeZ` - Volume Z-Score
`volumeModifier` - Applied modifier (1.0 = neutral)
`vwap` - VWAP value used
Component Functions
| Function | Description | Returns |
|-----------------------------------|---------------------------------|---------------|
| `calcExtension(src, vwap)` | Distance from VWAP / ATR | float |
| `calcVelocity(src)` | 5-bar price change / ATR | float |
| `calcVolumeZ()` | Volume Z-Score | float |
| `calcVolumeModifier(volZ)` | Volume modifier | float (≥1.0) |
| `getVWAP()` | Auto-detects asset type | float |
Signal Functions
| Function | Description | Returns |
|---------------------------------------------|----------------------------------|-----------|
| `isExhausted(lei, threshold)` | LEI ≥ threshold (default 70) | bool |
| `isSafe(lei, threshold)` | LEI ≤ threshold (default 30) | bool |
| `crossedExhaustion(lei, threshold)` | Crossed into exhaustion | bool |
| `crossedSafe(lei, threshold)` | Crossed into safe zone | bool |
Utility Functions
| Function | Description | Returns |
|----------------------------|-------------------------|-----------|
| `getZone(lei)` | Zone name | string |
| `getColor(lei)` | Recommended color | color |
| `hasEnoughHistory()` | Data check | bool |
| `minBarsRequired()` | Required bars | int (50) |
| `version()` | Library version | string |
Interpretation Guide
| LEI Range | Zone | Meaning |
|-------------|--------------|--------------------------------------------------|
| 0-30 | Safe | Low exhaustion, move may continue |
| 30-50 | Caution | Moderate exhaustion |
| 50-70 | Warning | Elevated exhaustion |
| 70-100 | Exhaustion | High exhaustion, increased reversal risk |
Example: Basic Usage
//@version=6
indicator("LEI Example", overlay=false)
import OrenLuxy/LuxyEnergyIndex/1 as LEI
// Get LEI value
leiValue = LEI.lei()
// Plot with dynamic color
plot(leiValue, "LEI", LEI.getColor(leiValue), 2)
// Reference lines
hline(70, "High", color.red)
hline(30, "Low", color.green)
// Alert on exhaustion
if LEI.crossedExhaustion(leiValue) and barstate.isconfirmed
alert("LEI crossed into exhaustion zone")
Technical Details
Fixed Parameters (by design):
Velocity Period: 5 bars
Volume Period: 20 bars
Z-Score Period: 50 bars
ATR Period: 14
Extension/Velocity Weights: 50/50
Asset Support:
Stocks/Forex: Uses Session VWAP (daily reset)
Crypto: Uses Rolling VWAP (50-bar window) - auto-detected
Edge Cases:
Returns `na` until 50 bars of history
Zero volume: Volume modifier defaults to 1.0 (neutral)
Credits and Acknowledgments
This library builds upon established technical analysis concepts:
VWAP - Industry standard volume-weighted price measure
ATR by J. Welles Wilder Jr. (1978) - Volatility normalization
Z-Score - Statistical normalization method
Volume analysis principles from Volume Spread Analysis (VSA) methodology
Disclaimer
This library is provided for **educational and informational purposes only**. It does not constitute financial advice. Past performance does not guarantee future results. The exhaustion readings are probabilistic indicators, not guarantees of price reversal. Always conduct your own research and use proper risk management when trading.

Open Interest Z-Score [BackQuant]Open Interest Z-Score
A standardized pressure gauge for futures positioning that turns multi venue open interest into a Z score, so you can see how extreme current positioning is relative to its own history and where leverage is stretched, decompressing, or quietly re loading.
What this is
This indicator builds a single synthetic open interest series by aggregating futures OI across major derivatives venues, then standardises that aggregated OI into a rolling Z score. Instead of looking at raw OI or a simple change, you get a normalized signal that says "how many standard deviations away from normal is positioning right now", with optional smoothing, reference bands, and divergence detection against price.
You can render the Z score in several plotting modes:
Line for a clean, classic oscillator.
Colored line that encodes both sign and momentum of OI Z.
Oscillator histogram that makes impulses and compressions obvious.
The script also includes:
Aggregated open interest across Binance, Bybit, OKX, Bitget, Kraken, HTX, and Deribit, using multiple contract suffixes where applicable.
Choice of OI units, either coin based or converted to USD notional.
Standard deviation reference lines and adaptive extreme bands.
A flexible smoothing layer with multiple moving average types.
Automatic detection of regular and hidden divergences between price and OI Z.
Alerts for zero line and ±2 sigma crosses.
Aggregated open interest source
At the core is the same multi venue OI aggregation engine as in the OI RSI tool, adapted from NoveltyTrade's work and extended for this use case. The indicator:
Anchors on the current chart symbol and its base currency.
Loops over a set of exchanges, gated by user toggles:
Binance.
Bybit.
OKX.
Bitget.
Kraken.
HTX.
Deribit.
For each exchange, loops over several contract suffixes such as USDT.P, USD.P, USDC.P, USD.PM to cover the common perp and margin styles.
Requests OI candles for each exchange plus suffix pair into a small custom OI type that carries open, high, low and close of open interest.
Converts each OI stream into a common unit via the sw method:
In COIN mode, OI is normalized relative to the coin.
In USD mode, OI is scaled by price to approximate notional.
Exchange specific scaling factors are applied where needed to match contract multipliers.
Accumulates all valid OI candles into a single combined OI "candle" by summing open, high, low and close across venues.
The result is oiClose , a synthetic close for aggregated OI that represents cross venue positioning. If there is no valid OI data for the symbol after this process, the script throws a clear runtime error so you know the market is unsupported rather than quietly plotting nonsense.
How the Z score is computed
Once the aggregated OI close is available, the indicator computes a rolling Z score over a configurable lookback:
Define subject as the aggregated OI close.
Compute a rolling mean of this subject with EMA over Z Score Lookback Period .
Compute a rolling standard deviation over the same length.
Subtract the mean from the current OI and divide by the standard deviation.
This gives a raw Z score:
oi_z_raw = (subject − mean) ÷ stdDev .
Instead of plotting this raw value directly, the script passes it through a smoothing layer:
You pick a Smoothing Type and Smoothing Period .
Choices include SMA, HMA, EMA, WMA, DEMA, RMA, linear regression, ALMA, TEMA, and T3.
The helper ma function applies the chosen smoother to the raw Z score.
The result is oi_z , a smoothed Z score of aggregated open interest. A separate EMA with EMA Period is then applied on oi_z to create a signal line ma that can be used for crossovers and trend reads.
Plotting modes
The Plotting Type input controls how this Z score is rendered:
1) Line
In line mode:
The smoothed OI Z score is plotted as a single line using Base Line Color .
The EMA overlay is optionally plotted if Show EMA is enabled.
This is the cleanest view when you want to treat OI Z like a standard oscillator, watching for zero line crosses, swings, and divergences.
2) Colored Line
Colored line mode adds conditional color logic to the Z score:
If the Z score is above zero and rising, it is bright green, representing positive and strengthening positioning pressure.
If the Z score is above zero and falling, it shifts to a cooler cyan, representing positive but weakening pressure.
If the Z score is below zero and falling, it is bright red, representing negative and strengthening pressure (growing net de risking or shorting).
If the Z score is below zero and rising, it is dark red, representing negative but recovering pressure.
This mapping makes it easy to see not only whether OI is above or below its historical mean, but also whether that deviation is intensifying or fading.
3) Oscillator
Oscillator mode turns the Z score into a histogram:
The smoothed Z score is plotted as vertical columns around zero.
Column colors use the same conditional palette as colored line mode, based on sign and change direction.
The histogram base is zero, so bars extend up into positive Z and down into negative Z.
Oscillator mode is useful when you care about impulses in positioning, for example sharp jumps into positive Z that coincide with fast builds in leverage, or deep spikes into negative Z that show aggressive flushes.
4) None
If you only want reference lines, extreme bands, divergences, or alerts without the base oscillator, you can set plotting to None and keep the rest of the tooling active.
The EMA overlay respects plotting mode and only appears when a visible Z score line or histogram is present.
Reference lines and standard deviation levels
The Select Reference Lines input offers two styles:
Standard Deviation Levels
Plots small markers at zero.
Draws thin horizontal lines at +1, +2, −1 and −2 Z.
Acts like a classic Z score ladder, zero as mean, ±1 as normal band, ±2 as outer band.
This mode is ideal if you want a textbook statistical framing, using ±1 and ±2 sigma as standard levels for "normal" versus "extended" positioning.
Extreme Bands
Extreme bands build on the same ±1 and ±2 lines, then add:
Upper outer band between +3 and +4 Z.
Lower outer band between −3 and −4 Z.
Dynamic fill colors inside these bands:
If the Z score is positive, the upper band fill turns red with an alpha that scales with the magnitude of |Z|, capped at a chosen max strength. Stronger deviations towards +4 produce more opaque red fills.
If the Z score is negative, the lower band fill turns green with the same adaptive alpha logic, highlighting deep negative deviations.
Opposite side bands remain a faint neutral white when not in use, so they still provide structural context without shouting.
This creates a visual "danger zone" for position crowding. When the Z score enters these outer bands, open interest is many standard deviations away from its mean and you are dealing with rare but highly loaded positioning states.
Z score as a positioning pressure gauge
Because this is a Z score of aggregated open interest, it measures how unusual current positioning is relative to its own recent history, not just whether OI is rising or falling:
Z near zero means total OI is roughly in line with normal conditions for your lookback window.
Positive Z means OI is above its recent mean. The further above zero, the more "crowded" or extended positioning is.
Negative Z means OI is below its recent mean. Deep negatives often mark post flush environments where leverage has been cleared and the market is under positioned.
The smoothing options help control how much noise you want in the signal:
Short Z score lookback and short smoothing will react quickly, suited for short term traders watching intraday positioning shocks.
Longer Z score lookback with smoother MA types (EMA, RMA, T3) give a slower, more structural view of where the crowd sits over days to weeks.
Divergences between price and OI Z
The indicator includes automatic divergence detection on the Z score versus price, using pivot highs and lows:
You configure Pivot Lookback Left and Pivot Lookback Right to control swing sensitivity.
Pivots are detected on the OI Z series.
For each eligible pivot, the script compares OI Z and price at the last two pivots.
It looks for four patterns:
Regular Bullish – price makes a lower low, OI Z makes a higher low. This can indicate selling exhaustion in positioning even as price washes out. These are marked with a line and a label "ℝ" below the oscillator, in the bullish color.
Hidden Bullish – price makes a higher low, OI Z makes a lower low. This suggests continuation potential where price holds up while positioning resets. Marked with "ℍ" in the bullish color.
Regular Bearish – price makes a higher high, OI Z makes a lower high. This is a classic warning sign of trend exhaustion, where price pushes higher while OI Z fails to confirm. Marked with "ℝ" in the bearish color.
Hidden Bearish – price makes a lower high, OI Z makes a higher high. This is often seen in pullbacks within downtrends, where price retraces but positioning stretches again in the direction of the prevailing move. Marked with "ℍ" in the bearish color.
Each divergence type can be toggled globally via Show Detected Divergences . Internally, the script restricts how far back it will connect pivots, so you do not get stray signals linking very old structures to current bars.
Trading applications
Crowding and squeeze risk
Z scores are a natural way to talk about crowding:
High positive Z in aggregated OI means the market is running high leverage compared to its own norm. If price is also extended, the risk of a squeeze or sharp unwind rises.
Deep negative Z means leverage has been cleaned out. While it can be painful to sit through, this environment often sets up cleaner new trends, since there is less one sided positioning to unwind.
The extreme bands at ±3 to ±4 highlight the rare states where crowding is most intense. You can treat these events as regime markers rather than day to day noise.
Trend confirmation and fade selection
Combine Z score with price and trend:
Bull trends with positive and rising Z are supported by fresh leverage, usually more persistent.
Bull trends with flat or falling Z while price keeps grinding up can be more fragile. Divergences and extreme bands can help identify which edges you do not want to fade and which you might.
In downtrends, deep negative Z that stays pinned can mean persistent de risking. Once the Z score starts to mean revert back toward zero, it can mark the early stages of stabilization.
Event and liquidation context
Around major events, you often see:
Rapid spikes in Z as traders rush to position.
Reversal and overshoot as liquidations and forced de risking clear the book.
A move from positive extremes through zero into negative extremes as the market transitions from crowded to under exposed.
The Z score makes that path obvious, especially in oscillator mode, where you see a block of high positive bars before the crash, then a slab of deep negative bars after the flush.
Settings overview
Z Score group
Plotting Type – None, Line, Colored Line, Oscillator.
Z Score Lookback Period – window used for mean and standard deviation on aggregated OI.
Smoothing Type – SMA, HMA, EMA, WMA, DEMA, RMA, linear regression, ALMA, TEMA or T3.
Smoothing Period – length for the selected moving average on the raw Z score.
Moving Average group
Show EMA – toggle EMA overlay on Z score.
EMA Period – EMA length for the signal line.
EMA Color – color of the EMA line.
Thresholds and Reference Lines group
Select Reference Lines – None, Standard Deviation Levels, Extreme Bands.
Standard deviation lines at 0, ±1, ±2 appear in both modes.
Extreme bands add filled zones at ±3 to ±4 with adaptive opacity tied to |Z|.
Extra Plotting and UI
Base Line Color – default color for the simple line mode.
Line Width – thickness of the oscillator line.
Positive Color – positive or bullish condition color.
Negative Color – negative or bearish condition color.
Divergences group
Show Detected Divergences – master toggle for divergence plotting.
Pivot Lookback Left and Pivot Lookback Right – how many bars left and right to define a pivot, controlling divergence sensitivity.
Open Interest Source group
OI Units – COIN or USD.
Exchange toggles for Binance, Bybit, OKX, Bitget, Kraken, HTX, Deribit.
Internally, all enabled exchanges and contract suffixes are aggregated into one synthetic OI series.
Alerts included
The indicator defines alert conditions for several key events:
OI Z Score Positive – Z crosses above zero, aggregated OI moves from below mean to above mean.
OI Z Score Negative – Z crosses below zero, aggregated OI moves from above mean to below mean.
OI Z Score Enters +2σ – Z enters the +2 band and above, marking extended positive positioning.
OI Z Score Enters −2σ – Z enters the −2 band and below, marking extended negative positioning.
Tie these into your strategy to be notified when leverage moves from normal to extended states.
Notes
This indicator does not rely on price based oscillators. It is a statistical lens on cross venue open interest, which makes it a complementary tool rather than a replacement for your existing price or volume signals. Use it to:
Quantify how unusual current futures positioning is compared to recent history.
Identify crowded leverage phases that can fuel squeezes.
Spot structural divergences between price and positioning.
Frame risk and opportunity around events and regime shifts.
It is not a complete trading system. Combine it with your own entries, exits and risk rules to get the most out of what the Z score is telling you about positioning pressure under the hood of the market.

Advanced Confluence DashboardAdvanced Confluence Dashboard - Multi-Indicator Technical Analysis Tool
OVERVIEW
The Advanced Confluence Dashboard is a comprehensive technical analysis tool designed to help traders identify high-probability trade setups by tracking multiple technical indicators simultaneously. The indicator displays up to 13 different technical confluences in an easy-to-read dashboard format, providing both individual signals and an overall market bias percentage. Switch between full table view and condensed view for maximum chart flexibility.
FEATURES
- 13 Technical Confluences: RSI, VWAP, EMA Cross (9/21), MACD, Stochastic, Trend (50 EMA), Bollinger Bands, ADX Strength, Price Momentum, Volume Breakout, VWAP Bands, 200 EMA, and Price Action (Higher Highs/Lower Lows)
- Real-time Confluence Scoring: Automatically calculates bullish vs bearish signal strength
- Multi-Timeframe Support: Analyze indicators on any timeframe while viewing your chart on another
- Customizable Display: Toggle individual indicators on/off, adjust table position, size, and transparency
- ATR Information: Optional ATR display for volatility-based position sizing
- Condensed View Mode: Ultra-minimal display showing only confluence score and ATR (perfect for scalpers who want maximum chart visibility)
- Full Table View: Detailed breakdown of each indicator's value and signal
- Color-Coded Signals: Green (bullish), red (bearish), white (neutral) for instant visual clarity
HOW IT WORKS
The indicator evaluates each enabled technical indicator and assigns it either a bullish or bearish signal based on its current state. The confluence score shows how many indicators are aligned in each direction, giving you a clear percentage-based view of market bias. For example, if 8 out of 13 indicators are bullish, you'll see a 62% LONG BIAS signal.
DISPLAY MODES
Full View: Shows all enabled indicators with their current values and signals in a detailed table format. Perfect for understanding exactly which indicators are bullish or bearish and why.
Condensed View: Shows only the confluence score (e.g., "4/13 LONG | 9/13 SHORT - SHORT BIAS 69%") and optional ATR information. This minimal display keeps your chart clean while still providing the essential confluence data you need for quick trading decisions. Ideal for scalpers and traders who want maximum chart space.
CONFLUENCES EXPLAINED
- RSI: Momentum oscillator (>50 bullish, <50 bearish, shows overbought/oversold)
- VWAP: Volume-weighted average price (above = bullish, below = bearish)
- EMA Cross: Fast EMA (9) vs Slow EMA (21) with price position
- MACD: Trend-following momentum (line above signal = bullish)
- Stochastic: Momentum oscillator (>50 bullish, <50 bearish)
- Trend (50 EMA): Price position relative to 50-period EMA
- Bollinger Bands: Volatility and mean reversion (above middle = bullish)
- ADX Strength: Trend strength indicator (shows strong trends)
- Price Momentum: Rate of price change over specified period
- Volume Breakout: Detects unusual volume with directional bias
- VWAP Bands: Standard deviation bands around VWAP
- 200 EMA: Long-term trend indicator
- Price Action: Higher Highs and Lower Lows pattern detection
SETTINGS
Timeframe Settings:
- Indicator Timeframe: Analyze indicators on a different timeframe than your chart
Display Options:
- Condensed View: Toggle between full table and minimal display
- Show ATR Info: Display/hide ATR information
- Table Position: 9 positions (top/middle/bottom + left/center/right)
- Text Size: Auto, tiny, small, normal, large, huge
- Table Transparency: 0-100%
- Border Width: 1-5 pixels
Confluence Toggles:
- Enable/disable any of the 13 confluences individually
- Confluence score automatically adjusts based on enabled indicators
Indicator Settings:
- RSI Length (default: 14)
- ATR Length (default: 14)
- Fast/Slow EMA (default: 9/21)
- Trend EMA (default: 50)
- Volume SMA Length (default: 20)
- Volume Breakout Multiplier (default: 2.0x)
- Bollinger Bands Length/StdDev (default: 20/2.0)
- ADX Length (default: 14)
- ADX Strength Threshold (default: 25)
- Momentum Length (default: 10)
IDEAL USE CASES
- Scalping: Quick identification of confluence for fast entries/exits - use condensed view for clean charts
- Day Trading: Multi-timeframe analysis for intraday setups
- Swing Trading: Confirmation of longer-term bias
- Risk Management: Higher confluence = higher probability trades
- Trade Filtering: Only take trades when confluence reaches your threshold
- Multi-Monitor Setups: Use condensed view on execution charts, full view on analysis charts
HOW TO USE
1. Add the indicator to your chart
2. Toggle on/off the confluences you prefer to use
3. Choose between Full View (detailed) or Condensed View (minimal)
4. Adjust the table position and size to your preference
5. Look for high confluence percentages (70%+ is strong bias)
6. Use the individual indicator signals (full view) to understand market structure
7. Combine with your trading strategy for entry/exit confirmation
TIPS
- Use Condensed View when scalping to keep your chart clean and uncluttered
- Switch to Full View when you need to analyze which specific indicators are conflicting
- Higher confluence doesn't guarantee success - always use proper risk management
- Consider using 60%+ confluence as a minimum threshold for trades
- Pay attention to which specific indicators are aligned vs conflicting
- Use the ATR display for quick reference on position sizing
- Experiment with different timeframes to find what works for your style
- Disable indicators you don't use to simplify your confluence scoring
DISCLAIMER
This indicator is for educational and informational purposes only. It does not constitute financial advice, investment advice, trading advice, or any other type of advice. Trading and investing in financial markets involves substantial risk of loss and is not suitable for every investor. Past performance is not indicative of future results. Always do your own research and consult with a qualified financial advisor before making any investment decisions.

IDLP – Intraday Daily Levels Pro [FXSMARTLAB]🔥 IDLP – Intraday Daily Levels Pro
IDLP – Intraday Daily Levels Pro is a precision toolkit for intraday traders who rely on objective daily structure instead of repainting indicators and noisy signals.
Every level plotted by IDLP is derived from one simple rule:
Today’s trading decisions must be based on completed market data only.
That means:
✅ No use of the current day’s unfinished data for levels
✅ No lookahead
✅ No hidden repaint behavior
IDLP reconstructs the previous trading day from the intraday chart and then projects that structure forward onto the current session, giving you a stable, institutional-style intraday map.
🧱 1. Previous Daily Levels (Core Structure)
IDLP extracts and displays the full previous daily structure, which you can toggle on/off individually via the inputs:
Previous Daily High (PDH)
Previous Daily Low (PDL)
Previous Daily Open
Previous Daily Close,
Previous Daily Mid (50% of the range)
Previous Daily Q1 (25% of the range)
Previous Daily Q3 (75% of the range)
All of these come from the day that just closed and are then locked for the entire current session.
What these levels tell you:
PDH / PDL – true extremes of yesterday’s price action (liquidity zones, breakout/reversal points).
Previous Daily Open / Close – how the market positioned itself between session start and end
Mid (50%) – equilibrium level of the previous day’s auction.
Q1 / Q3 (25% / 75%) internal structure of the previous day’s range, dividing it into four equal zones and helping you see if price is trading in the lower, middle, or upper quarter of yesterday’s range.
All these levels are non-repaint: once the day is completed, they are fixed and never change when you scroll, replay, or backtest.
🎯 2. Previous Day Pivot System (P, S1, S2, R1, R2)
IDLP includes a classic floor-trader pivot grid, but critically:
It is calculated only from the previous day’s high, low, and close.
So for the current session, the following are fixed:
Pivot P – central reference level of the previous day.
Support 1 (S1) and Support 2 (S2)
Resistance 1 (R1) and Resistance 2 (R2)
These levels are widely used by institutional desks and algos to structure:
mean-reversion plays, breakout zones, intraday targets, and risk placement.
Everything in this section is non-repaint because it only uses the previous day’s fully closed OHLC.
📏 3. 1-Day ADR Bands Around Previous Daily Open
Instead of a multi-day ADR, IDLP uses a pure 1-Day ADR logic:
ADR = Range of the previous day
ADR = PDH − PDL
From that, IDLP builds two clean bands centered around the previous daily Open:
ADR Upper Band = Previous Day Open + (ADR × Multiplier)
ADR Lower Band = Previous Day Open − (ADR × Multiplier)
The multiplier is user-controlled in the inputs:
ADR Multiplier (default: 0.8)
This lets you choose how “tight” or “wide” you want the ADR envelope to be around the previous day’s open.
Typical use cases:
Identify realistic intraday extension targets, Spot exhaustion moves beyond ADR bands, Frame reversals after reaching volatility extremes, Align trades with or against volatility expansion
Again, since ADR is calculated only from the completed previous day, these bands are totally non-repaint during the current session.
🔒 4. True Non-Repaint Architecture
The internal logic of IDLP is built to guarantee non-repaint behavior:
It reconstructs each day using time("D") and tracks:
dayOpen, dayHigh, dayLow, dayClose for the current day
prevDayOpen, prevDayHigh, prevDayLow, prevDayClose for the previous day
At the moment a new day starts:
The “current day” gets “frozen” into prevDay*
These prevDay* values then drive: Previous Daily Levels, Pivots, ADR.
During the current day:
All these “previous day” values stay fixed, no matter what happens.
They do not move in real time, they do not shift in replay.
This means:
What you see in the past is exactly what you would have seen live.
No fake backtests.
No illusion of perfection from repainting behavior.
🎯 5. Designed For Intraday Traders
IDLP – Intraday Daily Levels Pro is made for:
- Day traders and scalpers
- Index and FX traders
- Prop firm challenge trading
- Traders using ICT/SMC-style levels, liquidity, and range logic
- Anyone who wants a clean, institutional-style daily framework without noise
You get:
Previous Day OHLC
Mid / Q1 / Q3 of the previous range
Previous-Day Pivots (P, S1, S2, R1, R2)
1-Day ADR Bands around Previous Day Open
All calculated only from closed data, updated once per day, and then locked.

Stochastic RSI Forecast [QuantAlgo]🟢 Overview
The Stochastic RSI Forecast extends the classic momentum oscillator by projecting potential future K and D line values up to 10 bars ahead. Unlike traditional indicators that only reflect historical price action, this indicator uses three proprietary forecasting models, each operating on different market data inputs (price structure, volume metrics, or linear trend), to explore potential price paths. This unique approach allows traders to form probabilistic expectations about future momentum states and incorporate these projections into both discretionary and algorithmic trading and/or analysis.
🟢 How It Works
The indicator operates through a multi-stage calculation process that extends the RSI-to-Stochastic chain forward in time. First, it generates potential future price values using one of three selectable forecasting methods, each analyzing different market dimensions (structure, volume, or trend). These projected prices are then processed through an iterative RSI calculation that maintains continuity with historical gain/loss averages, producing forecasted RSI values. Finally, the system applies the full stochastic transformation (calculating the position of each forecasted RSI within its range, smoothing with K and D periods) to project potential future oscillator values.
The forecasting models adapt to market conditions by analyzing configurable lookback periods and recalculating projections on every bar update. The implementation preserves the mathematical properties of the underlying RSI calculation while extrapolating momentum trajectories, creating visual continuity between historical and forecasted values displayed as semi-transparent dashed lines extending beyond the current bar.
🟢 Key Features
1. Market Structure Model
This algorithm applies price action analysis by tracking break of structure (BOS) and change of character (CHoCH) patterns to identify potential order flow direction. The system detects swing highs and lows using configurable pivot lengths, then analyzes sequences of higher highs or lower lows to determine bullish or bearish structure bias. When price approaches recent swing points, the forecast projects moves in alignment with the established structure, scaled by ATR (Average True Range) for volatility adjustment.
Potential Benefits for Traders:
Explores potential momentum continuation scenarios during established trends
Identifies areas where structure changes might influence momentum
Could be useful for swing traders and position traders who incorporate structure-based analysis
The Structure Influence parameter (0-1 scale) allows blending between pure trend following and structure-weighted forecasts
Helps visualize potential trend exhaustion through weakening structure patterns
2. Volume-Weighted Model
This model analyzes volume patterns by combining On-Balance Volume (OBV), Accumulation/Distribution Line, and volume-weighted price returns to assess potential capital flow. The algorithm calculates directional volume momentum and identifies volume spikes above customizable thresholds to determine accumulation or distribution phases. When volume indicators align directionally, the forecast projects stronger potential moves; when volume diverges from price trends, it suggests possible reversals or consolidation.
Potential Benefits for Traders:
Incorporates volume analysis into momentum forecasting
Attempts to filter price action by volume support or lack thereof
Could be more relevant in markets where volume data is reliable (equities, crypto, major forex pairs)
Volume Influence parameter (0-1 scale) enables adaptation to different market liquidity profiles
Highlights volume climax patterns that sometimes precede trend changes
Could be valuable for traders who incorporate volume confirmation in their analysis
3. Linear Regression Model
This mathematical approach applies least-squares regression fitting to project price trends based on recent price data. Unlike the conditional logic of the other methods, linear regression provides straightforward trend extrapolation based on the best-fit line through the lookback period.
Potential Benefits for Traders:
Delivers consistent, reproducible forecasts based on statistical principles
Works better in trending markets with clear directional bias
Useful for systematic traders building quantitative strategies requiring stable inputs
Minimal parameter sensitivity (primarily controlled by lookback period)
Computationally efficient with fast recalculation on every bar
Serves as a baseline to compare against the more complex structure and volume methods
🟢 Universal Applications Across All Models
Each forecasting method projects potential future stochastic RSI values (K and D lines), which traders can use to:
▶ Anticipate potential crossovers: Visualize possible K/D crosses several bars ahead
▶ Explore overbought/oversold scenarios: Forecast when momentum might return from extreme zones
▶ Assess divergences: Evaluate how oscillator divergences might develop
▶ Inform entry timing: Consider potential points along the forecasted momentum curve for trade entry
▶ Develop systematic strategies: Build rules based on forecasted crossovers, slope changes, or threshold levels
▶ Adapt to market conditions: Switch between methods based on current market character (trending vs range-bound, high vs low volume)
In short, the indicator's flexibility allows traders to combine forecasting projections with traditional stochastic signals, using historical K/D for immediate reference while considering forecasted values for planning and analysis. As with all technical analysis tools, the forecasts represent one possible scenario among many and should be used as part of a broader trading methodology rather than as standalone signals.

VWAP + EMA9 With SignalsThis script is for scalping on the 5 minute timeframe. It contains signals that indicate intersection of VWAP by the EMA9. It contains Buy signals when a candle closes above both lines indicating a quick continuation of a long position (quick scalp) as well as Sell signals when a candle closes below both lines indicating a quick continuation of a short position (quick scalp). Please note that i do not recommend entries at Buy and Sell signals during Accumulation/Consolidation. Positions should be taken with volume.

ATR ZigZag BreakoutATR ZigZag Breakout
This strategy uses my ATR ZigZag indicator (powered by the ZigZagCore library) to scalp breakouts at volatility-filtered highs and lows.
Everyone knows stops cluster around clear swing highs and lows. Breakout traders often pile in there, too. These levels are predictable areas where aggressive orders hit the tape. The idea here is simple:
→ Let ATR ZigZag define clean, volatility-filtered pivots
→ Arm a stop market order at those pivots
→ Join the breakout when the crowd hits the level
The key to greater success in this simple strategy lies in the ZigZag. Because the pivots are filtered by ATR instead of fixed bar counts or fractals, the levels tend to be more meaningful and less noisy.
This approach is especially suited for intraday trading on volatile instruments (e.g., NQ, GC, liquid crypto pairs).
How It Works
1. Pivot detection
The ATR ZigZag uses an ATR-based threshold to confirm swing highs and lows. Only when price has moved far enough in the opposite direction does a pivot become “official.”
2. Candidate breakout level
When a new swing direction is detected and the most recent high/low has not yet been broken in the current leg, the strategy arms a stop market order at that pivot.
• Long candidate → most recent swing high
• Short candidate → most recent swing low
These “candidate trades” are shown as dotted lines.
3. Entry, SL, and TP
If price breaks through the level, the stop order is filled and a bracket is placed:
• Stop loss = ATR × SL multiplier
• Take profit = SL distance × RR multiplier
Once a level has traded, it is not reused in the same swing leg.
4. Cancel & rotate
If the market reverses and forms a new swing in the opposite direction before the level is hit, the pending order is cancelled and a new candidate is considered in the new direction.
Additional Features
• Optional session filter for backtesting specific trading hours

KIMATIX VWAP/EMA System (by ASCE)**KIMATIX VWAP/EMA System (by ASCE)**
A precision-built intraday framework for momentum, structure, and liquidity timing.
**Why this indicator exists**
Most traders see movement, but not context. They enter too late, chase momentum, or fade reversals without understanding where institutional players react.
This tool solves that problem by combining two of the most powerful structural concepts in intraday price discovery:
Trend alignment through EMAs
Liquidity reaction zones through VWAPs
Together, they provide directional clarity, timing, and trade location.
**Core Components**
**Three Trend EMAs**
• **EMA 7** – Microtrend and momentum speed
• **EMA 23** – Intraday trend leadership
• **EMA 50** – Higher-timeframe structure anchor
This trio shows how price accelerates, slows, flips bias, or compresses.
**Three Volume-Weighted Average Prices**
• **Daily VWAP** – Primary scalper reference point
• **Weekly VWAP** – Bias filter and intermediate balance zone
• **Monthly VWAP** – High-impact “magnet” where major reactions occur
VWAP represents the fair value where volume is distributed.
When price taps, rejects, or reclaims these levels, liquidity flow shifts — ideal for scalp-to-swing entries.
**What it helps you see**
• When price is aligned with or diverging from trend
• Where momentum will expand or fail
• Which levels larger participants defend
• Where the highest-probability reaction zones form
This is not a signal tool — it is a structure and decision-making framework used by professional intraday traders.
**How to use it**
1. **Trade with VWAP alignment** – expect reactions at daily/weekly/monthly VWAPs
2. **Follow EMA flow** – when EMAs compress or flip, momentum changes
3. **Look for price interaction** – rejection, reclaim, or breakthrough of a VWAP often leads to fast moves
Ideal for scalping, day-trading, futures, FX, indices, crypto, and metals.
**Customization**
Colors for each EMA and each VWAP can be personalized, allowing alignment with your charting workflow.
**Final Notes**
This system gives you the *context* most traders miss — where trend meets liquidity.
Use it as a roadmap to understand where price *should* react and when momentum is likely to shift.

Flow Rider Mother Candle Breakout Long Short indicator - ScalpOVERVIEW
// ═══════════════════════════════════════════════════════════
// 1. Detects HIGH VOLUME "Mother/Big" candles
// 2. Waits for 2+ INSIDE bars (consolidation)
// 3. Enters SHORT on bearish breakout below mother low Enters Long on bullish breakout above
// 4. Stop Loss: Highest point + 1.5x largest upper wick (default)
// 5. Targets: TP1 @ 0.618, TP2 @ 1.618 Fibonacci extensions
