Scalping
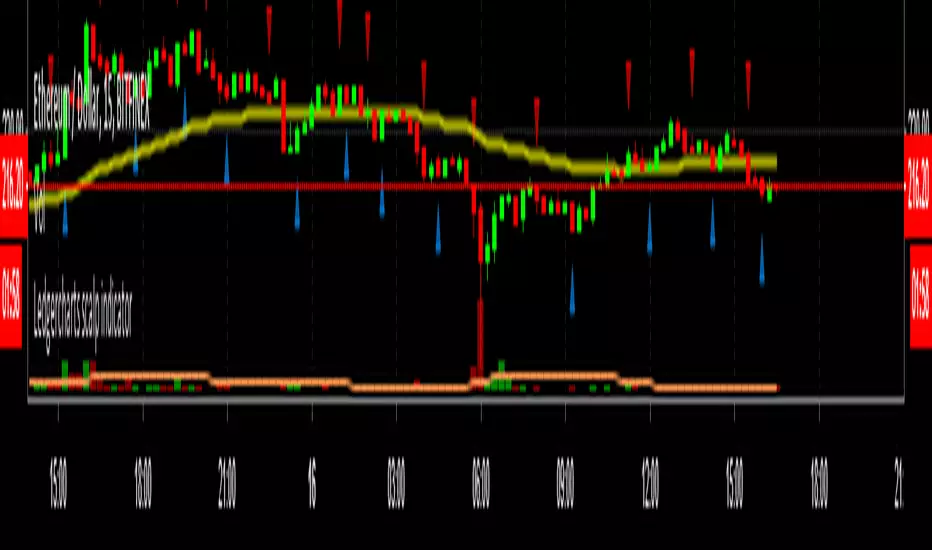
Ledgercharts scalp indicatorI'm using this indicator for finding scalp opportunities with high volume crypto coins. To be used in combination with support & resistance levels and/or other indicators.
Works best on a 15-minute timeframe.
DISCLAIMER:
This script is not intended as financial advice and is for educational purposes only. Do your own research by verifying the accuracy of the information and know that your decisions are your own.
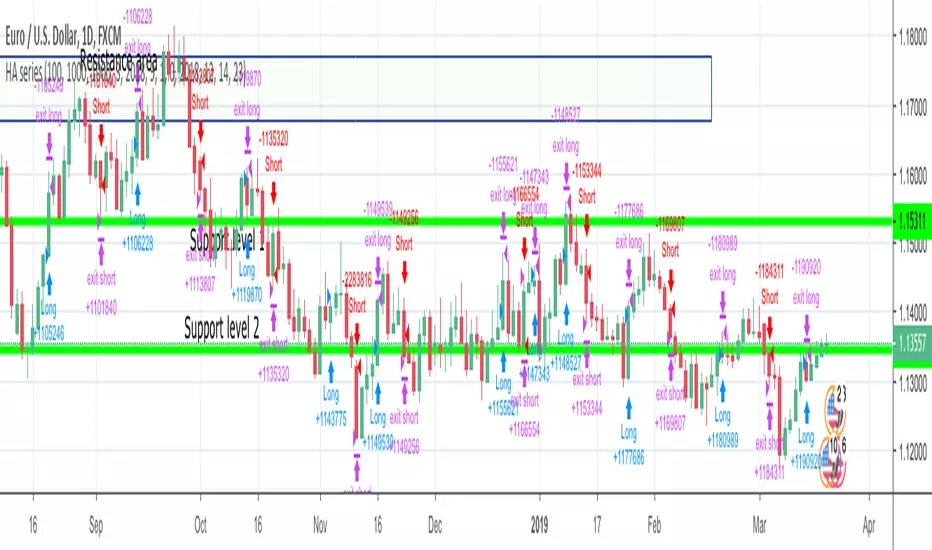
Series of Heikin ashi candle strategySeries of Heikin ashi candle strategy, idea and rules:
After 2 consecutive heikin ashi candles of same color, place a buy stop order at high of last candle if green or a sell stop order at low of last candle if red.
Strategy follows the open order with trailing stop.
Use on charts with heikin ashi candles.
Good on lower timeframes and scalping.
Please use comment section for any feedback.
Next improvment (only to who is interested to this script and follows me): study with alerts. Leave a comment if you want to have access to study.

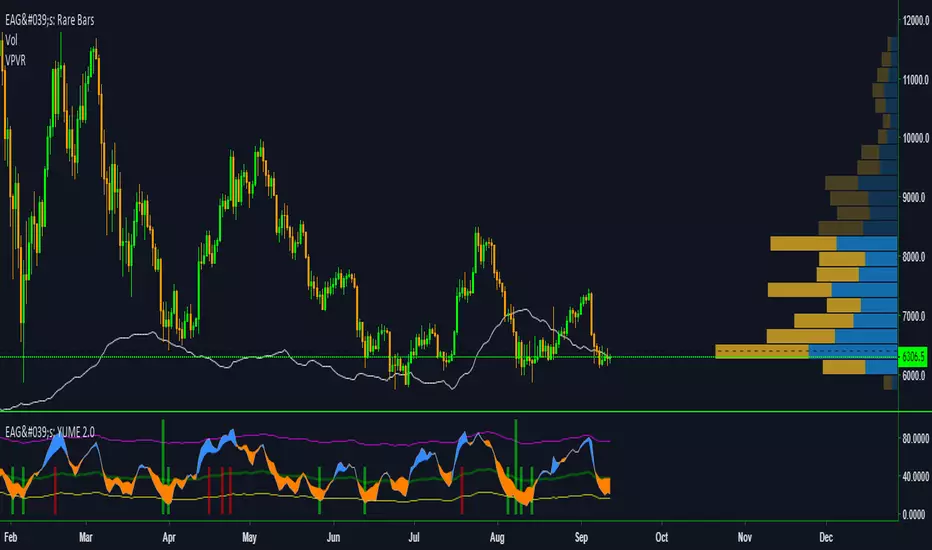
EdgeAnalysisGroup: Yume Wave 2.0This is a upgraded version of the wave with modified parameters for a higher success rate. 3 New Lengths and 75 more lines of code added to the overall algorithm. Also included are 2 sublevel signals based on the Fib MA and pattern trading.
The Wave:
+ The Yume is the Fast length
+ The Akume is the Slow length
+ The Miaku is a median weighted length
+ The Upper Limit is an overbought asset indication
+ The Lower Limit is an oversold asset indication
+ The Wave is the spread between Yume and Miaku
Bullish Indications:
+ The Yume is above the Akume
+ The Yume is above the Miaku
+ The Yume is below the Lower Limit
Bearish Indications:
+ The Yume is below the Akume
+ The Yume is below the Miaku
+ The Yume is above the Upper Limit
Signal Strength Weights:
+ 50 = Yume Wave crossed a Limit Line
+ 100 = Yume Wave crossed a Limit Line + Close to a Fib Moving Average
+ 100 = Edge's Market Bottom/Top Algorithm is marked 'True'
Setting up Signals (Based on a 100 Signal Height):
+ Set the "Bull Signal" to be at 50 or 100
+ Set the "Bear Signal" to be at 50 or 100
+ 50 is Agressive, 100 is Conservative.
+ Bull/Bear are separate so you can play conservative bull with aggressive bear.
SMA_CrossThis strategy is a variation of standard sma cross that comes as default with pine script
The idea is to NOT wait for a cross between fast and slow moving averages but to anticipate it considering the distance between the two MAs
Strategy can be used also for scalping, just need to be optimized for low tiime frames as 1 minute or 5 minute.
TIP: stay far from resistance and supports. I use my script "LCS/HCR Support and Resistance multi timeframes" to easily identify major supports
and resistance areas (note that I said areas and not lines).
Thanks to ChrisMoody: I used his code snippet for switching between various moving average types and calculation of TEMA and HULL ma.
Next improvements:
- money managment
- self optimization
- convert to study with alerts
This strategy is free to use but code is private. If you like or have question please use comment section.
Check also my other scripts at www.tradingview.com .
Thanks for your feedbaks.


Scalping Sheriff Strategy TraderReceive alerts for Long and Short Scalp trades.
Inspired by the RSI Sheriff Strategy

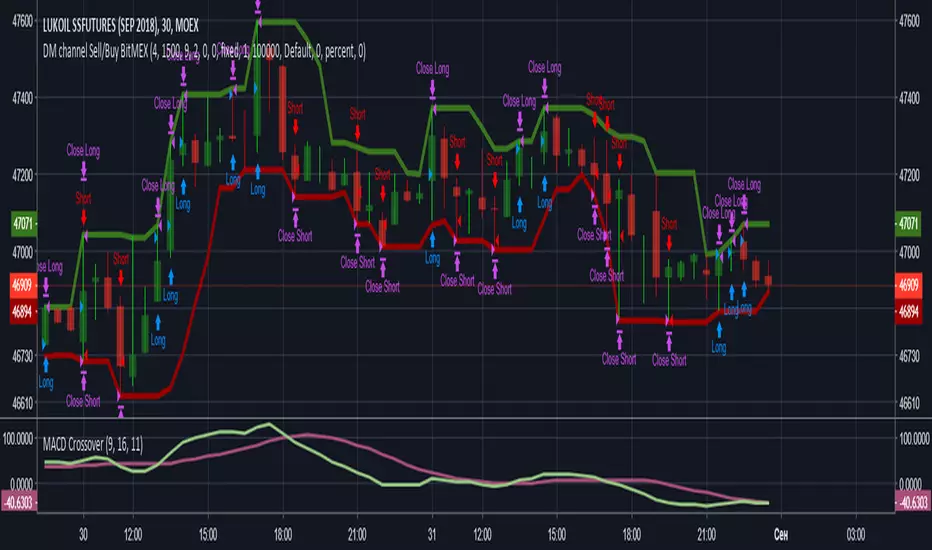
GM channel Sell/Buy BitMEX New script - really working strategy on one of tools of the Moscow Exchange.
The idea such - as soon as the price punches one of borders - upper or lower - we becomes in the direction of movement of the price. It is possible to come the postponed warrants for the probity prices up or down. An exit is performed on a trelling to stop, or everyone proceeding from the experience determines an exit point.
---------------
Новый скрипт - реально работающая стратегия на одном из инструментов Московской биржи.
Идея такая - как только цена пробивает одну из границ - верхнюю или нижнюю - мы становится в направлении движения цены. Можно отложенными ордерами заходить на пробитие цены вверх или вниз. Выход осуществляется по треллинг стопу, либо каждый сам исходя из своего опыта определяет точку выхода.
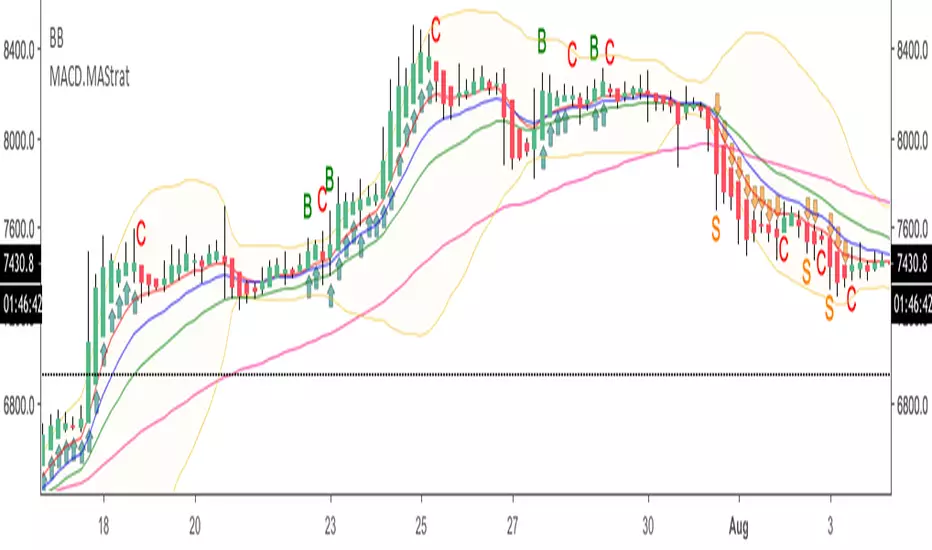
HA.MACD.MA.TradeSetupsHi probably trade setups indicator intended to be used with Heikin Ashi candles. It uses fibo EMAs and MACD to signal longs/shorts. Intended for scalping high cap coin with high volume on lower time frames.

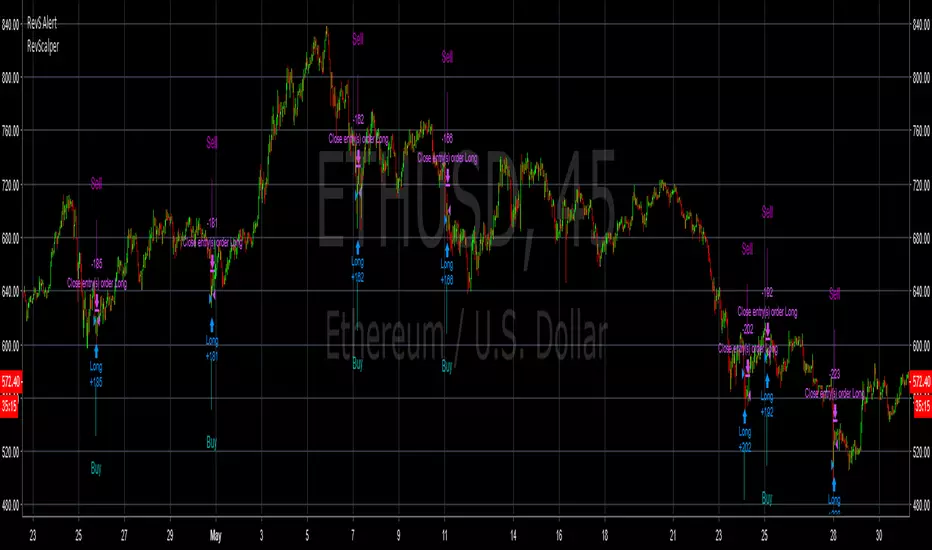
Crypto Reversal Scalper AlertsThis is the alerts for
The script that will detect a reversal with two variables. The script will then attempt to scalp against the trend short-term.
Absolutely, NO REPAINTING. Can be used across crypto pairs.
You must use ONCE PER BAR for alerts! Yes it does work! <- MAKE SURE YOU SET ALERTS PROPERLY!
PM me for a trial.
Cost for the bot will be 0.01 BTC/month. Cost can be negotiable.
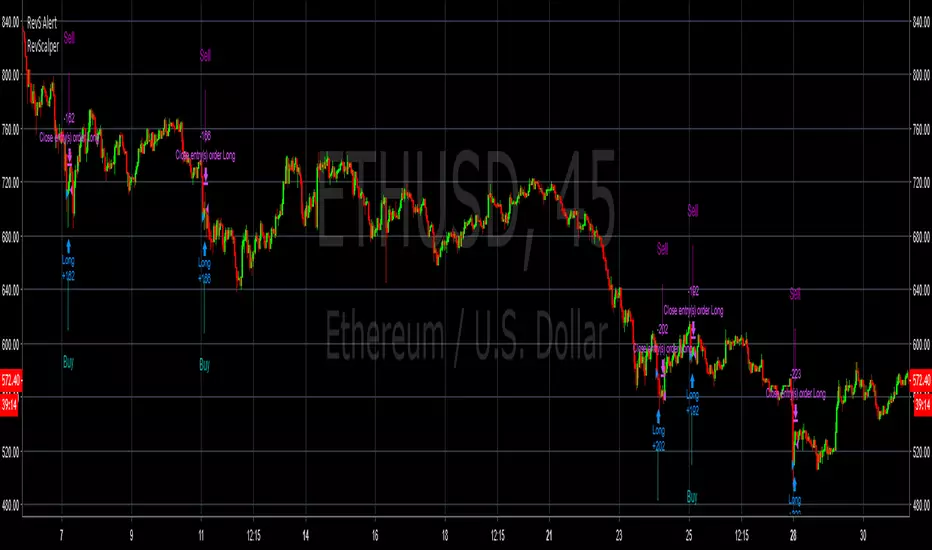
Crypto Reversal Scalper BacktesterThe script that will detect a reversal with two variables. The script will then attempt to scalp against the trend short-term.
Absolutely, NO REPAINTING. Can be used across crypto pairs.
You must use ONCE PER BAR for alerts! Yes it does work!
PM me for a trial.
Cost for the bot will be 0.01 BTC/month. Cost can be negotiable.
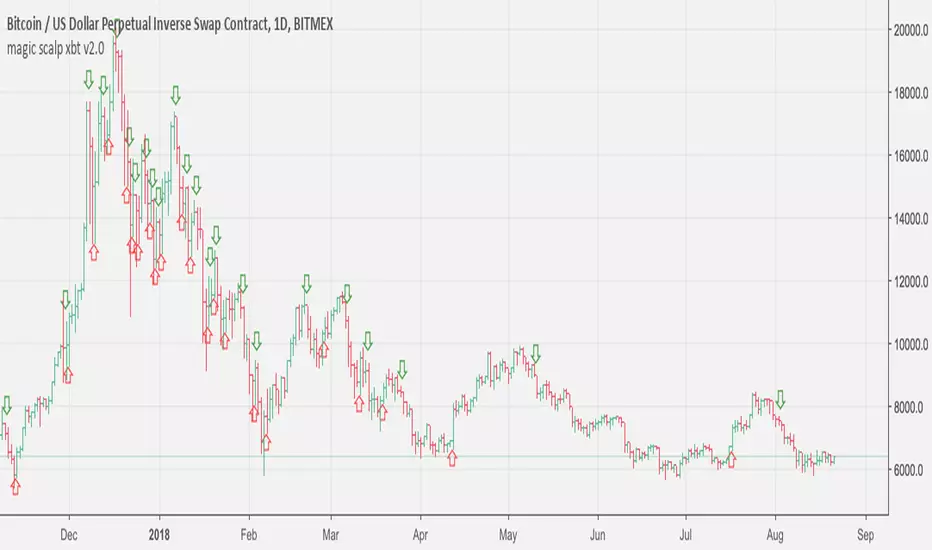


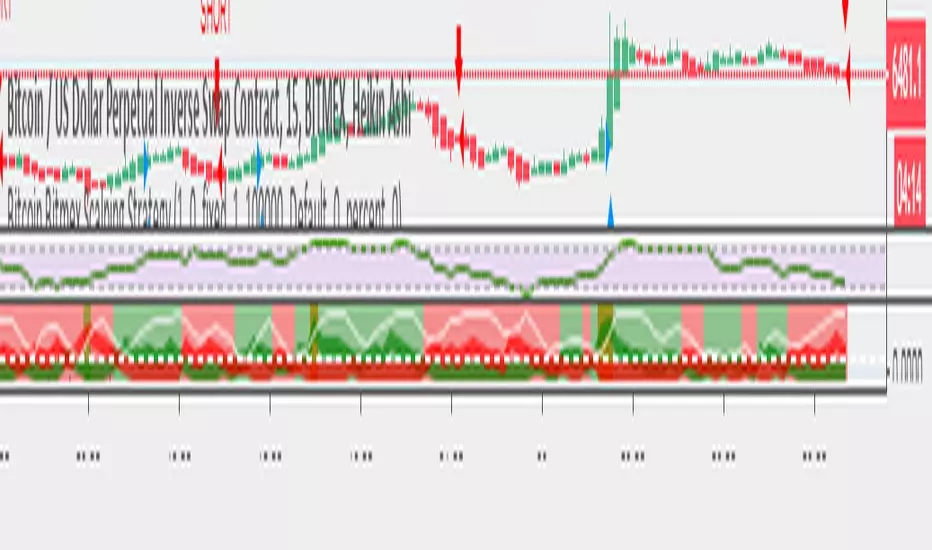
Bitcoin Bitmex Scalping StrategyIf you are not greedy and just want 20-30 points gain then this strategy can give more then 90% accurate calls. Once you enter the trade place your sell order 20-30 points above/below your order or use trailing stop loss.
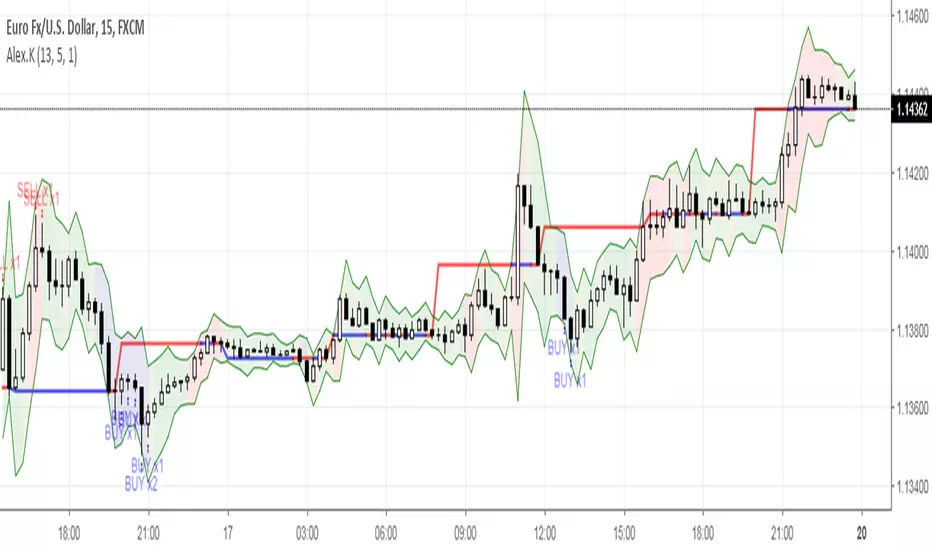
Alex.KAlex.K
Class : trend indicator
Trading type : scalping, intraday trading
Time frame : 5-15 min
Purpose : work in trend, search for reversal points
Level of aggressiveness : standard
Indicator «Alex.K» is developed for short-term intraday trading purposes. It is optimized for time frames from 5 to 15 minutes and can be a useful tool for scalping trading.
Specific feature of this indicator is ban for trades against basic trend. This significantly reduces the number of trades, but increases their quality. Still recommended time frames are rather short, so indicator «Alex.K» can generate up to 10 and more trades per day (it depends on time frame, for example 15 min frame generates nearly 10 trades per day, but 5 min frame increases this number to 15-20 trades per day). Also frequency of trades can be managed with indicator parameters. So it can easily be adopted for individual purposes and type of trading.
Indicator «Alex.K» is based on two blocks of technical analysis methods: trend and oscillatory. Trend block is used to detect prevailing tendency (only trades in direction of basic tendency are allowed). Oscillatory block is responsible for the entry points (buy trades are allowed only from oversold zones and sell trades – from overbought zones).
To increase the efficiency of the indicator it has elements of serial trading (used to increase of the overall position).
Structure of the indicator
Indicator consists of colored zones and level lines:
- level lines (red/blue lines) – show the most likely points of price reverse. The direction of reverse depends on color of the line. Red line indicates the resistance level. Blue line – the level of support;
- profit lines (green lines) – show the most favorable profit size for the current trade. For the buy trades the upper green line should be used. For the sell trades – the bottom green line;
- colored zones between profit lines – shows the degree of price deviation from the equilibrium price;
• green zone – deviations are insignificant or absent;
• blue zone – deviations are present. Price enters buy zone;
• red zone - deviations are present. Price enters sell zone.
Rules of trading
When price enters blue/red zone it is a signal about entering the overbought/oversold zone, but buy/sell signals appear only in the direction of prevailing tendency. To ease the trading process “buy”/”sell” signals appear on the chart.
Indicator «Alex.K» uses 3 levels of signals:
- х1 - signal for trade with basic volume. It is displayed on the chart with marker «х1»;
- х2 - signal for trade with double volume. It is displayed on the chart with marker «х2»;
- х3 – signal for trade with triple volume. It is displayed on the chart with marker «х3».
Signals for sell are marked with «sell», buy signals – with «buy».
Profits are set near the opposite green line (for buy trades – bottom line, for sell trades – upper line). Positions can be held till the price enters overbought zone (case of buy trades) or oversold zone (case of sell trades).
Breakout Scalper (Session)This is a twist on my on my Breakout Scalper strategy that limits trading to a user-configurable session
Find the original "Continuous" version of the scalper here:
The breakout scalper is based on "slow" and "fast" donchian periods. In this version, the "slow" donchian is in fact the Day's high/low. This important difference means that we will always be entering our trades at the day's high or low, so you are exposed to the price making new highs/lows but not to oscillations within the day's range.
Furthermore, the scalper is modified to only enter trades after the start of the user-configured session. Any open trades are closed at the end of the user-configured session. The default session is set to 10:00 AM to 3:30 PM because that's when I like to trade.

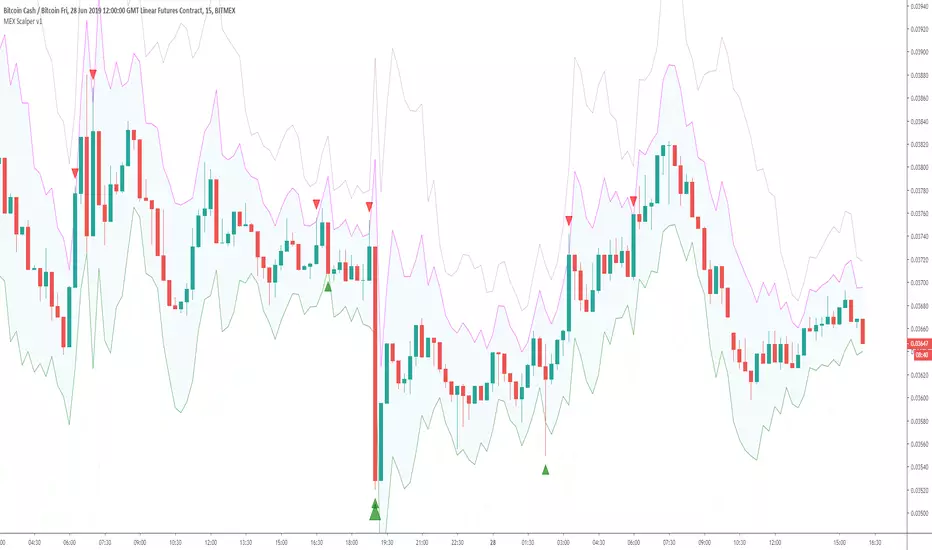
BitMEX Profit Scalper v1I keep getting asked to create a script for Scalping on BitMEX so here is the initial version!
Default settings created for XBTUSD 15m and designed for getting decent profits when using around a 10x margin.
Settings can be tweaked so you can alter this for any time frame
ACCESS For CryptoProTools.com members only!! (Visit our website if you wish to sign up)