5 ema strategyThis Strategy is based of Subhashish Pani's (power of stocks) 5 EMA Strategy.strategy used for sell in 5 minutes and for buy in 15 minutes ..
Rules for this strategy ..
Sell signal -
1) if price is above 5 Ema and not touching Ema use as alert candle..
2) if price break low of alert candle strategy open trade ..
3) if price move more upside low of alert candle keep change into next candle ..
4) input we can select number of trade per day .as rule should take only 4 signal should execute
5) stop loss is fixed highest high of last 2 candle and take profit is input multiply of stop loss
buy signal-
1) if price is below 5 Ema and not touching Ema use as alert candle..
2) if price break high of alert candle strategy open trade ..
3) if price move more downside high of alert candle keep change into next candle ..
4) input we can select number of trade per day .as rule should take only 4 signal should execute
5) stop loss is fixed lowest low of last 2 candle and take profit is input multiply of stop loss
notes -input can be selected which side should take signal either buy or sell side ...number of trade can be adjusted ..
Disclaimer -Traders can use this script as a starting point for further customization or as a reference for developing their own trading strategies. It's important to note that past performance is not indicative of future results, and thorough testing and validation are recommended before deploying any trading strategy.
Scalping

WPO Modified [BackQuant]The Wave Period Oscillator (WPO), developed by Akram El Sherbini, is a sophisticated technical analysis tool that offers traders a dynamic way to interpret market cycles. Its design is inspired by the natural ebb and flow of markets, which often follow cyclical patterns driven by underlying economic, political, and psychological factors. The oscillator's unique contribution to market analysis lies in its ability to smooth out the "noise" inherent in daily price movements, thus providing a clearer view of the market's rhythmic fluctuations over time.
-----> Time Cycle Oscillators' in the IFTA Journal 2018 (page 66 - 77), as found below:
ifta.org
El Sherbini's WPO is grounded in the concept of wave period analysis, which suggests that financial markets move in waves or cycles. The oscillator translates these movements into a visual tool that oscillates above and below a central zero line. Peaks and troughs on the oscillator correspond to the crests and troughs of market price waves, providing a visual representation of the market's heartbeat.
The WPO is not merely a tool for identifying trends but also for detecting shifts in market momentum. It does this through a mathematical model that measures divergence—when the direction of the oscillator deviates from the direction of price movement. Such divergences can be precursors to potential reversals or continuations in the market, offering traders advance notice of significant changes in price direction.
Further refining its utility, the WPO incorporates methods for calculating divergence that are sensitive to the unique conditions of different markets and securities. This includes adjusting for volatility and market velocity, allowing the oscillator to provide relevant signals regardless of the market environment.
In practical terms, traders use the WPO to time their entries and exits with greater precision. When the oscillator shows a high peak or a deep trough, it can signal that a market is potentially overbought or oversold, respectively. The WPO's smoothing property ensures that these signals are not just reactionary to short-term price spikes or drops, but indicative of more substantial, sustained movements.
By providing a more measured and smoothed analysis of market cycles, the WPO helps to filter out insignificant price movements and focus on the ones that matter—those that indicate a significant wave of buying or selling pressure. This can be particularly valuable in the cryptocurrency markets, where volatility is high, and traditional indicators may struggle to provide clear signals.
For traders and analysts alike, the Wave Period Oscillator represents a convergence of technical precision and market psychology. By focusing on the periodic nature of market movements, it aligns traders with the rhythm of the markets, potentially leading to more harmonious trading decisions that are in step with the market's natural waves.
Please see the backtest here:
For more simple terms:
You can use this indicator as a the oscillator
Above 0 for long
Below 0 for short
OR
WPO MA
Above 0 for long
Below 0 for short

GOLD MonitorI'm using this platform from sometime and I carry out trading on Gold, using a kind of scalping strategy.
Scalping is not an easy task to do. Personally I found a lot of problems while detecting the trend direction.
So I decided to develop an indicator that is capable, in a discrete way, to give an instant-view on the market that is interesting.
This indicator can summarize in a small table all interesting figures related to gold scalping trading and is useful while joined with technical and fundamental analysis.
In this way it is possible to easy take under control all important aspects related to gold trading that I summarize here and you can find inside the table:
1) Gold / USD current direction
2) USD dollar strength (instant DXY) indicator take under consideration the DXY value every each tick and measures the increase or decrease in percentage. If there is a decrease the indicator displays a red low arrow, if there is an increase the indicator displays a green high arrow
also Gold friends are important so it is possible to find also:
3) NZDUSD (that is a Gold friend) variation percentage. If there is a decrease the indicator displays a red low arrow, if there is an increase the indicator displays a green high arrow
4) AUDUSD (that is a Gold friend) variation percentage. If there is a decrease the indicator displays a red low arrow, if there is an increase the indicator displays a green high arrow
then it is possible to find DXY USD dollar strength calculated between previous period (e.g. in timeframe M5 last 5 minutes) and current period (current 5 minutes). This indication is represented by an high arrow if there has been an increase, or by an low arrow if there has been a decrease.
Last but not least the information about the Gold trend itself with the possible forecast for the current period. This information must be carefully interpreted together with other instruments for technical analysis like Fibonacci lines.

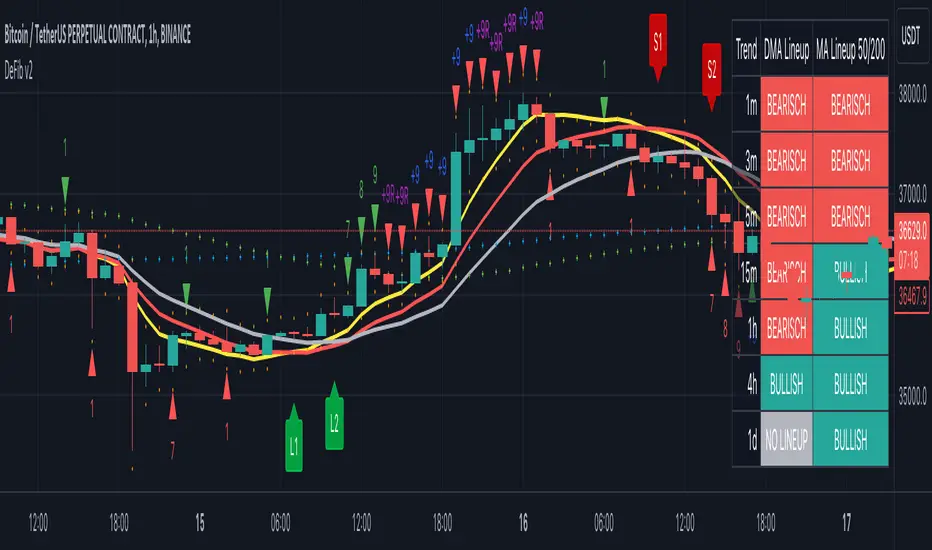
CryptoSignalScanner - DeFib v2 indicatorDESCRIPTION:
The DeFib indicator combines Moving Averages data points, Fibonacci sequence calculations and other methods to help traders make better decisions when it comes to entering and exiting trades at different time intervals. By analyzing these data points, the indicator provides valuable insights into the market trends and helps traders determine optimal moments to enter or exit a trade. Moving Averages helps smooth out price fluctuations over a specified period, providing a clearer picture of the overall market direction. The DeFib indicator uses a mix of these averages and Fibonacci methods to increase its chances of finding good trade opportunities. Whether analyzing short-term trends or longer-term patterns, this indicator assists traders in identifying favorable entry and exit points, thereby supporting more informed and strategic trading decisions.
By using Moving Averages data points based on the Fibonacci Sequence (+ some extra calculations we don't wish to share), we incorporate a unique perspective into the analysis. It helps to identify key levels of interest, potential trend reversals, and areas where price action may align with Fibonacci retracement levels. The Fibonacci Sequence is a mathematical sequence in which each number is the sum of the two preceding numbers (e.g., 0, 1, 1, 2, 3, 5, 8, 13, 21, and so on).
As a result of this information some L1, L2, S1 and S2 labels are printed on the chart. The labels are printed when a candle has been closed. Those labels are an indication when to enter or exit a trade. How to use those labels is described in the section "HOW TO USE" below.
This indicator is versatile and can be used on any timeframe, offering a wide range of features to support traders in their decision-making process. Here are some key aspects of this indicator:
User-Friendly:
Traders can easily customize all the settings according to their preferences, ensuring a personalized trading experience.
Long Signals:
The indicator provides both normal and strong long signals, which assist traders in identifying potential reversals in the market. These signals act as confirmation for traders to consider entering a long position.
Short Signals:
Similarly, the indicator offers normal and strong short signals, helping traders identify and confirm potential market reversals for short positions.
Fibonacci Sequence Calculation:
The calculation of the Long and Short labels is based on the Fibonacci Sequence, a mathematical pattern widely used in technical analysis. This adds a reliable and systematic approach to the indicator's signal generation.
Stop Loss:
When initiating a trade, it is our standard practice to implement a stop loss order based on the stop loss signal derived from the current or preceding candle. These stop loss signals are generated using the Average True Range (ATR) indicator.
Overlays:
The indicator includes overlays that visually represent market trends. These overlays identifying support and resistance levels, and providing valuable insights into the overall market behaviour.
Trend Table Box:
Traders can access a trend table box that displays the prevailing trend across different timeframes. This feature allows traders to assess the trend's strength and consistency. Additionally, users have the flexibility to adjust the timeframes based on their trading preferences.
Long/Short Alerts:
The indicator offers the functionality to add alerts for both long and short positions. Traders can set up notifications to be alerted when specific conditions are met, ensuring they stay informed even when they're not actively monitoring the charts.
Overall, this indicator provides traders with a comprehensive set of tools and features to enhance their trading decisions. Its user-friendly nature, combined with the inclusion of various signals, overlays, trend analysis, and alerts, enables traders to make informed choices and adapt to different market conditions effectively.
HOW TO USE:
This indicator incorporates specific signals that provide valuable insights into potential trend reversals in the market. Here's how each signal type is interpreted:
L1 (Long) Signal:
When an L1 signal appears, it suggests a potential uptrend reversal. Traders should pay attention to this signal as it indicates a possible shift from a downtrend to an uptrend. It serves as an early indication of a potential upward movement in prices. This is the fist point where we can take a long position. If we want to invest $100 into this trade we invest a maximum of $50 at this point. Don't forget to put a stop loss as described below in the "STOP LOSS" section.
L2 (Long) Signal:
An L2 signal acts as confirmation of the potential uptrend reversal identified by the L1 signal. When an L2 signal emerges, it strengthens the case for an upcoming uptrend. Traders may consider this signal as a stronger indication to support their decision to enter a long position. This is the point where we can invest another $50 if we already invested on the L1 signal. If we did not invested yet and we still see a clear reversal we enter the trade here with $100. Don't forget to put a stop loss as described below in the "STOP LOSS" section.
S1 (Short) Signal:
When an S1 signal is generated, it suggests a potential downtrend reversal. Traders should take note of this signal as it indicates a possible shift from an uptrend to a downtrend. It serves as an early indication of a potential downward movement in prices. This is the fist point where we can take a short position. If we want to invest $100 into this trade we invest a maximum of $50 at this point. Don't forget to put a stop loss as described below in the "STOP LOSS" section.
S2 (Short) Signal:
An S2 signal confirms the potential downtrend reversal identified by the S1 signal. When an S2 signal emerges, it reinforces the likelihood of an upcoming downtrend. Traders may consider this signal as a stronger indication to support their decision to enter a short position. This is the point where we can invest another $50 if we already invested on the S1 signal. If we did not invested yet and we still see a clear reversal we enter the trade here with $100. Don't forget to put a stop loss as described below in the "STOP LOSS" section.
These signals provide traders with a systematic framework to identify and evaluate potential reversals in market trends. By combining the information provided by both the L1 and L2 signals (for uptrends) or the S1 and S2 signals (for downtrends), traders can gain more confidence in their assessments of trend reversals. This indicator offers traders a valuable tool to capitalize on these reversal opportunities and make more informed trading decisions.
It is important to exercise caution and avoid blindly following the signals generated by the indicator. Instead, it is recommended to seek additional confirmations from other technical indicators such as the RSI (Relative Strength Index), MACD (Moving Average Convergence Divergence), or any other indicators that you are familiar with and trust.
While the signals provided by the indicator can be a useful starting point, relying solely on them may not always guarantee accurate predictions. By considering other technical indicators, traders can gain a more comprehensive view of the market conditions and validate the signals received from the indicator.
The RSI is a popular momentum oscillator that measures the speed and change of price movements. It helps traders identify overbought and oversold conditions, giving insights into potential trend reversals. The MACD, on the other hand, combines moving averages to provide signals for trend identification, as well as momentum and divergence analysis.
By utilizing these additional indicators or any others that you are familiar with, you can confirm the signals generated by the indicator under consideration. This approach enhances the reliability of your trading decisions by adding another layer of analysis and reducing the potential for false signals.
Each trader may have their preferred set of technical indicators based on their trading style and experience. It is important to select indicators that align with your trading strategy and complement the signals received from the indicator in question. This way, you can make more informed and well-rounded trading decisions, increasing the probability of successful trades and minimizing potential risks.
Stop Loss:
When initiating a trade, it is our standard practice to implement a stop loss order based on the stop loss signal derived from the current or preceding candle. These stop loss signals are generated using the Average True Range (ATR) indicator.
By employing a stop loss order, we aim to limit potential losses in case the trade moves against our anticipated direction. The stop loss signal, determined from the current or previous candle, provides a specific level at which the stop loss order is placed.
The Average True Range indicator is utilized to gauge the volatility of the market and determine an appropriate stop loss level. It takes into account the price range of the asset over a defined period, considering both high and low price points. By using the ATR, we can identify an optimal stop loss level that accounts for the asset's recent price fluctuations.
Implementing a stop loss based on the ATR-derived signal adds a layer of risk management to our trading strategy. It helps mitigate potential losses by automatically triggering the stop loss order if the price reaches or exceeds the predetermined level. This approach allows us to protect our capital and minimize the impact of adverse price movements.
It is important to note that the ATR-based stop loss signals should be used in conjunction with other analysis techniques and indicators. They serve as a dynamic reference point that considers market volatility, ensuring the stop loss level is adjusted accordingly.
By incorporating stop loss orders based on the stop loss signals derived from the current or previous candle using the ATR indicator, we aim to safeguard our trades and manage risk effectively. However, it is important to continually monitor and adjust the stop loss level as market conditions evolve, adhering to our risk management strategy throughout the duration of the trade.
Candlestick Sequence:
The Candlestick Sequence is a calculation used to identify potential trend reversal points in the financial markets. It consists of two main components, the Candlestick Sequence and the Candlestick Reversal. The Candlestick Sequence and Candlestick Reversal offer a structured way to identify potential reversals in the market.
WARNING:
• It is not advisable to engage in Leverage Trading unless you possess chart reading skills.
• It is not advisable to engage in Leverage Trading unless you are capable of interpreting technical indicators such as RSI, Moving Average, MACD, and others.
• It is crucial not to blindly follow trading signals without conducting your own analysis (DYOR - Do Your Own Research).
• Avoid succumbing to FOMO (Fear Of Missing Out) and impulsively entering trades. If you miss an entry point, it is important to let it go and patiently wait for the next potential entry point.
Leverage trading involves trading with borrowed funds, which amplifies both potential profits and losses. To participate in this form of trading, it is imperative to possess a certain level of expertise and knowledge. One key requirement is the ability to read and analyze charts effectively. Chart reading involves understanding various chart patterns, price movements, and support and resistance levels, among other factors. Without this skill, it can be challenging to make informed decisions and manage risk appropriately.
Additionally, leverage trading relies on technical indicators to identify potential trading opportunities and gauge market conditions. It is essential to have the ability to interpret indicators such as RSI, Moving Average, MACD, and others, as they provide valuable insights into market trends, momentum, and potential reversals. Ignoring or misunderstanding these indicators can lead to incorrect trading decisions and increased risk exposure.
Moreover, it is crucial not to blindly rely solely on trading signals, including those generated by indicators or other sources. While signals can be helpful, they should always be complemented by conducting one's own analysis. This entails conducting thorough research, considering multiple factors, and validating the signals with additional indicators or technical analysis techniques. This approach helps in making more informed and well-rounded trading decisions.
Finally, FOMO can be a detrimental emotion that drives impulsive and irrational trading behavior. It is important to avoid entering trades solely because of the fear of missing out on potential profits. If an entry point is missed, it is recommended to exercise patience and discipline by waiting for the next suitable opportunity. This approach helps to avoid unnecessary risks and maintain a more strategic and calculated trading approach.
By adhering to these warnings and taking the necessary precautions, traders can approach leverage trading more responsibly and increase their chances of success while mitigating potential losses.
REMARKS:
• It is important to emphasize that any information or content you encounter here is not intended as financial advice. We want to make it clear that we are not authorized or qualified to provide personalized investment advice. Our content, including ideas, opinions, views, predictions, forecasts, commentaries, suggestions, or stock picks, should be viewed strictly as informational, entertaining, or educational material.
• We emphasize that you should not construe the information provided here as personal investment advice or as a recommendation to take specific investment actions. It is crucial to conduct your own research, consider your individual financial circumstances, and consult with a qualified financial professional before making any investment decisions.
• While we aim to provide accurate and reliable information, we cannot guarantee the absence of errors or inaccuracies. Therefore, it is recommended to independently verify any information provided and exercise your own judgment when using it for decision-making purposes.
• Please be aware that any actions you take based on the information found here are done so at your own risk. We disclaim any liability for the consequences of your actions or decisions stemming from the information presented.
• Our intention is to provide helpful information that can contribute to your overall understanding and assist you in making better-informed decisions. However, it is essential to exercise caution, seek professional advice, and take responsibility for your investment choices.
Cheers & Good luck.
Brutal ScalpsThe "Brutal Scalps" indicator is designed for both novice and expert traders looking to take advantage of short-term price movements. This powerful tool provides a multi-timeframe trend analysis along with dynamic Take Profit (TP) and Stop Loss (SL) levels, enhancing your trading decisions and risk management.
Features:
Multi-Timeframe Trend Analysis - You get a bird's eye view of the main oscillators on the selected timeframe
Last trade panel - Overview of the last trade values: TPs, SL and entry along with a quick stat on the performance over the last 10 trades
Baseline - MA based on either volatility or volume . Changes color depending on the angle and the consolidation area threshold that can be modified.
ATR(Average True Range) dynamic take profits and stop losses
Trend color - Can be enabled to highlight local trend start and end
Leverage setting
This setting is used to send a leverage amount with your alerts, this can be useful if you send your alerts though webhooks.
Signalling type - Classic
The original Brutal scalps signal detection mechanism based on order block/ engulfing candle detection only. Conditions in the MTF trend analysis panel must be met.
Signalling type - Breakout
Prioritizes candle formation that break a given number of candle formation(Eg. Highest high in the last x candles) , combined with the baseline entry condition
Signalling type - Trend following
Angled more towards longer direction moves. Uses adx combined with the price relationship to the 200MA
Key levels zone- Plots the liquidity pockets on the chart
Swing detections- uses moving averages that are plotted in regards to the selected number of candles.
Candle colors - The yellow candles are bullish engulfing candles, while the purple candles are bearish engulfing candles. These candles are also highlighted because their volume exceeds that of the previous 10 candles.
Peak profit - shows a label that displays the highest profit level reached after the signal was triggered , multiplied by the leverage in the input.
How to use:
Brutal Scalps is like your battle plan, you prepare for facing the markets with tools and insights.
1. Use the Multi TF Trend settings to set up the Trend Table in the top right (default position) panel. This will give you an overview of the oscillators in the selected timeframe. You should always watch a higher timeframe than the one you are using on the chart.
Ex.: If you are charting 15m , use the 1hr setting on the trend panel.
2. The baseline is one of the key factors in signal identification, use this wisely. The baseline consolidation threshold is the sensitivity of the line to stagnating candles. If the market is static and no trades come out , it might be because the threshold is set too high. The default of 3 should be a good fit for most setups. Just bare in mind that the higher the threshold the more candles will be considered as a consolidation area. Higher threshold also means better confirmation but also less trades coming in.
3. Signalling types can and should be used in regards to the current market formation.
Examples:
- If a market is moving in a stairs pattern, a good way to tackle it would be through the breakout signalling type.
- When the market is clearly trending, the use of the trend following type is most suited.
- If you want an all-rounder setup that is a jack of all trades but master of nothing, then the Classic type would be the most suited.
Additionally, if the market is extremely undecided and the above types don't perform that well on their own, the use of Allow Opposite Signal Only can reduce losses by only posting trades that are in the opposite direction, no more consecutive buys or sells.
Set the key levels zones to have extra manual confirmation. These zones are based on order blocks and highlight important liquidity areas. While these don't have any direct impact on the signal recognition, they can help to visually validate them.

Kalman MomentumKalman Filter
The Kalman Filter is an algorithm used for recursive estimation and filtering of time-series data. It was developed by Rudolf E. Kálmán in the 1960s and has found widespread applications in various fields, including control systems, navigation, signal processing, and finance.
The primary purpose of the Kalman filter is to estimate the state of a dynamic system based on a series of noisy measurements over time. It operates recursively, meaning it processes each new measurement and updates its estimate of the system state as new data becomes available.
Kalman Momentum Indicator
This indicator implements the Kalman Filter to provide a smoothed momentum indicator using returns. The momentum in this indicator is calculated by getting the logarithmic returns and then getting the expected value.
The Kalman calculation in this indicator is used to filter and predict the next value based on the logarithmic returns expected value.
Here's a simplified explanation of the steps and how they are applied in the Script:
State Prediction: Predict the current state based on the previous state estimate.
Error Covariance Prediction: Predict the covariance of the prediction error.
Correction Step:
Kalman Gain Calculation: Calculate the Kalman gain, which determines the weight given to the measurement.
State Correction: Update the state estimate based on the measurement.
Error Covariance Correction: Update the error covariance.
In this Script, the Kalman Filter is applied to estimate the state of the system, with two state variables.
When the Kalman Momentum is above 0, there is positive momentum or positive smoothed expected value.
When the Kalman Momentum is below 0, there is negative momentum or negative smoothed expected value.
How to Use:
Trend Identification:
Positive values of the Kalman Momentum Indicator indicates positive expected value, while negative values suggest negative expected value.
You can look for changes in the sign of the indicator to identify potential shifts in market direction.
Volatility Analysis:
Observe the behavior of the indicator during periods of high and low volatility. Changes in the volatility of the Kalman Momentum Indicator may precede changes in market conditions.
Filtering Noise:
The Kalman Filter is known for its ability to filter out noise in time series data. Use the Kalman Momentum Indicator to filter out the noise in momentum to catch the trend more clearly.
Squeezes:
At time there may be squeezes, and these are zones with low volatility. What could follow after these zones are expansions and huge trending moves.
Indicator Settings:
You can change the source of the calculations.
There is also a lookback for the log returns.
Understanding Expected Value in Trading:
The Expected Value is a fundamental concept that shows the potential outcomes of a trading strategy or individual trade over a series of occurrences. It is a measure that represents the average outcome when a particular action is repeated multiple times.
Images of the indicator:

buyer_seller_scalping_indicatorThis code is a custom script designed for analyzing trading volume within a specific time window on the TradingView platform. It offers a comprehensive analysis of buying and selling activity during a defined period and provides visual aids and data summaries for traders to make informed decisions. Here's a detailed breakdown of its functionality and how to use it:
1. Custom Time Period: The script starts by allowing you to specify a custom time period for analysis. In this example, it's set from 04:00 to 09:29. You can modify these time values to suit your specific trading needs.
2. Volume Calculation: The script calculates buying and selling volume based on price levels. It takes into account the open, high, low, and close prices to determine whether buying or selling pressure is dominant during the specified time frame.
3. Total Volume Calculation: It calculates the total volume within the custom time period. This can help you gauge the overall activity and liquidity during the chosen time window.
4. Visualizations: The script then plots visual elements on the chart:
- A volume histogram, which provides a graphical representation of the total volume during the time period.
- Buying and selling volume indicators, which are shown as circles on the chart, highlighting the relative strength of buyers and sellers.
- An average volume line, represented in gray, which helps you identify the average trading volume over a 50-period moving average.
5. Volume Type Determination: The script determines whether buyers or sellers dominate the market during the specified time period. It labels this as "Buyers Volume > Sellers Volume," "Sellers Volume > Buyers Volume," or "Buyers Volume = Sellers Volume." This information can be crucial for assessing market sentiment.
6. Percentage Breakdown: The script calculates the percentage of buying and selling volume in relation to the total volume, helping you understand the distribution of market participants. These percentages are displayed in a table.
7. Table Display: Finally, the script creates a table that displays the following information:
- The current volume type (buyers, sellers, or balanced), with corresponding text colors.
- The percentage of buyers and sellers in the market.
How to Use:
1. Copy the script and add it as a custom script on TradingView.
2. Apply the script to your desired financial chart.
3. Adjust the custom time period if needed.
4. Interpret the visual elements and table to gain insights into market sentiment and volume distribution during the specified time frame.
5. Use this information to inform your trading decisions and strategies, especially when trading within the chosen time window.
This script is a valuable tool for traders seeking to understand market dynamics and volume behavior during specific trading hours, ultimately aiding in more informed trading decisions.
Disclaimer:
The indicator provided herein is experimental and has not undergone comprehensive testing. Its usage is solely at your own risk.
The publisher assumes no responsibility for any trading decisions made based on the utilization of this indicator.

RenkoIndicatorIntroduction:
The Renko Indicator is a powerful tool designed to help traders identify trends and potential trade opportunities in the financial markets. This indicator overlays a Renko chart on the main price chart and generates Buy and Sell signals based on Renko brick movements. Renko charts are unique in that they focus solely on price movements, ignoring the element of time. In this guide, we will walk you through how to use the Renko Indicator effectively in your trading strategy.
Indicator Components:
The Renko Indicator consists of several components, each serving a specific purpose in aiding your trading decisions.
Market Sentiment Calculation:
At the top of the script, the indicator calculates market sentiment by analyzing recent price action. It determines whether the market sentiment is Bullish, Bearish, or Neutral based on the highest and lowest prices within specific time periods. This information provides you with a broader context for potential trading decisions.
Renko Chart Creation:
The indicator creates a Renko chart overlay on the main price chart using the Average True Range (ATR) method. ATR is used to calculate the brick size for the Renko chart, allowing you to adjust the sensitivity of the chart to price movements.
Renko Open and Close Midpoint:
The script plots the midpoint of Renko open and close prices as a line on the main chart. This visualization helps you understand the direction of Renko bricks and identify trends.
Buy and Sell Signal Generation:
The script generates Buy and Sell signals as label shapes on the chart. A Buy signal is generated when the Renko close price crosses above the Renko open price, indicating potential upward momentum. Conversely, a Sell signal is generated when the Renko close price crosses below the Renko open price, suggesting potential downward momentum.
Alert Conditions:
To ensure you never miss a trading opportunity, the script sets up alert conditions for Buy and Sell signals. These alerts notify you when the specified conditions for potential trades are met. Alerts can be customized to your preference, allowing you to receive notifications via your chosen communication channels.
How to Use the Renko Indicator:
Market Sentiment Analysis:
Start by analyzing the calculated market sentiment. This information helps you understand the broader trend in the market. A Bullish sentiment indicates potential upward movement, a Bearish sentiment suggests potential downward movement, and a Neutral sentiment signals uncertainty.
Renko Chart Interpretation:
Observe the Renko chart overlay and its midpoint line. Upward-trending Renko bricks suggest Bullish momentum, while downward-trending bricks indicate Bearish momentum. Use the Renko chart to identify trends and confirm your trading bias.
Buy and Sell Signals:
Pay close attention to the Buy and Sell signals generated by the indicator. A Buy signal occurs when the Renko close price crosses above the Renko open price. Conversely, a Sell signal occurs when the Renko close price crosses below the Renko open price. These signals highlight potential entry points for trades.
Alert Notifications:
Make use of the alert conditions to receive real-time notifications for Buy and Sell signals. Alerts help you stay informed even when you're not actively watching the charts, allowing you to promptly take action on potential trade opportunities.
Risk Management and Considerations:
Confirmation: While the Renko Indicator provides valuable insights, it's crucial to use it in conjunction with other technical and fundamental analysis tools for confirmation.
Backtesting: Before implementing the indicator in live trading, conduct thorough backtesting on historical data to assess its performance and suitability for your trading strategy.
Position Sizing: Determine appropriate position sizes based on your risk tolerance and the signals provided by the indicator. Avoid overleveraging your trades.
Market Conditions: Be mindful of market conditions and news events that could impact price movements. Use the Renko Indicator as a tool to enhance your decision-making process, not as a standalone strategy.
Conclusion:
The Renko Indicator offers a unique perspective on price movements and can be a valuable addition to your trading toolkit. By analyzing market sentiment, interpreting Renko chart patterns, and acting on Buy and Sell signals, you can make informed trading decisions. Remember to practice proper risk management and integrate the Renko Indicator into a comprehensive trading strategy to achieve consistent and successful trading outcomes.

Stocashi + CaffeineCrush Momentum Indicator by CoffeeShopCryptoThis is just a fun script to give a different representation to the ever popular Stochastic RSI
Even for me over the years the stochastic has been a difficult one to use in trading merely because of its choppy look.
Since Heikin-Ashi Candles do such a powerful job in smoothing out the look of choppy markets,
I decided to test it out on the look of the Stochastic RSI.
From an initial visual standpoint it worked out WAY better than I thought but it seemed to need something more.
I decided to use the PineScript "Color.From_Gradient" feature to give the Stochastic a more 3 dimensional look, which really brought the "old-school" indicator to life.
Description:
The CaffeineCrush Momentum Indicator is your ultimate trading companion, blending the invigorating world of coffee with the excitement of market momentum. Just like a finely brewed cup of joe,
This indicator provides you with a powerful insight into market dynamics, helping you stay in the trading groove.
As you sip on this caffeinated delight, CaffeineCrush monitors the velocity and strength of price movements,
measuring the momentum of the market. But here's where it gets even more enticing – it goes a step further by incorporating a pressure indication, adding a stimulating twist to your trading experience.
Imagine yourself in a bustling coffee shop, surrounded by the aroma of freshly roasted beans and the energetic buzz of conversations.
CaffeineCrush mimics that atmosphere, keeping you on your toes, always aware of market forces at play.
With CaffeineCrush, you'll never miss a beat. It identifies and highlights moments of heightened momentum and increased pressure,
giving you an edge in capturing profitable opportunities. Just like a perfectly extracted espresso shot, this indicator helps you maintain your trading momentum and navigate the market with confidence.
So, grab your favorite cup of joe, fire up your trading charts, and let CaffeineCrush awaken your trading prowess.
Stay in the groove, embrace the buzz, and master the momentum with this flavorful indicator by your side.
Divergence -
Regular Divergence shows when there is a conflict between the strength of the trend and the swing of the price movement.
Hidden Divergence -
Are to be traded using the same methods as hidden divergences of the MACD or the RSI. A hidden divergence is commonly a trend CONTINUATION move.
Pink Pause -
This shows a ranging area where price is taking a pause. It can be a single candle or a string of candles. But histogram with continue with its RED / GREEN colors once the pause is over.
Stocashi + CaffeineCrush is not an entry / exit indicator. It's designed to help you understand:
1. Weather your trend is continuing
2. When it pauses
3. Has your pullback started / ended
Its best used near area of conflict. For example:
1. If you have a breakout to the low side of support zone, and you get a BULLISH divergence, this can be viewed as a false breakout.
2. If you trading towards the opposite area of a range or key level and you get conflicting movement in the Stocashi + CaffeineCrush, then you should take ur profits and wait for the next move.
3. If you are following through with example 2 above, but get NO conflicts, you can immediately look for a secondary take profit area and split / hedge your take profits.

Pro ScalperOverview
The Pro Scalper indicator is a powerful day trading tool designed specifically for the 30-minute timeframe, catering to stock and cryptocurrency markets. It provides traders with buy and sell signals, dynamic overbought/oversold zones, and reversal signal indicators. By combining a Kalman-adapted Supertrend calculation for buy and sell signals, and VWMA bands to determine overbought/oversold zones, this indicator aims to assist traders in identifying potential trading opportunities for scalping and day trading strategies using trend-following and mean-reverting methods. This combination of Kalman Filtering with an adapted Supertrend seeks to mitigate false signals, filter out market noise, and aims to provide traders with more reliable buy and sell indications.
Features
Buy and Sell Signals: Pro Scalper generates buy and sell signals based on a Kalman-adapted Supertrend calculation. These signals help traders identify potential entry and exit points in the market.
Dynamic Overbought/Oversold Zones: The indicator dynamically calculates overbought and oversold zones using VWMA bands. These zones provide valuable insights into potential price exhaustion levels, aiding traders in managing risk and identifying potential reversals.
Reversal Signals (R Labels): The indicator includes "R" labels that indicate potential reversal signals. These signals are based on the overbought/oversold zones calculated with VWMA bands. The appearance of an "R" label suggests a possible price reversal, offering traders an additional tool for decision-making.
Calculations
This indicator stands out as a unique tool due to unique Kalman filtering and altered Supertrend calculation, as well as its combination of specific features. This indicator combines the following calculations to provide its features:
Kalman Filter: The indicator employs a Kalman Filter to adapt the Supertrend calculation. This calculation was based on mathematical equations derived from Rudolf E. Kalman. This Kalman Filter helps smooth out price data, reducing noise and removing outliers from data.
Supertrend Calculation: This particular supertrend possesses alterations to price series data and ATR calculations in an aim to improve signal accuracy. Additionally, the calculation uses Kalman-filtering within the calculation to provide a powerful framework to handle uncertainties, noise, and changing conditions.
VWMA Bands: VWMA (Volume-Weighted Moving Average) bands are calculated using the highest high and lowest low values with specified multipliers. These bands are used to determine the dynamic overbought and oversold zones, giving traders insights into potential price exhaustion levels. These are included with the aim to adapt to changing market conditions and price data. This adaptability allows the zones to accurately reflect the current price volatility and trend.
Utility
This tool provides traders with valuable information for scalping and day trading strategies in the 30-minute timeframe. It helps traders by:
Generating buy and sell signals, indicating potential entry and exit points.
Calculating dynamic overbought/oversold zones, enabling traders to identify potential price exhaustion levels.
Displaying "R" labels to highlight potential reversal signals.
Offering optional alerts for reversal signals, buy/sell signals, allowing traders to stay updated even when they're not actively monitoring the charts.
Remember, past performance does not guarantee future performance. Traders should utilize this indicator as part of a comprehensive trading strategy and exercise their own judgment when making trading decisions.

Scalping The Bull - BullBot for Stock and ForexName : Scalping The Bull - BullBot for Stock and Forex.
Category : Scalping tool for the Stock and Forex market, optimized for trend following and mean reversal operations.
Timeframe : Recommended to be used on timeframe 1m, 5m, 30m, 1h, 1D, depending on the specific technique.
Technical Analysis : The indicator implements the trading techniques of Scalping The Bull. Even if the techniques are exquisitely discretionary, we have written the indicator with our interpretation of the them to identify the patterns automatically. We also codified a the process described below, giving the possibility to trade mechanically. The indicator is designed for a short-term (intraday or scalping) trend-following approach, where the entry is made on the breakout of significant price levels. Entry setups are calculated by price action analysis using 5-10-50-200 EMAs as reference. According to the interaction of price action with the EMAs, patterns are generated, and the indicator finds them independently.
Suggested use :
The process follows:
1. Selection of the instrument to trade on
Given the short duration of the trades, there must be sufficient volatility and liquidity. You can add the different instruments to a TradingView watch list and then make a first skim, considering the daily percentage change. Once an instrument has been selected, the indicator allows you to check at a glance things like the Rate of Change (ROC) and the detection of opening gaps.
2. Identification of the main trend
Once in the instrument, the main trend of the underlying is identified through the 50-200 EMAs: if the fast EMA is greater than the slow one, we have a bullish trend, otherwise a bearish trend on a higher timeframe than the one in which the trade is executed. The rule is to trade in favor of the main trend. For this reason, the indicator prints to chart reference averages. It is also recommended to check the daily timeframe, always using the averages, preferring those instruments where the price follows an average without touching it too often.
3. Identification of breakout levels
Breakout levels favoring the trend are identified near the daily high/minimum, the previous day's high/minimum, or the weekly high/minimum. The indicator prints such levels on the chart with lines.
4. Identification of secondary trends and entry levels
Patterns can be divided into three categories. Trend-based ones have the function of identifying the secondary trend and then confirming the trade. Breakout patterns are used to find entry levels.
a. Trend Continuation Patterns (Price/EMA) : are used to get confirmation that the minor trend is in agreement with the major trend (i.e., Shimano, Dive, Dip, Anti-crossing).
b. Trend Change Patterns (Price/EMA) : are used to get confirmation that a minor trend in the opposite direction of the main trend is ending and therefore are used to get further confirmation of the trade (i.e., Bounce, Viagra, Return to Highs/Minimums).
c. Breakout Patterns : identify the optimal price levels for trade entry (i.e., Third Touch, Bud, Maxi Bud, Color Change).
Details on how the specific patterns are computed can be found below in the description of this indicator.
5. Definition of Stop Loss and Take Profit
Once the entry price is calculated, different types of Stop Loss (e.g., relative minimum of Tot candles, first or second average below price, price levels) and Take Profit (relative maximum of Tot candles, first or second average above price, price levels) can be considered. A risk/reward ratio of at least 1.2 should always be considered, depending on one's risk appetite.
6. Define the position management strategy
Normally, when a mock breakout is executed, the advice is to exit the trade as soon as possible or at least to bring the stop-loss to break even. A trailing stop on relative lows or the nearest average is also possible.
7. Enter the position
Usually, with a stop order, follow the rules defined in the previous steps.
Configuration :
Graphical configuration :
Show ROC filter : turns the background green when the asset has enough volatility to activate patterns.
Show Legend : enables the description on the lines of the trigger points.
Show Table : displays the volatility table where the GAP and ROC (Rate of Change) information is present.
Show Take Profit % - Automatic : shows the percentage scale that automatically adjusts to the volatility of the chart to identify the Take Profit and Stop Loss at a glance.
Label color : adjusts the color of the labels.
Trigger Point Colors : Adjust the colors of the trigger points.
Trigger Points
Today's highs and lows : draw on the chart the closing price of Yesterday, the opening price of the daily candlestick, and the highs and lows of the day (high in purple, low in red, Yesterday's close in green, and open in orange).
Yesterday's highs and lows : draw on the chart the highs and lows of the previous day (high in yellow, low in red). An alert can be activated with a % offset.
Weekly highs and lows : draw the highs and lows of the previous week on the chart (high in white, low in red). An alert can be activated with a % offset.
Price Patterns :
Gap : a label and an alert can be activated.
Pay..!! : a label and an alert can be activated.
Third Touch and Third Touch on EMA : a label and an alert can be activated.
Return to Highs : a label and an alarm can be activated.
Return to Lows : a label and an alarm can be activated.
Long and Short Color Change : a label and an alert can be activated.
EMA Patterns :
Viagra long and short : a label and an alert can be activated for the specific market and EMA situations.
Shimano : a label and an alert can be activated with a configurable candlestick threshold.
Emergence - Dive : a label and an alert can be activated.
Anti-crossing - Anti-crossing short : a label and an alarm can be activated.
Bounce on EMA long and short : a label and an alert can be activated with a configurable tick tolerance.
Bud - Maxi Bud - Bud Short : a label and an alert can be activated on all timeframes.
Alerts :
Activate all alerts : you can activate alerts by clicking on Alerts, then on the condition "BullBot" and then on "Any alert() function.". So that you know, creating alerts on the price-EMA crossing is also possible.
Patterns :
The list of patterns that are automatically recognized by the indicator follows.
Gap : indicates when a Gap Up or Gap Down occurs at the opening of a session, particularly useful in the equity markets.
Pay : signals when the stock has risen by a sufficient percentage to be tradable, adjusts the triggering of many bounce and breakout patterns.
Viagra : signaled for both a long and short setup, indicates an overbought or oversold situation by the appearance of gaps and a series of consecutive candles contained by the fast EMAs (5 -10) depending on the market of reference.
Third touch and third touch EMA : signals a breakout conformation, indicated when three touches occur at the same price level or below one of the slow EMAs (50 - 200).
Shimano : detects lateralization between Ema 50 and Ema 200, indicating that we are in a retracement phase and that a new impulsive move may soon develop.
Emergence - Dive : these are the main patterns for identifying the trend. The indicator signals when the EMA 50 and 200 are approaching to anticipate their crossing to the top or bottom.
Anti-crossing long - Anti-crossing short : occurs when the price, after an important impulse, makes a retracement to the EMA 200, bringing the EMA 50 to approach it without ever touching it, but before the cross, an opposite impulse determines the end of the retracement and the resumption of the trend in place.
Rebound : signals in the first rebound on the EMA 50 and EMA 200 after an impulse that recorded new highs or lows.
Return to the Highs - Return to the Lows : this pattern is closely related to rebounds. It indicates that the price is approaching the highs or lows again after a rebound on a slow EMA.
Change Color : is based on the previous session's closing price. It indicates when the price is approaching either from above or below this level, which determines the Color of the daily candlestick.
Bud - Maxi Bud - Bud Short : Bud occurs when the price breaks above EMA 10, and there are at least two consecutive candles between the high and low of the breakout impulse. Maxi Bud signals near the day's highs when this situation occurs, and Bud Short signals the breakout levels for a short trade.

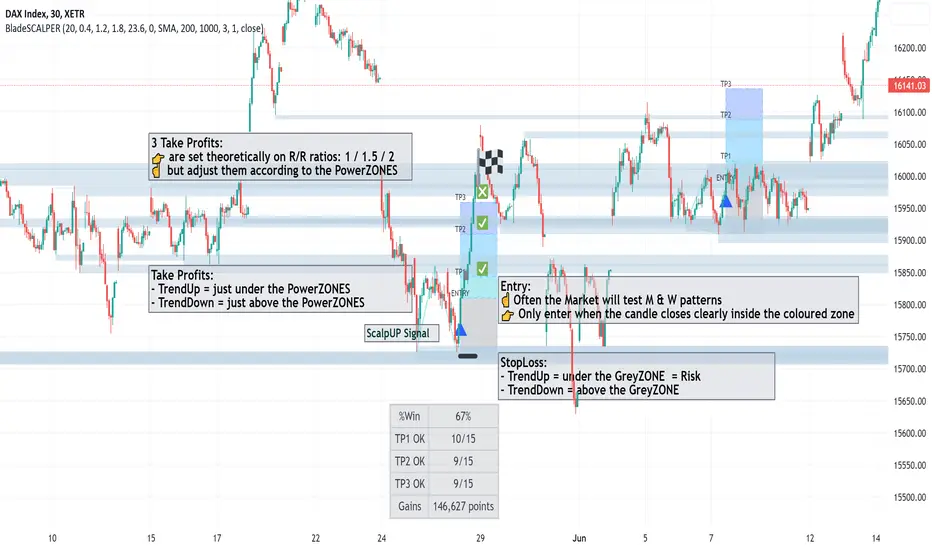
BladeSCALPER by MetaSignalsProBladeSCALPER
The sharpest tool to scalp M and W patterns
--------------------------------------------------------------------------
✔️ Get a clear signal of the next probable reversal move
✔️ Get instantly the zone where the price will probably get attracted to
✔️ Adjust TP1/TP2/TP3 accordingly to the PowerZONES
✔️ Check the winning rate of the M & W patterns on a time period
✔️ Optimize the probability of success of the M & W patterns
---------------------------------------------------------------------------
📌 For who?
---------------
Initialy, scalping is based on small moves, supposedly more predictable than big ones and repeating this operation many times.
For that, scalping means usally daytrading and not everybody can/want to be a daytrader: managing one's emotions is just critical;
But you can also use this indicator on a bigger time frame and trade when you want the M & Ws!
So basicaly BladeSCALPER is for anybody who wants to trade succesfully M&W patterns whatever Timeframe, whatever asset!
📌 For which asset?
-------------------------
BladeSCALPER is universal and works fine on all assets and all time-frames;
📌Why we made these innovations?
--------------------------------------------
"Double Tops" and "Double Bottoms", commonely called "M" and "W" as the letter explicitely shows these patterns, are some of the most predictive patterns you can find.
To exploit them, we needed to have an all in one tool:
◾ a very sharp scalping and innovative tool with embed statistics
◾ identify Risk/Reward ratio for TakeProfits
◾ and advanced Supports and Resistances information i.e the PowerZONES
📌 How to trade with BladeSCALPER ?
-----------------------------------------------
🔹 ScalpUP / ScalpDOWN Signals
The signals are given when the patterns of M and W are identified, in real time and do not repaint.
☝️ Quite often the Market will test the bottoms and the tops before validating such a figure;
👉 Only enter the trade when the candle closes clearly inside the coloured zone and not immediately on the signal.
🔹 PowerZONES
We innovated on the basic Supports and Resistances concept by adding new features with:
◾ zones that correspond better to real life trading than lines
◾ zones that change color depending of their position vs price : they turn red is the price is below them and blue if they are above.
◾ strength / attractivity of these zones = how many times the Support/Resistance have been touched in the past that will magnetize the price
◾ and distance between these zones to give a clear picture
Importance of the PowerZONES
In the current version, the TPs do not adjust to the PowerZONES, precisely to be able to keep a global statistical view;
☝️ But when you plan to trade on a signal, the real relevance is to adjust them according to the PowerZONES, of course;
👉 When buying, place your TPs just below the consecutive PowerZONES that the price could test
👉 When selling, place them just above the consecutive PowerZONES
🔹 TP1/TP2/TP3
TakeProfits are set theoretically and based on 3 risk/reward ratios: 1 / 1.5 / 2 ;
But of course this is just a setting to get an overall view of the effectiveness of the pattern on the current asset;
if you change these settings, you'll see that the Stats change accordingly.
☝️ Again, when you plan to trade on a signal, the real relevance is to adjust them according to the PowerZONES, of course;
🔹 StatsPANEL
With this innovative feature you can now see immediately
◾ the probability of win, based on the past patterns
◾ the exacts number of trades that have reached the TP1/TP2/TP3
◾ and more importantly the gains made by these trades in pips
We introduce also 2 important possibilities to improve the precision and relience of BladeSCALPER
◾ the PatternFACTOR can be changed; it defines a key percentage of the M & W patterns
◾ the MoveringAverageFILTER can be activated to
◽ suppress M patterns when the price is below the selected MovingAverage
◽ suppress W patterns when the price is over the selected MovingAverage
👉 Modifying these variables will change immediately the statistics just like the position of the TP1/TP2/TP3 and HistoryMax variables.
📌 Importance of setting up a Multi TimeFrame and doing a trend analysis
------------------------------------------------------------------------------------------
Even if you are on a scalping mode, it is crucial you set up a Multi Time Frame workspace and that you conduct a trend analysis before entering the market.
If you don't, you won't maximize your chances;
No indicator is 100% reliable, because the market cannot be modelized; anyone who tells you otherwise is lying to your face;
However, a statistical approach to the market is possible, because agents are not incoherent.
This is the meaning of stats we apply on double tops and double bottoms;
But to reinforce this point, you need to know what's happening on the next higher time unit to get a global view.
To do this, it's important to do a trend analysis or have a trend analysis tool.
---------------------------------------------------------------------------------------------------
🎛️ Configuration
----------------------
◾ Buy/Sell Signals: choose if you want to see only W or only M pattern signals
◾ PowerZones: uncheck if you don't want to see them (not recommanded)
◾ RewardBoxText: uncheck if you don't want to see the words "Entry, TP1, TP2, TP3"
◾ TakeProfit1/TakeProfit2/TakeProfit3: by default correspond to the multiple of the risk zone in grey under/above "Entry" i.e it is the classic concept of Risk/Reward ratio
◾ PowerZoneTouch: sets the number of time the zone has been touched
◾ PowerZoneDensity: increase this number if you want the number of zones to increase and reversely
◾ RewardBoxLength: adjust the standard number to the length of the anticipated move in duration
◾ StopLossExtraPoints: for a W pattern (ScalpUP) will bring lower the lower border of the RewardBOX; in a M pattern (ScalpDOWN) will bring higher the higher border of the RewardBOX; it will automatically move the distance of the TP1/TP2/TP3
◾ HistoryMax: the number of units taken into account to set the PowerZONES and the past M & W patterns
◾ PatternFactor: defines a key percentage of the M & W patterns
◾ MovingAverageFilter:
◽ untick (by default) : the filter is OFF
◽ ticked : the filter is ON
◾ MovingAveragePeriod: choose the speed of the average
◾ MovingAverageType: choose among all the types of averages available
◾ Applied to: define on which available moment of the Price the average is applied (close, open, highest...)
🛠️ Calculation & Precisions
------------------------------------
🔹 TP1/TP2/TP3
the 3 risk/reward ratios: 1 / 1.5 / 2 are multiples of the height of the grey zone = distance between your StopLoss and the entry line;
🔹 %WIN
Note that the % of success (%WIN) must be entered correctly;
Your risk/reward ratio is key and more important than the % success of the signal; you can have a % success of 30% (%WIN) which creates more points earned than a % success of 60% depending on your risk/reward ratio = the position of your TPs;
🔹 Calculation of points/pips
These are full points and we don't calculate partial outputs.
So if you have a tp1 at 20 and a tp2 at 100, if you get to tp2 you get 100 and not 20+100.
Stoplosses are of course calculated in negative.
🔹 PowerZONES
The originality of our concept is to test how many times a zone has been touched
The more the market has touched this zone the more probable it becomes a strategic zone where the liquidity will accumulate and thus will be chased!
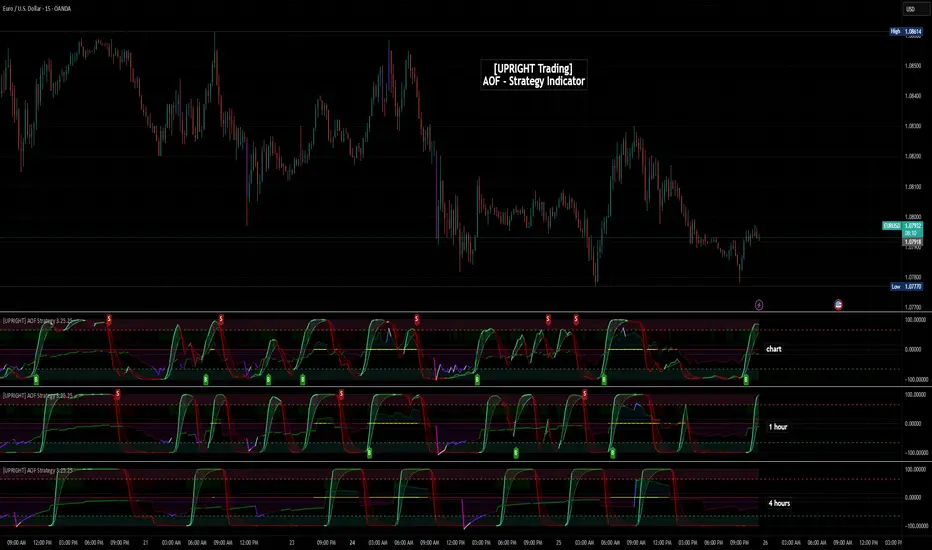
[UPRIGHT Trading] Academy of Forex - Scalp Strategy█ OVERVIEW
This is a collaboration of efforts of The Academy of Forex and UPRIGHT Trading .
The Academy of Forex - Scalp Strategy Indicator is a clean & reimagined lower indicator. To enable optimization & potential automation, we re-coded & optimized it at UPRIGHT Trading.
It is based on the one presented on its YT channel.
The idea is for it to be an easy to use - simple indicator - that works not just for confirmation, but also entering and exiting quickly (scalping).
█ CONCEPTS
The idea is that %B (derived from BBs) is able to pick up some pretty significant moves. With that as one of the bases the Inverse Fisher Transform (Ribbon) acts to show some of the movement of the asset highlighting when it at extremes. The RSI highlights are there as another confirmation to help normalize the sometimes too frequent movement of %B.
As expected the indicator often acts as a reversal indicator, but with the optimizations of logic it's able to pick up more than just the reversals and works as a pretty decent Buy/Sell Algorithm.
█ CALCULATIONS
Calculations used included, but not limited to:
- %B - Quantifies the price as a percentage to the Upper and Lower Band of the Popular Bollinger Bands, which were named after their inventor John Bollinger in 1980.
- Inverse Fisher Transform RSI - is a variation of the IFT, created by John Ehlers, the idea is for the IFT to convert Gaussian normal distribution and to take it a step further the RSI version is to just use overbought and oversold placements. This indicator is meant to highlight when price has moved to an extreme and in this process helps to spot turning points.
- Relative Strength Index (RSI) - As most of you know already the RSI is a technical analysis tool invented by J. Welles Wilder, that oscillates and is used to measure the momentum of price changes. It normalizes to index 0-100 with overbought and oversold defined by the user, but often around 70 as overbought and 30 as oversold.
- Pivot/Swing Points - Implemented to show recent Higher-Highs or Lower-Lows, Pivot points are included in the indicator for structure tracking.
- Moving Averages - Moving averages help to get an idea of when price is moving near the norm or outside to extremes.
█ FEATURES
Indicator Features:
-2 Buy/Sell Signals.
-U Signals (UPRIGHT optimized).
-Exit Reminders.
-Alerts allowing Automation of Scalp Strategy.
-H/L Swings.
-Color Customization.
-Clean Mode.
-Inverse Fisher Transform Ribbon.
-RSI Bullish/Bearish Highlights.
-Options for More Signals (including: Oversold/Overbought Circles, %B Bull/Bear Squares and Triangles, and IFT Highlights).
Showing some of the signals close up.
Should look like this:
Enjoy!
Sincerely,
Mike
OSPL Volume [Community Edition]NSE:BANKNIFTY1!
This indicator is based on the concepts popularized by @OptionsScalper123 "Siva" of OiPulse. His ideology Is that large moves come after high volume candles. For Nifty, high volume is considered to be a candle above 125k volume and for BankNifty it’s 50k.
This indicator allows you to cut the noise and focus only on the high volume candle. It shows high volume candle in a brighter shade and lower volume candles in a less visible shade.
You can set the minimum volume threshold limit for Nifty and BankNifty. The indicator smartly recognizes which index you are using it in and uses the respective threshold volume limit.
All colors are customizable.
Thanks for Siva for all the ideas and wonderful products he has given to the community
Thanks to all the wonderful Pinescipters for developing awesome indicators and keeping the source open.
The source code of this indicator is just a few lines. Hope you can use it in your projects and learn something from this just how I learned from other scripts.
Any changes or updates needed in this indicator, please suggest. I was thinking some kind of alerts can be added when volume crosses the threshold. Let me know.
Boost/like this indicator and comment if you find this useful. Cheers and happy trading!!!

Scalp Pump-Dump Detector with AlertsThis script displays the percentage of movement of all candles on the chart, as well as identifying abnormal movements to which you can attach alerts. An abnormal movement is considered a rise or fall that exceeds the parameter set in the settings (by default, 1% per 1 bar).
Added a function to display the volume on abnormal candlesticks.

Trading Session TemplateDescription:
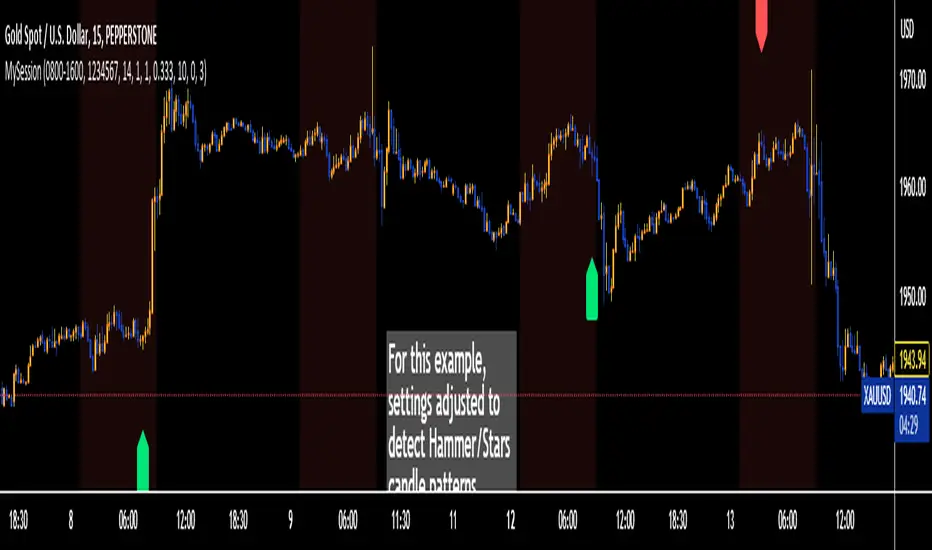
The Trading Session Template Indicator is a powerful script that allows traders to customize their own trading session time range on a chart. With this indicator, you have the flexibility to define specific hours during which you prefer to focus your trading activities. The example chart showcases the New York session hours, but you can easily adapt it to any desired time range based on your trading strategy and preferences.
Key Features:
Customizable Trading Session: The indicator empowers you to define your own trading session time range, tailored to your preferred market sessions or specific trading hours. This flexibility ensures that the indicator aligns with your unique trading strategy.
Highlighted Trading Session: When a new trading day begins, the script automatically scans for the specified time range. Once the first candle within the range begins printing, the background color of the chart is highlighted, indicating the beginning of the trading session. When the last candle within the range is closed, the background color returns to normal.
Focus on Specific Market Sessions: This indicator is particularly useful for traders who prefer to trade certain market sessions or specific hours during the day. By customizing the trading session, you can better align your trading activities with specific market conditions and trading opportunities.
Candle Pattern Detection: The indicator includes the ability to detect candle patterns such as Doji, Engulfing, Hammer, and Shooting Star. You can activate the desired candle patterns and set up alerts for them. When an alert is triggered, indicating the formation of a specific candle pattern, you can further analyze the market and make informed trading decisions.
ATR Filter: The indicator offers an ATR (Average True Range) filter to limit noise and focus on candle patterns with a size comparable to the ATR. You can set a minimum and maximum size for a candle compared to the ATR. This helps you filter out smaller or larger candles that may not align with your trading preferences.
Stop Loss (SL) and Take Profit (TP) Levels: When a candle pattern is detected, based on the ATR, the indicator can display suggested Stop Loss and Take Profit levels. This feature provides additional guidance for risk management and potential profit targets.
User-Friendly Interface: The indicator provides a user-friendly interface with adjustable settings and switches for customization. Tooltips are available to guide you through the various options and configurations, making it easy to adapt the indicator to your trading style and preferences.
Note:
The Trading Session Template Indicator is designed for timeframes lower than 1D. It does not plot any information on timeframes of 1D and higher.
Disclaimer:
The Trading Session Template Indicator is provided for informational and educational purposes only. Trading in the financial markets involves risk, and you should only trade with funds that you can afford to lose. The indicator's past performance is not indicative of future results. Always conduct your own research and due diligence before making any investment decisions. The creator of this indicator shall not be held responsible for any losses or damages incurred from the use of this indicator.
3 Fib EMAs To Scalp Them AllThe "3 Fib EMAs To Scalp Them All" was made in order to clear up when we should look for shorts, longs, or walk away. Also it can alert you when a trend starts, or when there is a possible reversal. I use it for scalping/day trading in 5m-1h timeframes.
1. EMAs: By default, the indicator uses Fibonacci numbers (21, 55, 233), but you can change them.
2. Color Changes: The color of the Micro EMA line changes depending on its relation to the Mid and Macro EMAs.
When Micro EMA < Mid < Macro EMA, it turns red, indicating a potential bearish trend - that's when you should look for shorts
When Micro EMA > Mid > Macro EMA, it turns green, indicating a potential bullish trend - that's when you should look for longs
A white Micro EMA is when you need to take some rest, enjoy your coffee, and avoid overtrading.
3. Signals: The indicator provides visual signals in the form of diamonds and crosses and corresponding alert signals.
A red diamond above the bar signals a potential beginning of a downtrend
A red cross above the bar signals the end of the downtrend and can be used as a signal for a possible reversal up/breakout.
A green diamond below the bar signals a potential beginning of a downtrend,
A green cross below the bar signals the end of the uptrend and can be used as a signal for a possible reversal down/breakout.
4. Alerts: For algo traders and people who prefer to stay away from the monitor... there are alerts for every signal.
Friendly note: Don't blindly follow the signals for your long and short entries. The signals only pop up when the EMA cross value gets a confirmation. A smart move would be to wait for a retracement to the EMA line and use momentum indicators like market cipher B to pinpoint those ideal entry points.

LNL Scalper ArrowsLNL Scalper Arrows
The indicator consist of various different types of candlestick patterns that are truly time tested by multiple veteran traders. These arrows are a combination of short-term scalping strategies taught by Linda Raschke & a trader that goes by name Quant Trade Edge. These strategies/patterns occur regularly within the markets. They offer high probability quick moves during the trending days. These four patterns are based on pure price action, no oscillators, no trend, no momentum indicators involved. Trend (ema) is there just as a simple trend gauge.
LNL Scalper Arrows were designed specifically for intra-day trading. Mostly useful for the futures but also stocks as well. These arrows can work anywhere between the fast-moving 512 or 1600 tick charts to a 1min, 2min and up to 5min or 10min charts.
Trend Gauge (Exponential Moving Average)
Nothing fancy just a classic EMA that can guide the direction of the short-term trend. I have added a custom coloring of the EMA that is based on a simple RSI filter. That should help to visualize the non-directional moments within the trend. Although the length is adjustable, for scalping it is better to focus on smaller periods such as 9, 13 or 20 or 34 but anything above 50 loses its purpose as a short-term trend gauge. Again, this is a scalping tool not a trend tool, you are not going to get rid of the fakeouts by increasing the period of the trend.
Tail Arrows (Eat the Tail Pattern)
Tail is a candlestick that is either a price rejection spike, or a flag continuation pattern on a lower time frame. A failed action. It is basically a candle with much bigger wick (shadow) of the candle than the actual body. Such candles are usually telling us about strong participation from the other side of the market. Eat the tail pattern occurs whenever the low of the Tail candle is immediately broken on a following candle "the tail is eaten alive". Such a breaks occurs in a most aggressive types of markets with a strong momentum. DO NOT try to trade this in a low volume or a ranging market. Tail Arrows are the most aggressive arrows & should be only used on the highest volume or a parabolic momentum markets.
Scalp Arrows (Scallop Pattern)
Known as Scallops or minor lows or highs, these patterns are the most common within the all scalper arrows. They occur regularly on 1min & 5min charts - basically everyday. Scallops provide the best possible risk to reward entry within the trend without the need of any indicators or oscillators. The Scallop Up 3 bar pattern consist of a high that is lower that the previous high but also low that is lower than the previous low. Scallop Up or a minor low triggers when the last high is broken, creating a three bar mountain or a peak within the 5 bar span.
Hoagie Arrows (Hoagie Pattern)
Hoagies occur way less often than any other scalping patterns. Hoagies represent two (or more) inside candles within the shadow of a first candle. Such a formation is creating a small compression or a range that sooner or later breaks out. The hoagie is triggered whenever the high or low of the shadow (first) candle is broken. The great thing about the hoagies is that they can work either way despite the trend direction. Although this indicator is coded for the 2 bar hoagies, there are no limitations on how much inside bars can hoagie include.
Umbrella Arrows (Umbrella Pattern)
Another really awesome 3 bar pattern that is really fun to trade. Umbrella occurs when the candle before the previous candle is a pin bar or a tail bar and the body of the previous candle is within the shadow or a wick of the candle before. The umbrella is triggered once the high or low of the previous bar is broken. Umbrellas are more frequent than Hoagies but occur much less than the Scallops.
Outside Bar Wedges (Outside Bar Pattern)
Pretty much self-explanatory candlestick pattern. Outside Bar is basically any bar that peaks outside of the both ends of the previous candle. So the range of the candle is higher & it looked beyond the high and beyond the low of the previous candle. These candles are signalizing the potenial momentum change. Ouside Bars usually occur at the tops or bottoms of the moves. I decided to add them because they can serve as a great addition to these scalping patterns.
Signal vs. SignalBreak Mode
The trigger can be viewed in two different ways:
1. Signal: Plots the trigger before the trigger bar, basically right when the pattern is formed but NOT YET triggered. The signal is triggered once the next candle break the high or low of the current candle.
2. SignalBrake: Plots the trigger after the break of the high or low of the actual pattern. It is basically a candle after the signal candle. (Signal is better for trading because it gives you time to prepare for the actual break of the high or low = the actual signal. SignalBrake is great for looking back in history only for the patterns that actually traded).
Pin Bar BTW Ratio
Pin Bar (Body-To-Wick) Ratio represents the size of the body of a pin bar candle for Eat the Tail and Umbrella patterns. Pin Bar BTW Ratio measures the ratio between the wick & the body of the candle. Ref. interval is 2.0 - 5.0 (ideal pin bar is 2.0 - 3.0 = the wick or a shadow is 2x - 3x bigger than the body of the candle)
ATR Stop & Target Labels
I also created three simple labels (tables) that can show you the ideal target & stop as well as the current ATR. Since LNL Scalper Arrows consist of high probability scalping patterns, a good rule of thumb to follow is to use a half of the current ATR as a target and a current ATR as a stop (or two times the target). So if the current 7 period ATR is 30 the target would be 15 pts. and a stop around 30 pts. With such a risk management you should aim for a win rate 70% or higher. Obviously you can adjust the risk management in the settings to your personal preference.
Low Range vs. High Range Markets
There are two major downsides with the Scalper Arrows:
1. You need volume and a volatility. These patterns really do struggle in ranging "boring" sideways action. It is absolutely crucial to recognize the current market environment and really stay cautions and (or completely out) in case the chop continues. Adding something like DMI can help you recognize the potential flat markets.
2. Not only do you need volume & momentum, you also need a decent range. This indicator works better on a rangy market such as NQ futures or YM. But are much tougher to trade on lower range markets such as some stocks or ZB futures or basically any other lower range market.
Hope it helps.

Bollinger Bands - Breakout StrategyThe Bollinger Bands - Breakout Strategy is a trend-following optimized for short-term trading in the crypto market. This strategy employs the Bollinger Bands, a widely recognized technical indicator, as its primary instrument for pinpointing potential trades. It is capable of executing both long and short positions, depending on whether the market is in a spot or futures, and is particularly effective in trending markets.
The strategy boasts a high degree of configurability, allowing users to set the Bollinger Bands period and deviation, trend filter, volatility filter, trade direction filter, rate of change filter, and date filter. Furthermore, it offers options for Take Profit, Stop Loss, and Trailing Stop for both long and short positions, ensuring a comprehensive risk management approach. The inclusion of a maximum intraday loss feature adds another layer of protection, making this strategy a valuable tool for traders seeking a professional and adaptable trading system.
Name : Bollinger Bands - Breakout Strategy
Category : Trend Follower based on Bollinger Bands
Operating mode : Long and Short on Futures or Long on Spot
Trade duration : Intraday
Timeframe : 2H, 3H, 4H, 5H
Market : Crypto
Suggested usage : Trending Markets
Entry : When the price crosses above or below the Bollinger Bands
Exit : Opposite Cross or Profit target, Trailing stop or Stop loss
Configuration :
- Bollinger Bands period and deviation
- Trend Filter
- Volatility Filter
- Trade direction filter
- Rate of Change filter
- Date Filter (for backtesting purposes)
- Take Profit, Stop Loss and Trailing Stop for long and short positions
- Risk Management: Max Intraday Loss
Backtesting :
⁃ Exchange: BINANCE
⁃ Pair: BTCUSDT.P
⁃ Timeframe: 4H
⁃ Fee: 0.025%
⁃ Slippage: 1
- Initial Capital: 10000 USDT
- Position sizing: 10% of Equity
- Start : 2019-09-19 (Out Of Sample from 2022-12-23)
- Bar magnifier: on
Credits :
- LucF of Pine Coders for f_security function to avoid repainting using security.
- QuantNomad for Monthly Table.
Disclaimer : Risk Management is crucial, so adjust stop loss to your comfort level. A tight stop loss can help minimise potential losses. Use at your own risk.
How you or we can improve? Source code is open so share your ideas!
Leave a comment and smash the boost button!
Thanks for your attention, happy to support the TradingView community.

NSDT Fair Value GapThis script is our version of the "Fair Value Gap".
A Fair Value Gap is nothing more than a series of 3 candles with a gap between a candle high/low and a candle high/low two candles prior.
For example:
A Gap Up - the Low of a candle is higher than the High of two candles back.
A Gap Down - the High of a candle is lower than the Low of two candles back.
Typically, on a Gap Up, the trader would wait for the price to re-enter the Gap, and take a Long position.
Typically, on a Gap Down, the trader would wait for the price to re-enter the Gap, and take a Short position.
We found that simply trading through the Gaps (fill the gap) produced a better result. So we reversed the procedure and the colors to show our suggested direction.
We have added inputs so the trader can determine the size of the Gaps to be plotted on the chart. A minimum and maximum can be set.
The number of Gaps to be displayed can be adjusted.
There is a option to remove Gaps that had been filled, to help keep a clean chart.
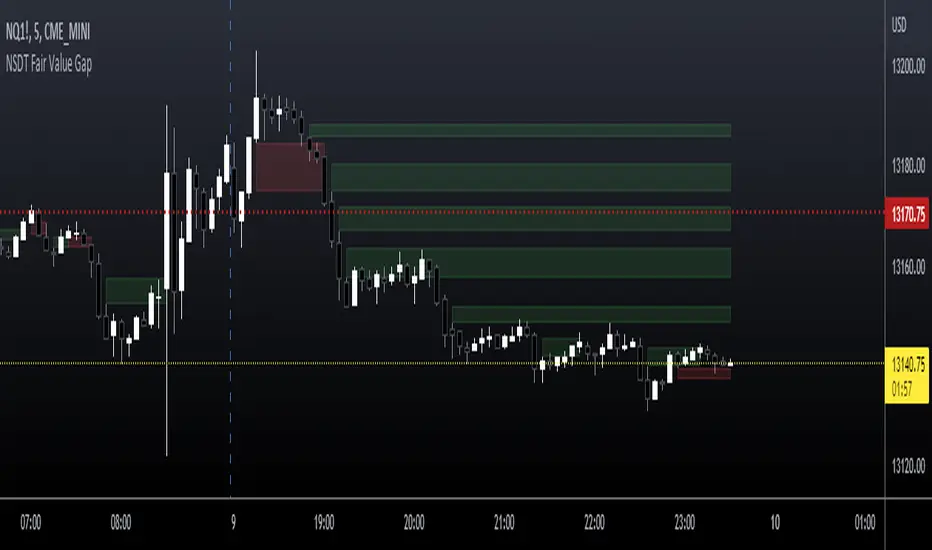
Moving Average Scalper by nnamdertWhat does this Indicator Do?
By request and popular demand, I have created a quick and easy Moving Average Crossover Scalper Indicator. This indicator simply allows the trader to visualize scalping opportunities in an easy way using MA crossovers.
The Indicator also plots multiple higher moving averages via an "optional" table. The table gives a quick glance at the overall trend (based on moving Averages alone).
Users can adjust the initial Moving Average Length and the number of additional Moving Average Lengths to be plotted on the chart.
How do I use it?
As shown below, the cross overs are very easy to see. The Stoploss "should" be set at the most recent swing high or low prior to the MA Cross.
The dotted yellow line must cross above or below the thick mutli-colored line in order to be considered valid.
As seen in the screenshot below, an optional input setting turns ON / OFF additional Moving Average "Lines" and plots them on the chart. In addition, the indicator color fills between the moving averages based on Bullish or Bearish movement. If the lines are in continuity, then the color will be either RED or GREEN depending on the market sentiment (bull or bear).
The total number of Moving Averages listed in the table can be manually adjusted in the settings by the user. The table is small and see-through so it works on mobile devices as well and allows the user to still see the candles easily. Simply double clicking on the table will bring up the settings.
As shown below, the table can be relocated to a position acceptable to the user if it is in the way. This option is available under input settings.
I hope this indicator proves useful for you and your trading style. If you have any suggestions please let me know.
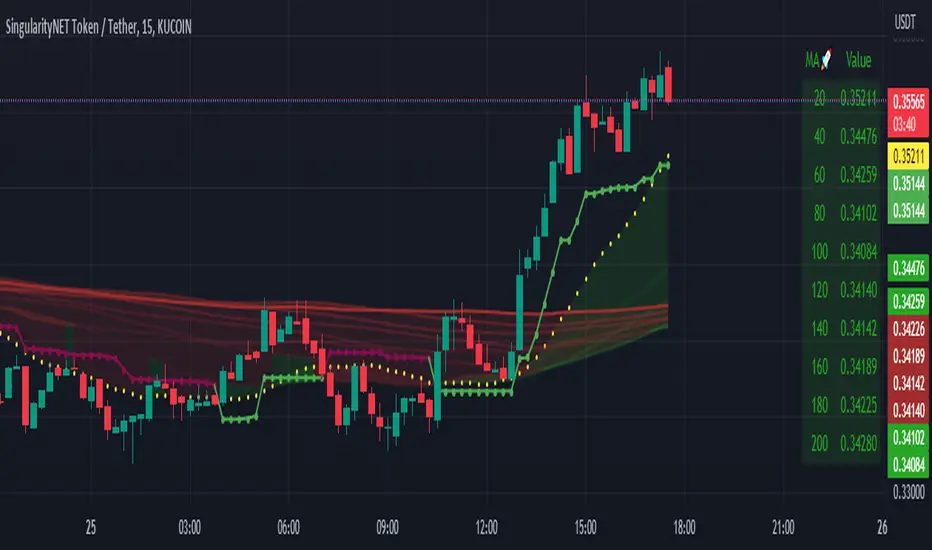
Short Only Anytime ScalperThis indicator works best in a 2-minute timeframe.
I designed this indicator to work with my proprietary scalping strategy where I use candlestick anatomy, price action, and moving averages to determine potential short entries.
Rules I use for using this indicator:
- I turn the 20MA green
- I turn the 200MA red
- I only take a short entry on the FIRST yellow or red candle painted once the 20MA comes back down crossing the 200MA once the candle fully closes red or yellow from the indicator
- The gap between the 20MA and the 200MA MUST be close (the closer the gap is the stronger the short entry can be). Note: It can be considered a false signal if the bar is colored yellow or red when the gap is far within the 20MA and the 200MA.
- My stop loss is the red line right on the top of the True Bear Bar (red) or Partial True bear bar (yellow)
- My take profit is always at 0.04% (green dots) and then I watch price action, when price action moves under my 0.04% I quickly move to stop loss to that level locking in profit while allowing profit to ride. (This indicator is meant to use in quick price action and I am usually in and out of a trade in 5 minutes or even sooner)
How to read the indicator
- Yellow painted bar at candle close: Partial True Bear Bar
- Red painted bar at candle close: True Bear Bar
- Red line painted on top of candle: Stop loss
- Green dot with green label and price: Goal profit area no matter what
You will notice that sometimes depending on the size of the bear bar, the R:R is very off compared to traditional trading, this is because this is a very quick scalping strategy that either locks in 0.04% no leverage gain or quickly puts stop loss at that level to then let profits ride.

GKD-C Trend Scalp [Loxx]Giga Kaleidoscope GKD-C Trend Scalp is a Confirmation module included in Loxx's "Giga Kaleidoscope Modularized Trading System".
█ Giga Kaleidoscope Modularized Trading System
What is Loxx's "Giga Kaleidoscope Modularized Trading System"?
The Giga Kaleidoscope Modularized Trading System is a trading system built on the philosophy of the NNFX (No Nonsense Forex) algorithmic trading.
What is the NNFX algorithmic trading strategy?
The NNFX (No-Nonsense Forex) trading system is a comprehensive approach to Forex trading that is designed to simplify the process and remove the confusion and complexity that often surrounds trading. The system was developed by a Forex trader who goes by the pseudonym "VP" and has gained a significant following in the Forex community.
The NNFX trading system is based on a set of rules and guidelines that help traders make objective and informed decisions. These rules cover all aspects of trading, including market analysis, trade entry, stop loss placement, and trade management.
Here are the main components of the NNFX trading system:
1. Trading Philosophy: The NNFX trading system is based on the idea that successful trading requires a comprehensive understanding of the market, objective analysis, and strict risk management. The system aims to remove subjective elements from trading and focuses on objective rules and guidelines.
2. Technical Analysis: The NNFX trading system relies heavily on technical analysis and uses a range of indicators to identify high-probability trading opportunities. The system uses a combination of trend-following and mean-reverting strategies to identify trades.
3. Market Structure: The NNFX trading system emphasizes the importance of understanding the market structure, including price action, support and resistance levels, and market cycles. The system uses a range of tools to identify the market structure, including trend lines, channels, and moving averages.
4. Trade Entry: The NNFX trading system has strict rules for trade entry. The system uses a combination of technical indicators to identify high-probability trades, and traders must meet specific criteria to enter a trade.
5. Stop Loss Placement: The NNFX trading system places a significant emphasis on risk management and requires traders to place a stop loss order on every trade. The system uses a combination of technical analysis and market structure to determine the appropriate stop loss level.
6. Trade Management: The NNFX trading system has specific rules for managing open trades. The system aims to minimize risk and maximize profit by using a combination of trailing stops, take profit levels, and position sizing.
Overall, the NNFX trading system is designed to be a straightforward and easy-to-follow approach to Forex trading that can be applied by traders of all skill levels.
Core components of an NNFX algorithmic trading strategy
The NNFX algorithm is built on the principles of trend, momentum, and volatility. There are six core components in the NNFX trading algorithm:
1. Volatility - price volatility; e.g., Average True Range, True Range Double, Close-to-Close, etc.
2. Baseline - a moving average to identify price trend
3. Confirmation 1 - a technical indicator used to identify trends
4. Confirmation 2 - a technical indicator used to identify trends
5. Continuation - a technical indicator used to identify trends
6. Volatility/Volume - a technical indicator used to identify volatility/volume breakouts/breakdown
7. Exit - a technical indicator used to determine when a trend is exhausted
What is Volatility in the NNFX trading system?
In the NNFX (No Nonsense Forex) trading system, ATR (Average True Range) is typically used to measure the volatility of an asset. It is used as a part of the system to help determine the appropriate stop loss and take profit levels for a trade. ATR is calculated by taking the average of the true range values over a specified period.
True range is calculated as the maximum of the following values:
-Current high minus the current low
-Absolute value of the current high minus the previous close
-Absolute value of the current low minus the previous close
ATR is a dynamic indicator that changes with changes in volatility. As volatility increases, the value of ATR increases, and as volatility decreases, the value of ATR decreases. By using ATR in NNFX system, traders can adjust their stop loss and take profit levels according to the volatility of the asset being traded. This helps to ensure that the trade is given enough room to move, while also minimizing potential losses.
Other types of volatility include True Range Double (TRD), Close-to-Close, and Garman-Klass
What is a Baseline indicator?
The baseline is essentially a moving average, and is used to determine the overall direction of the market.
The baseline in the NNFX system is used to filter out trades that are not in line with the long-term trend of the market. The baseline is plotted on the chart along with other indicators, such as the Moving Average (MA), the Relative Strength Index (RSI), and the Average True Range (ATR).
Trades are only taken when the price is in the same direction as the baseline. For example, if the baseline is sloping upwards, only long trades are taken, and if the baseline is sloping downwards, only short trades are taken. This approach helps to ensure that trades are in line with the overall trend of the market, and reduces the risk of entering trades that are likely to fail.
By using a baseline in the NNFX system, traders can have a clear reference point for determining the overall trend of the market, and can make more informed trading decisions. The baseline helps to filter out noise and false signals, and ensures that trades are taken in the direction of the long-term trend.
What is a Confirmation indicator?
Confirmation indicators are technical indicators that are used to confirm the signals generated by primary indicators. Primary indicators are the core indicators used in the NNFX system, such as the Average True Range (ATR), the Moving Average (MA), and the Relative Strength Index (RSI).
The purpose of the confirmation indicators is to reduce false signals and improve the accuracy of the trading system. They are designed to confirm the signals generated by the primary indicators by providing additional information about the strength and direction of the trend.
Some examples of confirmation indicators that may be used in the NNFX system include the Bollinger Bands, the MACD (Moving Average Convergence Divergence), and the MACD Oscillator. These indicators can provide information about the volatility, momentum, and trend strength of the market, and can be used to confirm the signals generated by the primary indicators.
In the NNFX system, confirmation indicators are used in combination with primary indicators and other filters to create a trading system that is robust and reliable. By using multiple indicators to confirm trading signals, the system aims to reduce the risk of false signals and improve the overall profitability of the trades.
What is a Continuation indicator?
In the NNFX (No Nonsense Forex) trading system, a continuation indicator is a technical indicator that is used to confirm a current trend and predict that the trend is likely to continue in the same direction. A continuation indicator is typically used in conjunction with other indicators in the system, such as a baseline indicator, to provide a comprehensive trading strategy.
What is a Volatility/Volume indicator?
Volume indicators, such as the On Balance Volume (OBV), the Chaikin Money Flow (CMF), or the Volume Price Trend (VPT), are used to measure the amount of buying and selling activity in a market. They are based on the trading volume of the market, and can provide information about the strength of the trend. In the NNFX system, volume indicators are used to confirm trading signals generated by the Moving Average and the Relative Strength Index. Volatility indicators include Average Direction Index, Waddah Attar, and Volatility Ratio. In the NNFX trading system, volatility is a proxy for volume and vice versa.
By using volume indicators as confirmation tools, the NNFX trading system aims to reduce the risk of false signals and improve the overall profitability of trades. These indicators can provide additional information about the market that is not captured by the primary indicators, and can help traders to make more informed trading decisions. In addition, volume indicators can be used to identify potential changes in market trends and to confirm the strength of price movements.
What is an Exit indicator?
The exit indicator is used in conjunction with other indicators in the system, such as the Moving Average (MA), the Relative Strength Index (RSI), and the Average True Range (ATR), to provide a comprehensive trading strategy.
The exit indicator in the NNFX system can be any technical indicator that is deemed effective at identifying optimal exit points. Examples of exit indicators that are commonly used include the Parabolic SAR, the Average Directional Index (ADX), and the Chandelier Exit.
The purpose of the exit indicator is to identify when a trend is likely to reverse or when the market conditions have changed, signaling the need to exit a trade. By using an exit indicator, traders can manage their risk and prevent significant losses.
In the NNFX system, the exit indicator is used in conjunction with a stop loss and a take profit order to maximize profits and minimize losses. The stop loss order is used to limit the amount of loss that can be incurred if the trade goes against the trader, while the take profit order is used to lock in profits when the trade is moving in the trader's favor.
Overall, the use of an exit indicator in the NNFX trading system is an important component of a comprehensive trading strategy. It allows traders to manage their risk effectively and improve the profitability of their trades by exiting at the right time.
How does Loxx's GKD (Giga Kaleidoscope Modularized Trading System) implement the NNFX algorithm outlined above?
Loxx's GKD v1.0 system has five types of modules (indicators/strategies). These modules are:
1. GKD-BT - Backtesting module (Volatility, Number 1 in the NNFX algorithm)
2. GKD-B - Baseline module (Baseline and Volatility/Volume, Numbers 1 and 2 in the NNFX algorithm)
3. GKD-C - Confirmation 1/2 and Continuation module (Confirmation 1/2 and Continuation, Numbers 3, 4, and 5 in the NNFX algorithm)
4. GKD-V - Volatility/Volume module (Confirmation 1/2, Number 6 in the NNFX algorithm)
5. GKD-E - Exit module (Exit, Number 7 in the NNFX algorithm)
(additional module types will added in future releases)
Each module interacts with every module by passing data between modules. Data is passed between each module as described below:
GKD-B => GKD-V => GKD-C(1) => GKD-C(2) => GKD-C(Continuation) => GKD-E => GKD-BT
That is, the Baseline indicator passes its data to Volatility/Volume. The Volatility/Volume indicator passes its values to the Confirmation 1 indicator. The Confirmation 1 indicator passes its values to the Confirmation 2 indicator. The Confirmation 2 indicator passes its values to the Continuation indicator. The Continuation indicator passes its values to the Exit indicator, and finally, the Exit indicator passes its values to the Backtest strategy.
This chaining of indicators requires that each module conform to Loxx's GKD protocol, therefore allowing for the testing of every possible combination of technical indicators that make up the six components of the NNFX algorithm.
What does the application of the GKD trading system look like?
Example trading system:
Backtest: Strategy with 1-3 take profits, trailing stop loss, multiple types of PnL volatility, and 2 backtesting styles
Baseline: Hull Moving Average
Volatility/Volume: Hurst Exponent
Confirmation 1: Trend Scalp as shown on the chart above
Confirmation 2: Williams Percent Range
Continuation: Fisher Transform
Exit: Rex Oscillator
Each GKD indicator is denoted with a module identifier of either: GKD-BT, GKD-B, GKD-C, GKD-V, or GKD-E. This allows traders to understand to which module each indicator belongs and where each indicator fits into the GKD protocol chain.
Giga Kaleidoscope Modularized Trading System Signals (based on the NNFX algorithm)
Standard Entry
1. GKD-C Confirmation 1 Signal
2. GKD-B Baseline agrees
3. Price is within a range of 0.2x Volatility and 1.0x Volatility of the Goldie Locks Mean
4. GKD-C Confirmation 2 agrees
5. GKD-V Volatility/Volume agrees
Baseline Entry
1. GKD-B Baseline signal
2. GKD-C Confirmation 1 agrees
3. Price is within a range of 0.2x Volatility and 1.0x Volatility of the Goldie Locks Mean
4. GKD-C Confirmation 2 agrees
5. GKD-V Volatility/Volume agrees
6. GKD-C Confirmation 1 signal was less than 7 candles prior
Continuation Entry
1. Standard Entry, Baseline Entry, or Pullback; entry triggered previously
2. GKD-B Baseline hasn't crossed since entry signal trigger
3. GKD-C Confirmation Continuation Indicator signals
4. GKD-C Confirmation 1 agrees
5. GKD-B Baseline agrees
6. GKD-C Confirmation 2 agrees
1-Candle Rule Standard Entry
1. GKD-C Confirmation 1 signal
2. GKD-B Baseline agrees
3. Price is within a range of 0.2x Volatility and 1.0x Volatility of the Goldie Locks Mean
Next Candle:
1. Price retraced (Long: close < close or Short: close > close )
2. GKD-B Baseline agrees
3. GKD-C Confirmation 1 agrees
4. GKD-C Confirmation 2 agrees
5. GKD-V Volatility/Volume agrees
1-Candle Rule Baseline Entry
1. GKD-B Baseline signal
2. GKD-C Confirmation 1 agrees
3. Price is within a range of 0.2x Volatility and 1.0x Volatility of the Goldie Locks Mean
4. GKD-C Confirmation 1 signal was less than 7 candles prior
Next Candle:
1. Price retraced (Long: close < close or Short: close > close )
2. GKD-B Baseline agrees
3. GKD-C Confirmation 1 agrees
4. GKD-C Confirmation 2 agrees
5. GKD-V Volatility/Volume Agrees
PullBack Entry
1. GKD-B Baseline signal
2. GKD-C Confirmation 1 agrees
3. Price is beyond 1.0x Volatility of Baseline
Next Candle:
1. Price is within a range of 0.2x Volatility and 1.0x Volatility of the Goldie Locks Mean
3. GKD-C Confirmation 1 agrees
4. GKD-C Confirmation 2 agrees
5. GKD-V Volatility/Volume Agrees
█ GKD-C Trend Scalp
What is T3?
The T3 Moving Average (T3MA) is a technical analysis indicator that was developed by Tim Tillson. It is a trend-following indicator that aims to provide a smoother and more accurate representation of price trends than other moving average indicators.
The T3MA is a type of exponential moving average ( EMA ) that is calculated using a series of complex formulas. Unlike a simple or exponential moving average , which use fixed smoothing factors, the T3MA uses a variable smoothing factor that is based on the volatility of the underlying asset. This means that the T3MA is able to adapt to changing market conditions and provide more accurate signals.
The formula for calculating the T3MA is as follows:
T3 = a * EMA1 + (1 - a) * T3
Where:
-T3 is the current value of the T3MA
-EMA1 is the current value of the first EMA
-T3 is the previous value of the T3MA
-a is the smoothing factor, which is based on the volatility of the underlying asset and is calculated using the following formulas:
-c1 = -1 + exp (-sqrt(2) * pi / period)
-c2 = 2 * c1 * c1 + 2 * c1
-c3 = 1 - c1 - c2
-a = c1 * sqrt(period) * (close - T3) + c2 * T3 + c3 * EMA1
In simple terms, the T3MA is calculated by taking a weighted average of two different EMAs, with the weight given to each EMA depending on the volatility of the asset being analyzed. The T3MA is then smoothed using a second smoothing factor, which further reduces noise and improves the accuracy of the indicator.
The T3MA can be used in a variety of ways by traders and analysts. Some common applications include using the T3MA as a trend-following indicator, with buy signals generated when the price of an asset crosses above the T3MA and sell signals generated when the price crosses below. The T3MA can also be used in combination with other indicators and analytical techniques to confirm trading decisions and identify potential trend reversals.
Overall, the T3 Moving Average is a highly sophisticated and complex technical indicator that is designed to provide a more accurate and reliable representation of price trends. While it may be difficult for novice traders to understand and use effectively, experienced traders and analysts may find the T3MA to be a valuable tool in their trading toolbox.
What is Trend Scalp?
Trend Scalp calculates the difference between bull and bear power and then smooths this calculation using the T3 filter. This indicator is good for lower timeframe scalping. For use in regular trading, decrease the levels value, for scalps, keep the levels value high.
Requirements
Inputs
Confirmation 1 and Solo Confirmation: GKD-V Volatility / Volume indicator
Confirmation 2: GKD-C Confirmation indicator
Outputs
Confirmation 2 and Solo Confirmation Complex: GKD-E Exit indicator
Confirmation 1: GKD-C Confirmation indicator
Continuation: GKD-E Exit indicator
Solo Confirmation Simple: GKD-BT Backtest strategy
Additional features will be added in future releases.