Order Flow RSI - Price / CVD / OIOrder Flow RSI blends three powerful market perspectives — Price , Cumulative Volume Delta (CVD) , and Open Interest (OI) — into one unified RSI-style oscillator.
It reveals momentum and imbalance across these data streams and highlights situations where participation, liquidity, and positioning disagree — moments that often precede reversals.
What it does
The indicator converts:
Price → RSI (classic momentum),
CVD → RSI (buy/sell pressure balance),
OI → RSI (position expansion/contraction)
…then plots all three RSIs together on the same 0–100 scale.
A fourth Consensus RSI (average of any two or all three) can optionally be shown to simplify the view.
Core logic
CVD engine – based on TradingView’s native volume-delta request.
Modes: Continuous (default, smooth line), Anchored (resets each session), Rolling window.
Open Interest – pulled automatically from the symbol’s “_OI” feed; aligns to chart timeframe for real-time flow.
RSI calculation – standard RSI applied to each data stream, optionally smoothed (SMA / EMA / RMA / WMA / VWMA).
Signals – optional background highlights when:
All three RSIs are overbought (red) or oversold (green), or
Any pair show opposite extremes (e.g., price overbought + OI oversold).
Consensus RSI – arithmetic mean of the selected RSIs, summarizing overall market tone.
Inputs overview
CVD settings: anchor period, lower-TF delta, mode, rolling length
RSI lengths: separate for price, CVD, OI
Smoothing: type + period applied to all RSIs at once
Consensus: choose which RSIs to average
Signals: enable/disable each combination; optional alerts
Levels: adjustable OB/MID/OS (default 70 / 50 / 30)
Visuals: fill between active RSIs, background highlights, level lines, colors in Style tab
How to read it
All 3 overbought (red): broad exhaustion → possible correction
All 3 oversold (green): broad depletion → possible bounce
Opposite pairs: divergence between price and participation
Price↑ but OI↓ (red) → weak rally, fading participation
Price↓ but CVD↑ (green) → hidden accumulation
Combine with structure and volume profile for confirmation.
Notes
Works best on assets with full CVD + OI data (futures, BTC, etc.).
Use Continuous CVD for smooth RSI, Anchored for session analysis.
Smoothing 2–5 EMA is a good starting point to reduce noise.
All styling (colors, line types, thickness) is adjustable in the Style tab.
Limitations & caveats
CVD requires accurate tick/volume/delta data from your data feed. Performance may differ across instruments.
OI availability varies by exchange / symbol. Where OI is absent, pairwise OI signals are not evaluated.
This indicator is a tool — it generates signals of interest, not guaranteed profitable trades. Backtest and combine with your risk rules.
Smoothing introduces lag; longer smoothing reduces noise but delays signals.
Order Flow RSI bridges traditional momentum analysis and order-flow context — giving a multi-dimensional view of when markets are truly stretched or quietly reloading.
Sometimes it works, sometimes it doesn't.
Volume

Volume Profile Two-Tone - Hit Counter - Meter V1 Volume Profile Two-Tone - Hit Counter - Meter V1
Overview
The Volume Profile Two-Tone - Hit Counter - Meter V1 is a Pine Script v6 indicator for TradingView, designed to visualize buy and sell activity distribution across price levels within a user-defined window or intraday session. It plots a dual-color horizontal histogram showing buying (green) and selling (red) volume intensity, along with optional hit-count numbers and meter overlays. The profile dynamically updates as new bars form, providing an intuitive picture of where market participants are most active.
The enhanced V1 edition introduces persistent hit counts, real-time adaptive row rebuilding, and improved memory management for smoother performance in both rolling-window and session modes.
How It Works
The indicator divides the selected range into rows (price bins) and aggregates trade volume (or tick volume) per bar.
Each bin separately sums up bullish and bearish contributions based on candle direction and delta logic, then draws side-by-side histogram bars:
• Buy Volume (green): Total volume from bullish bars within the bin.
• Sell Volume (red): Total volume from bearish bars within the bin.
A rolling or session-based window determines how many recent bars are analyzed. Value Area (VA), Point of Control (POC), and total hits per bin are computed continuously. The display auto-adjusts as price moves, keeping the profile anchored to the latest visible bars.
Behind the scenes, optimized arrays manage active boxes, lines, and labels for each bin. Functions like ensure_rows() rebuild buffers only when necessary, guaranteeing efficiency without repainting past data. Persistent hit-tracking ensures each price level maintains its count even when temporarily hidden.
Key Features
• Dual-Tone Volume Histogram: Buy/sell split with distinct colors for immediate visual contrast.
• Rolling or Session Profiles: Choose between continuous rolling windows or intraday session resets.
• Persistent Hit Counts: Displays total touches per bin, remaining stored even when bins refresh.
• Adaptive Row Management: Automatic rebuilding when zooming, scrolling, or changing resolution.
• Value Area + POC Detection: Highlights the most active price levels and volume concentration zones.
• Meter Overlay Option: Adds gradient bars or directional meters for quick trend context.
• Performance Optimized: Uses lightweight arrays and cached line handles for minimal CPU load.
• Custom Color Control: Editable buy/sell colors, opacity, row count, and profile width.
• Full Persistence Mode: Profiles remain visually consistent across bar updates without redraw gaps.
What It Displays
The Volume Profile Two-Tone - Hit Counter - Meter V1 presents an adaptive horizontal histogram beside the chart’s candles, revealing how volume is distributed across price.
• Green segments show dominant buying interest; red segments reveal selling pressure.
• POC line identifies the highest-volume price.
• Hit-count numbers quantify how often price traded at each level.
• Optional meters display relative directional strength within the same range.
This visual layering helps traders quickly identify supply/demand zones, balance areas, and developing auction profiles across intraday or multi-session contexts.
Originality
The Pine Script v6 indicator uses efficient array management (array.new_*, array.set, array.get) and native math operations for rendering.
It avoids external dependencies, relying only on built-in TradingView functions like request.security, box.new, line.new, and label.new for dynamic plotting.
Common Ways People Use It
• Scalpers: Study short-term imbalances or high-activity levels to time entries/exits.
• Day Traders: Track evolving session volume and POC migration.
• Swing Analysts: Compare rolling distributions to identify value shifts over multiple days.
• Volume Profilers: Combine with VWAP or order-flow tools for deeper context.
Configuration Notes
Profile Mode: Select Rolling Window (bars) or Session (intraday).
Rows and Width: Default = 72 rows, 44 bars width.
Colors and Opacity: Adjust to match chart theme.
Performance Mode: Choose Accurate or Fast (approximate) for speed control.
Show Hits / Meter: Enable hit-count numbers and gradient meters for added context.
Legal Disclaimer
For informational and educational purposes only—not investment, financial, or trading advice. Past performance does not guarantee future results; trading involves significant risk. Provided “as is,” without warranties. Consult a qualified professional before making decisions. By using, you accept all risks and agree to this disclaimer.

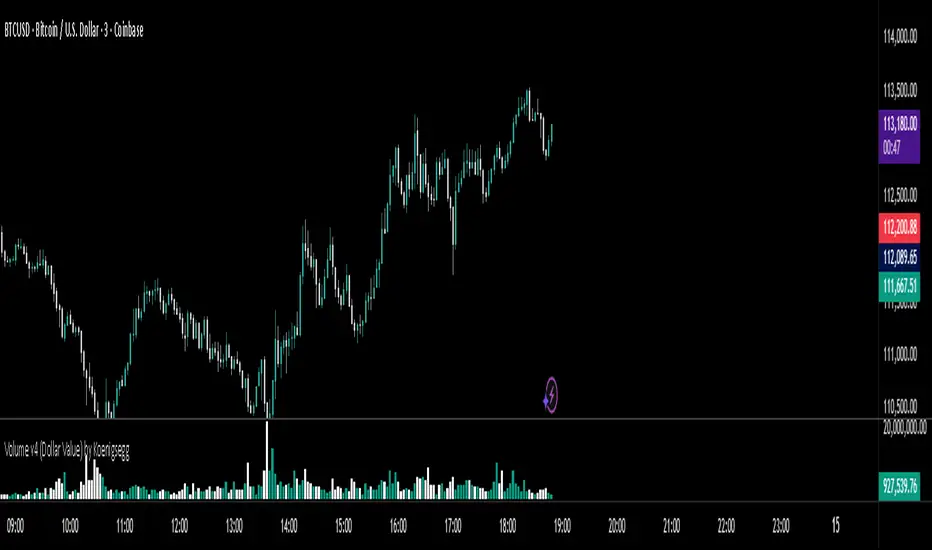
Volume v4 (Dollar Value) by Koenigsegg📊 Volume v3 (Dollar Value) by Koenigsegg
🎯 Purpose:
Volume v3 (Dollar Value) by Koenigsegg transforms traditional raw-unit volume into dollar-denominated volume, revealing how much money actually flows through each candle.
Instead of measuring how many coins or contracts were traded, this version calculates the total traded value = volume × average price (hlc3), allowing traders to visually assess capital intensity and market participation within each move.
⚙️ Core Features
- Converts raw volume into USD-based traded value for each candle.
- Color-coded bars show bullish (green/teal) vs. bearish (red) activity.
- Built-in SMA and SMMA overlays highlight sustained shifts in value flow.
- Designed for visual clarity to support momentum, exhaustion, and divergence studies.
📖 How to Read It
Rising Dollar Volume — indicates growing market participation and strong capital flow, often aligning with impulsive waves in trend direction.
Falling Dollar Volume — signals waning interest or reduced participation, potentially hinting at correction or exhaustion phases.
Comparing Legs — when price makes new highs/lows but dollar volume weakens, it can reveal divergences between price movement and actual capital commitment.
SMA / SMMA Lines — use them to identify longer-term accumulation or depletion of market activity, separating short bursts from sustained inflows or outflows.
The goal is to visualize the strength of market moves in terms of capital energy, not just tick activity. This distinction helps traders interpret whether a trend is being driven by genuine money flow or low-liquidity drift.
⚠️ Disclaimer
This script is provided for research and educational purposes only.
It does not constitute financial advice, investment recommendations, or trading signals.
Always conduct your own analysis and manage your own risk when trading live markets.
The author accepts no liability for financial losses incurred from use of this tool.
🧠 Credits
Developed and published by Koenigsegg.
Written in Pine Script® v6, fully compliant with TradingView’s House Rules for Pine Scripts.
Licensed under the Mozilla Public License 2.0.
ICT Turtle SoupICT Turtle Soup identifies classic “failed breakout” reversals after liquidity sweeps of recent highs/lows, then augments the setup with volume validation, market structure context, Kill Zone (session) filters, Order Blocks (OB), Fair Value Gaps (FVG), OTE (61.8–78.6%) zones, and optional risk targets (SL/TP 1:1, 1:2, 1:3). A compact dashboard summarizes current context (recent high/low, lookbacks, active session, structure state, mitigation counts).
What the Script Does
⦁ Detects Turtle Soup events: Price breaks a prior swing extreme and then quickly reverses back inside the range.
⦁ Grades signal quality: Factors include reversal speed, volume confirmation, breakout magnitude, and consecutive patterns.
⦁ Overlays market context: Trend/range classification (ADX / MA / ATR Bands / Combined), Kill Zones (Asian/London/NY), and time-of-day filters.
⦁ Marks IMB / mitigation zones: Draws Order Blocks and Fair Value Gaps, with optional live mitigation tracking and fading/removal on mitigation.
⦁ Shows OTE zones (61.8–78.6%) after confirmed reversals to highlight potential pullback entries.
⦁ Plots risk management guides: Optional SL buffer below/above reversal wick and TP bands at 1:1, 1:2, 1:3 R multiples.
⦁ Emits alerts on bullish/bearish Turtle Soup confirmations.
How It Works (Conceptual)
1. Liquidity Sweep & Breakout Check
⦁ Looks back over user-defined windows (single or multiple lookbacks: short/medium/long) to find the most recent swing high/low.
⦁ Flags a breakout when price pierces that swing (above for bearish, below for bullish).
⦁ Optional breakout bar volume check requires volume > avg(volume, N) × multiplier.
⦁ Optional swing age check requires the broken swing to be at least X bars old.
2. Reversal Confirmation
⦁ Within N bars after the sweep, validates a mean-reversion close back inside the prior range with a minimum wick/body ratio to confirm rejection.
⦁ Quality Score adds points for:
⦁ Speed: reversal within fast_reversal_bars;
⦁ Volume: breakout and/or reversal volume spike;
⦁ Series: previous consecutive signals;
⦁ Magnitude: sufficient sweep distance.
⦁ Optional high-quality filter only shows signals meeting a minimum score.
3. Context Filters (Optional)
⦁ Sessions/Kill Zones: Only allow signals in selected sessions (Asian/London/NY) with fully custom HHMM inputs.
⦁ Time Window: Restrict to specific hours (e.g., 08–12).
⦁ Market Structure: Classify Trending vs. Ranging (via ADX, MA separation/slope, ATR bands, or Combined). You can allow signals in trends, ranges, or both.
4. Smart Confluence Layers
⦁ Order Blocks: Finds likely OBs with structural validation (e.g., bearish up-candle prior to down move), imbalance score (body/range × volume factor), and extend-until-touched with mitigation % tracking.
⦁ Fair Value Gaps: Detects valid 3-bar gaps (bull/bear) with size threshold, supports touch / 50% / full mitigation logic, and can fade or remove after mitigation.
⦁ OTE Zones: After a reversal, projects the 61.8–78.6% retracement box from the actual swing range; offset scales to timeframe to avoid clutter.
5. Risk & Display
⦁ SL/TP guides: Optional wick-buffered SL and 1:1/1:2/1:3 TPs.
⦁ Dashboard: Recent high/low, active lookbacks, current session, structure label, and live counts of mitigated OBs/FVGs.
Signals & Visuals
⦁ Bullish Turtle Soup: Triangle up + label (🐢S/M/L/D + star rating).
⦁ Bearish Turtle Soup: Triangle down + label (🐢S/M/L/D + star rating).
⦁ Labels can show: quality stars, FAST/SLOW reversal, reversal & breakout volume tags, previous consecutive count, and last move %.
⦁ Lines/Boxes: OBs, FVGs, OTE zones, SL/TP bands, and optional breakout magnitude line.
Inputs (Key Groups)
⦁ Turtle Soup: Lookbacks (single or S/M/L), reversal bars, wick ratio, magnitude line, reversal speed, volume confirmation (multiplier/length), consecutive tracking.
⦁ Order Blocks: Show/validate structure, lookback, extend-until-touched, mitigation % threshold, colors.
⦁ Fair Value Gaps: Show, min size %, colors, mitigation mode (Touch/50%/Full), optional remove-on-mitigation.
⦁ Kill Zones/Sessions: Enable Asian/London/NY with custom HHMM, colors.
⦁ OTE: Show OTE (61.8–78.6%), color, timeframe-adaptive offsets.
⦁ Signal Filters: Filter by session, time window, market structure method (ADX/MA/ATR/Combined), thresholds (ADX, MA periods, ATR multiplier), trending/ranging allowances, structure label & offset.
⦁ SL/TP: SL buffer %, TP 1:1/1:2/1:3 toggles & colors.
⦁ Breakout Validation: Require breakout-bar volume, min swing age, volume label toggles.
⦁ Alerts: Enable/disable.
⦁ Dashboard: Position, text size, colors, border.
How to Use
1. Markets & Timeframes: Works on FX, crypto, indices, and futures. Start with M5–H1 for intraday and H1–H4 for swing; refine lookbacks per instrument volatility.
2. Core Flow:
⦁ Enable multiple lookbacks for robustness on mixed volatility.
⦁ Turn on validate_swing_significance to avoid micro sweeps.
⦁ Use validate_breakout_volume + use_volume_confirmation to filter weak pokes.
3. Context Choice:
⦁ In ranging environments, allow both sides; in trends, consider counter-trend only at HTF OB/FVG/OTE confluence.
⦁ Narrow to London/NY for higher activity if desired.
4. Entries/Stops/Targets:
⦁ Entry on confirmed label close or at OTE pullback post-signal.
⦁ SL: below/above reversal wick + sl_buffer%.
⦁ TP: scale at 1:1/1:2/1:3 or manage via OB/FVG/structure breaks.
5. Confluence: Prefer Turtle Soup that aligns with OB/FVG zones and Combined structure method for added reliability.
Alerts
⦁ “Bullish Turtle Soup detected” and “Bearish Turtle Soup detected” fire on confirmation.
⦁ Set to Once Per Bar (as coded) or adjust in the alert dialog per your workflow.
Notes & Tips
⦁ Multiple lookbacks (S/M/L) help capture both shallow and deep liquidity sweeps.
⦁ Use market structure label with offset to keep it readable on the right of price.
⦁ Mitigation tracking visually communicates when OB/FVG confluence is no longer valid.
⦁ Dashboard = fast situational awareness; keep it on during live trading.
Limitations & Disclaimer
⦁ This tool is educational and not financial advice. No profitability or win-rate is implied. Markets carry risk; manage position size and test thoroughly.
⦁ Signal quality depends on market regime, spreads, news, and data quality. Backtests/forward-tests may differ.
⦁ Visual objects are capped for performance; old items may auto-clean to keep charts responsive.

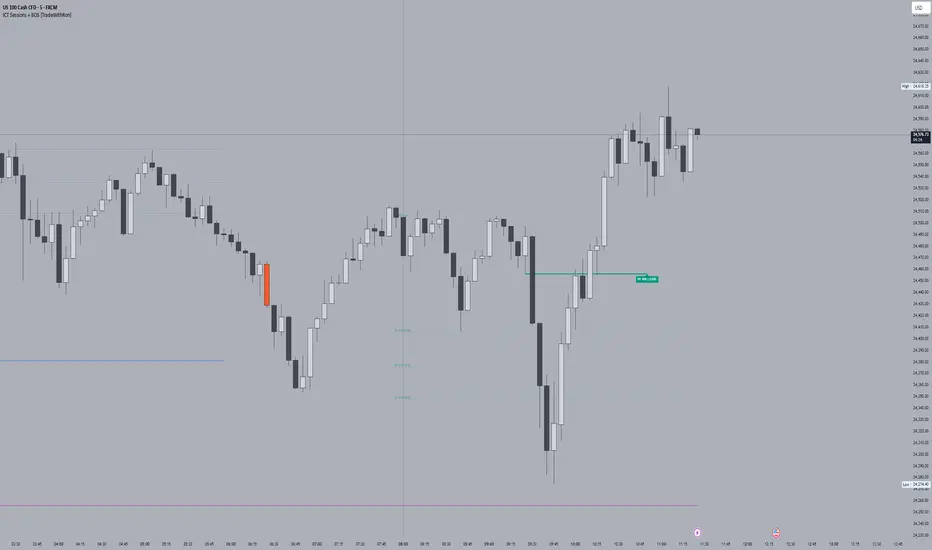
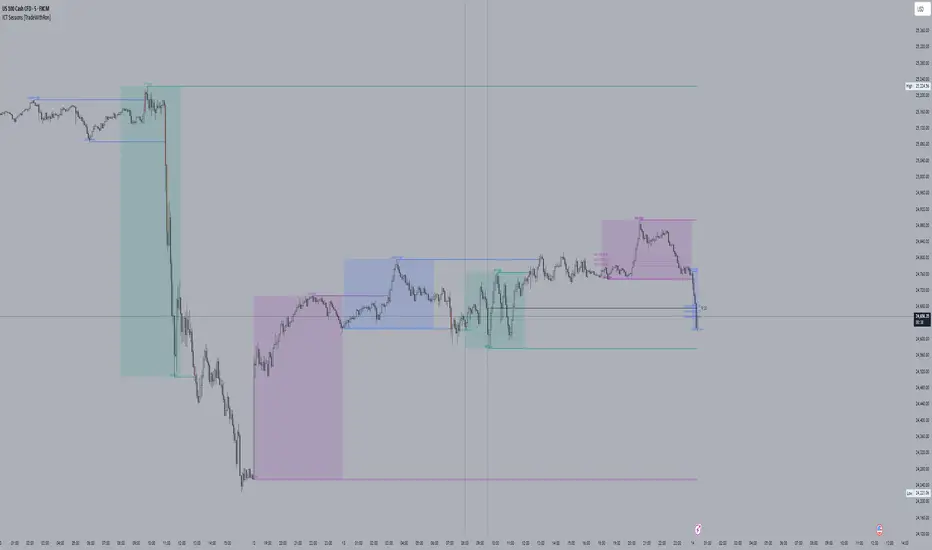
ICT Sessions With BOS [TradeWithRon]
WITH BOS
This version includes BOS with filter for each session.
NONE,FVG,CISD Filter preset
you can choose how many BOS per session, style etc.
ICT Sessions and killzones maps three intraday sessions on your chart (Asia, London, NY), tracks each session’s live high/low, draws optional session range boxes, and projects ICT OTE zones in real time—with granular styling, touch/mitigation logic, and alerting.
What it does
*Live Session high/low tracking.
Historical session lines:
When a session ends, its final High/Low are preserved as tracked lines (with optional labels) for a configurable number of recent sessions.
Session boxes (ranges):
Draws a shaded box from session start to end that expands with new highs/lows. Limit how many recent boxes remain on chart.
ICT OTE zones (live):
For the currently active session, projects user-defined Fibonacci OTE levels (e.g., 61.8%, 70.5%, 78.6) between the session’s running high and low. Zones update tick-by-tick and can show labels. You can retain a history of recent sessions’ OTE levels.
snapshot
Break visualization (mitigation):
Optionally color the bar when price breaks a stored session High/Low. You can:
Require a body close through the level (vs. any touch)
Auto-remove the line and/or label on touch/close
Use custom break colors per session and side (high/low)
Timestamps:
Add up to two recurring vertical timestamp markers (e.g., 08:00, 09:30), plus an opening horizontal marker (e.g., 09:30) with label that extends until the next occurrence.
Alerts:
Built-in alerts for:
Touch of Session 1/2/3 High/Low (Asia/London/NY)
Touch of OTE levels (per session)
Key inputs:
Time & Limits
Timezone (e.g., GMT-4)
Timeframe limit: hide all drawings on and above a specified TF
Sessions
Session windows (default):
Session 1 (Asia): 18:00–00:00
Session 2 (London): 00:00–06:00
Session 3 (NY): 08:00–12:00
How many to keep (lines/boxes)
Line width, colors, and label suffixes (“High”/“Low”)
Labels: toggle, text (“Asia”, “London”, “NY”), size, and colors
Boxes: toggle per session and background colors
ICT OTE Zones
Toggle per session (Asia/London/NY)
Levels (comma-separated %s, e.g., 61.8,70.5,78.6)
History: number of past sessions to retain
Opacity, line width/style, and label size
Custom label text per session (e.g., “Asia OTE”)
Break/Mitigation Behavior:
Enable Mitigated Candles (bar color on break)
Remove line on touch and/or remove label on touch
Require body close (vs. wick touch)
Custom break colors by session and side
Timestamps
Opening horizontal line (time, style, width, color, label text/size, drawing limit)
Two vertical timestamps (times, style, width, color, drawing limit)
Alerts
Master Enable Alerts
Per-session toggles for High/Low touches
OTE touch alerts
How it works (under the hood)
Detects session state via input.session() windows in the chosen timezone.
Live session High/Low lines and labels update in real time; on session end, final levels are stored with optional labels and tracked length.
OTE zones are live-computed from current session High↔Low and refreshed every bar; a compact rolling history is enforced.
Bar coloring reacts to break events (touch or body-close, per your setting) and uses session-specific colors when enabled.
Timestamp lines/labels are created on each occurrence and trimmed to a drawing limit for performance.
Tips:
To hide session lines but keep boxes, set line color opacity to 0.
Use Timeframe Limit to keep higher-TF charts clean.
Fine-tune OTE Levels and History to balance clarity and performance.
For stricter break logic, enable Require Body Close.
Note: The script reserves high limits for lines/labels/boxes to keep recent context visible while managing cleanup automatically. Adjust “Session Number” and “Number Of Boxes” to suit your workflow.
— © TradeWithRon
Advanced Speedometer Gauge [PhenLabs]Advanced Speedometer Gauge
Version: PineScript™v6
📌 Description
The Advanced Speedometer Gauge is a revolutionary multi-metric visualization tool that consolidates 13 distinct trading indicators into a single, intuitive speedometer display. Instead of cluttering your workspace with multiple oscillators and panels, this gauge provides a unified interface where you can switch between different metrics while maintaining consistent visual interpretation.
Built on PineScript™ v6, the indicator transforms complex technical calculations into an easy-to-read semi-circular gauge with color-coded zones and a precision needle indicator. Each of the 13 available metrics has been carefully normalized to a 0-100 scale, ensuring that whether you’re analyzing RSI, volume trends, or volatility extremes, the visual interpretation remains consistent and intuitive.
The gauge is designed for traders who value efficiency and clarity. By consolidating multiple analytical perspectives into one compact display, you can quickly assess market conditions without the visual noise of traditional multi-indicator setups. All metrics are non-overlapping, meaning each provides unique insights into different aspects of market behavior.
🚀 Points of Innovation
13 selectable metrics covering momentum, volume, volatility, trend, and statistical analysis, all accessible through a single dropdown menu
Universal 0-100 normalization system that standardizes different indicator scales for consistent visual interpretation across all metrics
Semi-circular gauge design with 21 arc segments providing smooth precision and clear visual feedback through color-coded zones
Non-redundant metric selection ensuring each indicator provides unique market insights without analytical overlap
Advanced metrics including MFI (volume-weighted momentum), CCI (statistical deviation), Volatility Rank (extended lookback), Trend Strength (ADX-style), Choppiness Index, Volume Trend, and Price Distance from MA
Flexible positioning system with 5 chart locations, 3 size options, and fully customizable color schemes for optimal workspace integration
🔧 Core Components
Metric Selection Engine: Dropdown interface allowing instant switching between 13 different technical indicators, each with independent parameter controls
Normalization System: All metrics converted to 0-100 scale using indicator-specific algorithms that preserve the statistical significance of each measurement
Semi-Circular Gauge: Visual display using 21 arc segments arranged in curved formation with two-row thickness for enhanced visibility
Color Zone System: Three distinct zones (0-40 green, 40-70 yellow, 70-100 red) providing instant visual feedback on metric extremes
Needle Indicator: Dynamic pointer that positions across the gauge arc based on precise current metric value
Table Implementation: Professional table structure ensuring consistent positioning and rendering across different chart configurations
🔥 Key Features
RSI (Relative Strength Index): Classic momentum oscillator measuring overbought/oversold conditions with adjustable period length (default 14)
Stochastic Oscillator: Compares closing price to price range over specified period with smoothing, ideal for identifying momentum shifts
MFI (Money Flow Index): Volume-weighted RSI that combines price movement with volume to measure buying and selling pressure intensity
CCI (Commodity Channel Index): Measures statistical deviation from average price, normalized from typical -200 to +200 range to 0-100 scale
Williams %R: Alternative overbought/oversold indicator using high-low range analysis, inverted to match 0-100 scale conventions
Volume %: Current volume relative to moving average expressed as percentage, capped at 100 for extreme spikes
Volume Trend: Cumulative directional volume flow showing whether volume is flowing into up moves or down moves over specified period
ATR Percentile: Current Average True Range position within historical range using specified lookback period (default 100 bars)
Volatility Rank: Close-to-close volatility measured against extended historical range (default 252 days), differs from ATR in calculation method
Momentum: Rate of change calculation showing price movement speed, centered at 50 and normalized to 0-100 range
Trend Strength: ADX-style calculation using directional movement to quantify trend intensity regardless of direction
Choppiness Index: Measures market choppiness versus trending behavior, where high values indicate ranging markets and low values indicate strong trends
Price Distance from MA: Measures current price over-extension from moving average using standard deviation calculations
🎨 Visualization
Semi-Circular Arc Display: Curved gauge spanning from 0 (left) to 100 (right) with smooth progression and two-row thickness for visibility
Color-Coded Zones: Green zone (0-40) for low/oversold conditions, yellow zone (40-70) for neutral readings, red zone (70-100) for high/overbought conditions
Needle Indicator: Downward-pointing triangle (▼) positioned precisely at current metric value along the gauge arc
Scale Markers: Vertical line markers at 0, 25, 50, 75, and 100 positions with corresponding numerical labels below
Title Display: Merged cell showing “𓄀 PhenLabs” branding plus currently selected metric name in monospace font
Large Value Display: Current metric value shown with two decimal precision in large text directly below title
Table Structure: Professional table with customizable background color, text color, and transparency for minimal chart obstruction
📖 Usage Guidelines
Metric Selection
Select Metric: Default: RSI | Options: RSI, Stochastic, Volume %, ATR Percentile, Momentum, MFI (Money Flow), CCI (Commodity Channel), Williams %R, Volatility Rank, Trend Strength, Choppiness Index, Volume Trend, Price Distance | Choose the technical indicator you want to display on the gauge based on your current analytical needs
RSI Settings
RSI Length: Default: 14 | Range: 1+ | Controls the lookback period for RSI calculation, shorter periods increase sensitivity to recent price changes
Stochastic Settings
Stochastic Length: Default: 14 | Range: 1+ | Lookback period for stochastic calculation comparing close to high-low range
Stochastic Smooth: Default: 3 | Range: 1+ | Smoothing period applied to raw stochastic value to reduce noise and false signals
Volume Settings
Volume MA Length: Default: 20 | Range: 1+ | Moving average period used to calculate average volume for comparison with current volume
Volume Trend Length: Default: 20 | Range: 5+ | Period for calculating cumulative directional volume flow trend
ATR and Volatility Settings
ATR Length: Default: 14 | Range: 1+ | Period for Average True Range calculation used in ATR Percentile metric
ATR Percentile Lookback: Default: 100 | Range: 20+ | Historical range used to determine current ATR position as percentile
Volatility Rank Lookback (Days): Default: 252 | Range: 50+ | Extended lookback period for Volatility Rank metric using close-to-close volatility
Momentum and Trend Settings
Momentum Length: Default: 10 | Range: 1+ | Lookback period for rate of change calculation in Momentum metric
Trend Strength Length: Default: 20 | Range: 5+ | Period for directional movement calculations in ADX-style Trend Strength metric
Advanced Metric Settings
MFI Length: Default: 14 | Range: 1+ | Lookback period for Money Flow Index calculation combining price and volume
CCI Length: Default: 20 | Range: 1+ | Period for Commodity Channel Index statistical deviation calculation
Williams %R Length: Default: 14 | Range: 1+ | Lookback period for Williams %R high-low range analysis
Choppiness Index Length: Default: 14 | Range: 5+ | Period for calculating market choppiness versus trending behavior
Price Distance MA Length: Default: 50 | Range: 10+ | Moving average period used for Price Distance standard deviation calculation
Visual Customization
Position: Default: Top Right | Options: Top Left, Top Right, Bottom Left, Bottom Right, Middle Right | Controls gauge placement on chart for optimal workspace organization
Size: Default: Normal | Options: Small, Normal, Large | Adjusts overall gauge dimensions and text size for different monitor resolutions and preferences
Low Zone Color (0-40): Default: Green (#00FF00) | Customize color for low/oversold zone of gauge arc
Medium Zone Color (40-70): Default: Yellow (#FFFF00) | Customize color for neutral/medium zone of gauge arc
High Zone Color (70-100): Default: Red (#FF0000) | Customize color for high/overbought zone of gauge arc
Background Color: Default: Semi-transparent dark gray | Customize gauge background for contrast and chart integration
Text Color: Default: White (#FFFFFF) | Customize all text elements including title, value, and scale labels
✅ Best Use Cases
Quick visual assessment of market conditions when you need instant feedback on whether an asset is in extreme territory across multiple analytical dimensions
Workspace organization for traders who monitor multiple indicators but want to reduce chart clutter and visual complexity
Metric comparison by switching between different indicators while maintaining consistent visual interpretation through the 0-100 normalization
Overbought/oversold identification using RSI, Stochastic, Williams %R, or MFI depending on whether you prefer price-only or volume-weighted analysis
Volume analysis through Volume %, Volume Trend, or MFI to confirm price movements with corresponding volume characteristics
Volatility monitoring using ATR Percentile or Volatility Rank to identify expansion/contraction cycles and adjust position sizing
Trend vs range identification by comparing Trend Strength (high values = trending) against Choppiness Index (high values = ranging)
Statistical over-extension detection using CCI or Price Distance to identify when price has deviated significantly from normal behavior
Multi-timeframe analysis by duplicating the gauge on different timeframe charts to compare metric readings across time horizons
Educational purposes for new traders learning to interpret technical indicators through consistent visual representation
⚠️ Limitations
The gauge displays only one metric at a time, requiring manual switching to compare different indicators rather than simultaneous multi-metric viewing
The 0-100 normalization, while providing consistency, may obscure the raw values and specific nuances of each underlying indicator
Table-based visualization cannot be exported or saved as an image separately from the full chart screenshot
Optimal parameter settings vary by asset type, timeframe, and market conditions, requiring user experimentation for best results
💡 What Makes This Unique
Unified Multi-Metric Interface: The only gauge-style indicator offering 13 distinct metrics through a single interface, eliminating the need for multiple oscillator panels
Non-Overlapping Analytics: Each metric provides genuinely unique insights—MFI combines volume with price, CCI measures statistical deviation, Volatility Rank uses extended lookback, Trend Strength quantifies directional movement, and Choppiness Index measures ranging behavior
Universal Normalization System: All metrics standardized to 0-100 scale using indicator-appropriate algorithms that preserve statistical meaning while enabling consistent visual interpretation
Professional Visual Design: Semi-circular gauge with 21 arc segments, precision needle positioning, color-coded zones, and clean table implementation that maintains clarity across all chart configurations
Extensive Customization: Independent parameter controls for each metric, five position options, three size presets, and full color customization for seamless workspace integration
🔬 How It Works
1. Metric Calculation Phase:
All 13 metrics are calculated simultaneously on every bar using their respective algorithms with user-defined parameters
Each metric applies its own specific calculation method—RSI uses average gains vs losses, Stochastic compares close to high-low range, MFI incorporates typical price and volume, CCI measures deviation from statistical mean, ATR calculates true range, directional indicators measure up/down movement, and statistical metrics analyze price relationships
2. Normalization Process:
Each calculated metric is converted to a standardized 0-100 scale using indicator-appropriate transformations
Some metrics are naturally 0-100 (RSI, Stochastic, MFI, Williams %R), while others require scaling—CCI transforms from ±200 range, Momentum centers around 50, Volume ratio caps at 2x for 100, ATR and Volatility Rank calculate percentile positions, and Price Distance scales by standard deviations
3. Gauge Rendering:
The selected metric’s normalized value determines the needle position across 21 arc segments spanning 0-100
Each arc segment receives its color based on position—segments 0-8 are green zone, segments 9-14 are yellow zone, segments 15-20 are red zone
The needle indicator (▼) appears in row 5 at the column corresponding to the current metric value, providing precise visual feedback
4. Table Construction:
The gauge uses TradingView’s table system with merged cells for title and value display, ensuring consistent positioning regardless of chart configuration
Rows are allocated as follows: Row 0 merged for title, Row 1 merged for large value display, Row 2 for spacing, Rows 3-4 for the semi-circular arc with curved shaping, Row 5 for needle indicator, Row 6 for scale markers, Row 7 for numerical labels at 0/25/50/75/100
All visual elements update on every bar when barstate.islast is true, ensuring real-time accuracy without performance impact
💡 Note:
This indicator is designed for visual analysis and market condition assessment, not as a standalone trading system. For best results, combine gauge readings with price action analysis, support and resistance levels, and broader market context. Parameter optimization is recommended based on your specific trading timeframe and asset class. The gauge works on all timeframes but may require different parameter settings for intraday versus daily/weekly analysis. Consider using multiple instances of the gauge set to different metrics for comprehensive market analysis without switching between settings.

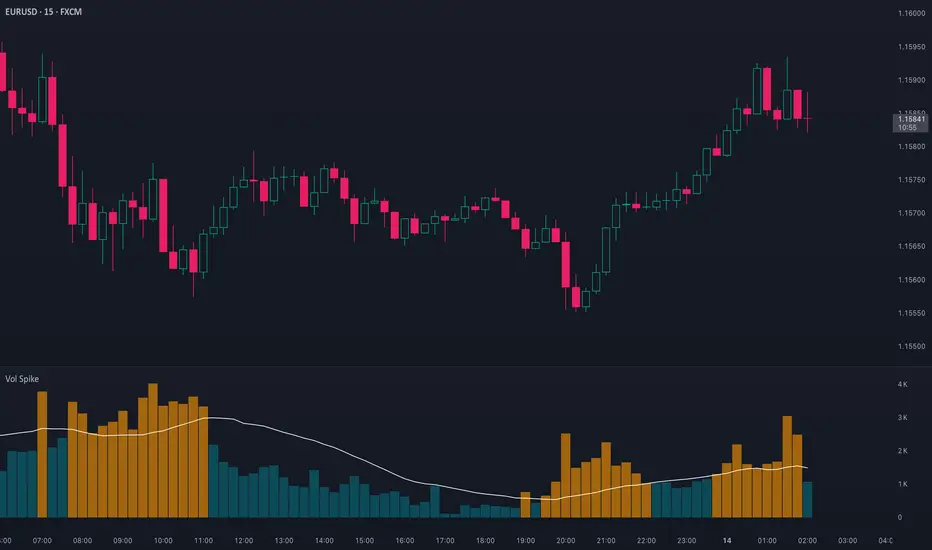
Volume Spike (Multi-Timeframe)Volume Spike (Multi-Timeframe)
Overview
Volume Spike (Multi-Timeframe) evaluates traded volume against its moving average on a selected timeframe so traders can identify when activity departs from recent norms.
What it does
Calculates volume on the chart timeframe or any alternate timeframe you select in the inputs.
Builds a configurable simple moving average to establish a rolling volume benchmark.
Applies distinct colors to spike and baseline volume columns to highlight deviations.
Plots the related moving-average line for reference.
Registers an alert condition when volume closes above its moving-average baseline.
How to use it
Choose the desired Volume Timeframe (leave blank to inherit the chart’s period).
Tune the Volume MA Length to balance responsiveness and noise.
Adjust the spike, base, and MA colors to align with existing chart styling.
Enable the alert condition when automated notification of spikes is needed.
Implementation notes
Timeframe selection is applied consistently to both the raw volume series and its moving average.
Color inputs allow visual adjustments without modifying code.
Alert messaging specifies that the event is a volume spike relative to the selected timeframe baseline.
Disclaimer
This indicator is designed as a technical analysis tool and should be used in conjunction with other forms of analysis and proper risk management.
Past performance does not guarantee future results, and traders should thoroughly test any strategy before implementing it with real capital.
ICT Sessions [TradeWithRon]
ICT Sessions and killzones maps three intraday sessions on your chart (Asia, London, NY), tracks each session’s live high/low, draws optional session range boxes, and projects ICT OTE zones in real time—with granular styling, touch/mitigation logic, and alerting.
What it does
Live Session high/low tracking.
Historical session lines:
When a session ends, its final High/Low are preserved as tracked lines (with optional labels) for a configurable number of recent sessions.
Session boxes (ranges):
Draws a shaded box from session start to end that expands with new highs/lows. Limit how many recent boxes remain on chart.
ICT OTE zones (live):
For the currently active session, projects user-defined Fibonacci OTE levels (e.g., 61.8%, 70.5%, 78.6) between the session’s running high and low. Zones update tick-by-tick and can show labels. You can retain a history of recent sessions’ OTE levels.
Break visualization (mitigation):
Optionally color the bar when price breaks a stored session High/Low. You can:
Require a body close through the level (vs. any touch)
Auto-remove the line and/or label on touch/close
Use custom break colors per session and side (high/low)
Timestamps:
Add up to two recurring vertical timestamp markers (e.g., 08:00, 09:30), plus an opening horizontal marker (e.g., 09:30) with label that extends until the next occurrence.
Alerts:
Built-in alerts for:
Touch of Session 1/2/3 High/Low (Asia/London/NY)
Touch of OTE levels (per session)
Key inputs:
Time & Limits
Timezone (e.g., GMT-4)
Timeframe limit: hide all drawings on and above a specified TF
Sessions
Session windows (default):
Session 1 (Asia): 18:00–00:00
Session 2 (London): 00:00–06:00
Session 3 (NY): 08:00–12:00
How many to keep (lines/boxes)
Line width, colors, and label suffixes (“High”/“Low”)
Labels: toggle, text (“Asia”, “London”, “NY”), size, and colors
Boxes: toggle per session and background colors
ICT OTE Zones
Toggle per session (Asia/London/NY)
Levels (comma-separated %s, e.g., 61.8,70.5,78.6)
History: number of past sessions to retain
Opacity, line width/style, and label size
Custom label text per session (e.g., “Asia OTE”)
Break/Mitigation Behavior:
Enable Mitigated Candles (bar color on break)
Remove line on touch and/or remove label on touch
Require body close (vs. wick touch)
Custom break colors by session and side
Timestamps
Opening horizontal line (time, style, width, color, label text/size, drawing limit)
Two vertical timestamps (times, style, width, color, drawing limit)
Alerts
Master Enable Alerts
Per-session toggles for High/Low touches
OTE touch alerts
How it works (under the hood)
Detects session state via input.session() windows in the chosen timezone.
Live session High/Low lines and labels update in real time; on session end, final levels are stored with optional labels and tracked length.
OTE zones are live-computed from current session High↔Low and refreshed every bar; a compact rolling history is enforced.
Bar coloring reacts to break events (touch or body-close, per your setting) and uses session-specific colors when enabled.
Timestamp lines/labels are created on each occurrence and trimmed to a drawing limit for performance.
Tips:
To hide session lines but keep boxes, set line color opacity to 0.
Use Timeframe Limit to keep higher-TF charts clean.
Fine-tune OTE Levels and History to balance clarity and performance.
For stricter break logic, enable Require Body Close.
Note: The script reserves high limits for lines/labels/boxes to keep recent context visible while managing cleanup automatically. Adjust “Session Number” and “Number Of Boxes” to suit your workflow.
— © TradeWithRon
Cumulative Volume Delta Z Score [BackQuant]Cumulative Volume Delta Z Score
The Cumulative Volume Delta Z Score indicator is a sophisticated tool that combines the cumulative volume delta (CVD) with Z-Score normalization to provide traders with a clearer view of market dynamics. By analyzing volume imbalances and standardizing them through a Z-Score, this tool helps identify significant price movements and market trends while filtering out noise.
Core Concept of Cumulative Volume Delta (CVD)
Cumulative Volume Delta (CVD) is a popular indicator that tracks the net difference between buying and selling volume over time. CVD helps traders understand whether buying or selling pressure is dominating the market. Positive CVD signals buying pressure, while negative CVD indicates selling pressure.
The addition of Z-Score normalization to CVD makes it easier to evaluate whether current volume imbalances are unusual compared to past behavior. Z-Score helps in detecting extreme conditions by showing how far the current CVD is from its historical mean in terms of standard deviations.
Key Features
Cumulative Volume Delta (CVD): Tracks the net buying vs. selling volume, allowing traders to gauge the overall market sentiment.
Z-Score Normalization: Converts CVD into a standardized value to highlight extreme movements in volume that are statistically significant.
Divergence Detection: The indicator can spot bullish and bearish divergences between price and CVD, which can signal potential trend reversals.
Pivot-Based Divergence: Identifies price and CVD pivots, highlighting divergence patterns that are crucial for predicting price changes.
Trend Analysis: Colors bars according to trend direction, providing a visual indication of bullish or bearish conditions based on Z-Score.
How It Works
Cumulative Volume Delta (CVD): The CVD is calculated by summing the difference between buying and selling volume for each bar. It represents the net buying or selling pressure, giving insights into market sentiment.
Z-Score Normalization: The Z-Score is applied to the CVD to normalize its values, making it easier to compare current conditions with historical averages. A Z-Score greater than 0 indicates a bullish market, while a Z-Score less than 0 signals a bearish market.
Divergence Detection: The indicator detects regular and hidden bullish and bearish divergences between price and CVD. These divergences often precede trend reversals, offering traders a potential entry point.
Pivot-Based Analysis: The indicator uses pivot highs and lows in both price and CVD to identify divergence patterns. A bullish divergence occurs when price makes a lower low, but CVD fails to follow, suggesting weakening selling pressure. Conversely, a bearish divergence happens when price makes a higher high, but CVD doesn't confirm the move, indicating potential selling pressure.
Trend Coloring: The bars are colored based on the trend direction. Green bars indicate an uptrend (CVD is positive), and red bars indicate a downtrend (CVD is negative). This provides an easy-to-read visualization of market conditions.
Standard Deviation Levels: The indicator plots ±1σ, ±2σ, and ±3σ levels to indicate the degree of deviation from the average CVD. These levels act as thresholds for identifying extreme buying or selling pressure.
Customization Options
Anchor Timeframe: The user can define an anchor timeframe to aggregate the CVD, which can be customized based on the trader’s needs (e.g., daily, weekly, custom lower timeframes).
Z-Score Period: The period for calculating the Z-Score can be adjusted, allowing traders to fine-tune the indicator's sensitivity.
Divergence Detection: The tool offers controls to enable or disable divergence detection, with the ability to adjust the lookback periods for pivot detection.
Trend Coloring and Visuals: Traders can choose whether to color bars based on trend direction, display standard deviation levels, or visualize the data as a histogram or line plot.
Display Options: The indicator also allows for various display options, including showing the Z-Score values and divergence signals, with customizable colors and line widths.
Alerts and Signals
The Cumulative Volume Delta Z Score comes with pre-configured alert conditions for:
Z-Score Crossovers: Alerts are triggered when the Z-Score crosses the 0 line, indicating a potential trend reversal.
Shifting Trend: Alerts for when the Z-Score shifts direction, signaling a change in market sentiment.
Divergence Detection: Alerts for both regular and hidden bullish and bearish divergences, offering potential reversal signals.
Extreme Imbalances: Alerts when the Z-Score reaches extreme positive or negative levels, indicating overbought or oversold market conditions.
Applications in Trading
Trend Identification: Use the Z-Score to confirm bullish or bearish trends based on cumulative volume data, filtering out noise and false signals.
Reversal Signals: Divergences between price and CVD can help identify potential trend reversals, making it a powerful tool for swing traders.
Volume-Based Confirmation: The Z-Score allows traders to confirm price movements with volume data, providing more reliable signals compared to price action alone.
Divergence Strategy: Use the divergence signals to identify potential points of entry, particularly when regular or hidden divergences appear.
Volatility and Market Sentiment: The Z-Score provides insights into market volatility by measuring the deviation of CVD from its historical mean, helping to predict price movement strength.
The Cumulative Volume Delta Z Score is a powerful tool that combines volume analysis with statistical normalization. By focusing on volume imbalances and applying Z-Score normalization, this indicator provides clear, reliable signals for trend identification and potential reversals. It is especially useful for filtering out market noise and ensuring that trades are based on significant price movements driven by substantial volume changes.
This indicator is perfect for traders looking to add volume-based analysis to their strategy, offering a more robust and accurate way to gauge market sentiment and trend strength.

Ghost BookGhost Book is an indicator that visualizes the distribution of bid and ask amount — the activity of buyers and sellers — in the form of a synthetic order book.
While a real order book shows active limit orders, Ghost Book displays the most recent n ticks (controlled by the input Max rows count in book).
For each tick, the indicator shows:
Price
Amount
Total trade value
Trade side (buyer or seller)
Relative weight of the tick by its amount
The center row displays the current closing price as a reference point between buyers and sellers.
Note: This indicator uses tick-level data. If your TradingView subscription level does not include tick data, the indicator will not function correctly.

TrendViz - Smart Money ConceptsTrendViz – Smart Money Concepts
See structure, liquidity, and institutional footprints in real time.
Overview
Trend Viz – Smart Money Concepts is a comprehensive SMC toolkit that fuses market-structure (BOS / CHoCH), volumetric order blocks, fair-value gaps (FVG / Breakers), Swing Failure Patterns (SFP), equal highs / lows, and liquidity zones into one clean, on-chart visualization.
It’s designed for intraday precision (0DTE / indices) and swing confluence, with windowed processing for performance on large histories.
Key Capabilities
Market Structure Engine – Detects BOS / CHoCH with adjustable swing length, “Extreme vs Adjusted Points” logic, optional trend-based candle coloring, sweep marks, and labeled lines / bubbles.
Volumetric Order Blocks – Builds bullish / bearish OBs (including breaker blocks), mitigation methods (Close / Wick / Avg), overlap control, mid-line, and activity split (buy vs sell) with per-OB volume metrics.
Fair Value Gaps (FVG & Breakers) – Auto-detects FVGs, mitigations, optional extension, mid-lines, overlap filtering, and raid marking.
Swing Failure Pattern (SFP) – Volume-aware SFPs, directional filters (Trend-Following / Counter-Trade), deviation projections (levels + optional fill).
Equal Highs / Lows & Liquidity Concepts – Marks EQH / EQL across multiple horizons, buyside / sellside zones (area or line), liquidity prints on candles, and sweep zones after BOS / CHoCH.
Performance-First Design – Window size limits structure computations; configurable max objects; overlap suppression reduces clutter.
Inputs & Settings
Market Structure – Window size, Swing limit, Candle coloring, Text size, Algorithmic mode, Swing length, Strong/Weak HL, Sweeps, Bubbles, Mapping.
Volumetric Order Blocks – Show Last N blocks, Breakers, Construction mode, ATR length, Mitigation method, Metrics + Mid-line, Hide Overlap.
Fair Value Gap / Breakers – Enable mode, Show Last N, Threshold, Mid-line + Extension, Hide Overlap, Raid Display.
Swing Failure Pattern (SFP) – Count, Deviation Area, Colors, Filtering mode (Trend / Counter), Volume threshold, Label size.
Liquidity Concepts – Equal H&L scope, Liquidity prints, Buyside/Sellside zones (area or line), Sweep Area threshold.
How to Use It
Quick Start
Add the indicator to your chart → leave defaults.
For 0DTE / intraday use 1 – 5 min timeframes; for swing use 1H – 4H.
Turn on Color Candles to see bullish / bearish bias.
Enable Order Blocks (Show Last 5 – 10) and FVG (3 – 5) with Mitigation = Wick.
Activate SFP with Volume Threshold ≈ 0.5 – 1.0 and Trend-Following filter.
Core Workflows
Trend-Continuation Entry – Wait for CHoCH → BOS alignment → FVG mitigation or OB mid-line retest.
Reversal Entry – Opposing CHoCH + sweep (x) + fresh OB confirmation.
Liquidity Sweep Fade – Raid EQH/EQL + SFP (Counter-Trade) → target prior FVG or opposite OB.
0DTE / Index Checklist
Timeframe 1–5 min · Adjusted Points · mslen = 3–5.
OB Show Last = 5–10 · Mitigation = Wick · Hide Overlap = Recent.
FVG Show = 3–5 · Threshold = 0.1–0.3.
SFP Trend-Following for momentum, Counter-Trade for range.
Trade only after CHoCH → BOS alignment near OB / FVG.
Tips & Behavior
Confirmation / Repainting – Structure anchors confirm after right bars; no repaint once locked.
Performance – Reduce Window size, counts, and overlaps for speed.
Clutter Control – Hide Overlap, limit count, prefer mid-lines over fills.
Mitigation Choice – Wick (strict), Close (lenient), Avg (balanced).
Alerts – Not included by default (visual tool only).
Example Setups
Momentum Pullback – After BOS up, FVG fill + OB reclaim = entry.
Liquidity Sweep Fade – EQH raid + bear SFP = fade to prior FVG.
Breaker Flip – Mitigated OB turns breaker; trade retest.
Disclaimer
This indicator is for educational and analytical purposes only.
Not financial advice. Backtest and apply proper risk management before using live.
Tags
#SmartMoneyConcepts #OrderBlocks #BOS #CHoCH #FVG #Breakers #SFP #Liquidity #EQH #EQL #0DTE #SPX #MarketStructure #TrendViz #TradingView
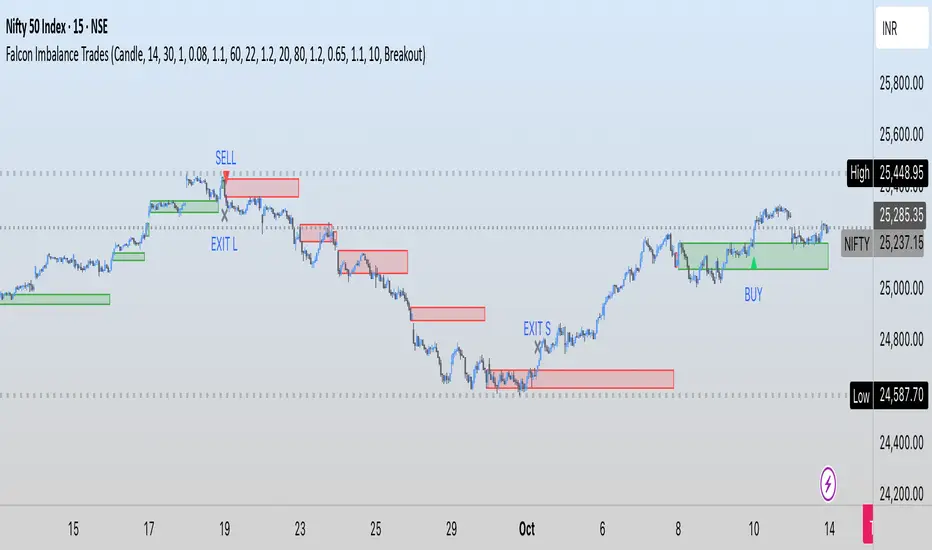
Falcon Imbalance TradesIn this indicator, I am using ATR + Volume to find breakouts. These candles where I am getting these breakouts, I am creating a box for price action. If candle breaks above it, it gives us a buy signal. Similarly for downside.
The logic is to find imbalance so that we can avoid sideways market and focus on trending or impulsive move.
I hope you enjoy this indicator. Drop comments for any questions.
CVD with Trend LineThis indicator augments the traditional Cumulative Volume Delta (CVD) by incorporating a customizable trend line that connects the tops of the CVD histogram bars, enhancing visualization of delta trends and market momentum. The CVD measures the net difference between buying and selling volume, utilizing lower timeframe data for accuracy, with configurable anchor periods and timeframe options. The trend line, which can be tailored in both color and style (e.g., solid, dashed), provides traders with a flexible tool to track cumulative delta movements, aiding in the identification of market sentiment shifts. Perfect for volume-based analysis with a clear, adaptable display.
Koncorde Crossing Screener (UP/DOWN) AlertThis indicators works on Koncorde Crossing Pattern, generating alerts when Cross is Up (buy) and Down (sell).

Volume Delta [BigBeluga]🔵 OVERVIEW
The Volume Delta indicator visualizes the dominance between buying and selling volume within a given period. It calculates the percentage of bullish (buy) versus bearish (sell) volume, then color-codes the candles and provides a real-time dashboard comparing delta values across multiple currency pairs. This makes it a powerful tool for monitoring order-flow strength and intermarket relationships in real time.
🔵 CONCEPTS
Each bar’s buy volume is counted when the close is higher than the open.
Each bar’s sell volume is counted when the close is lower than the open.
volumeBuy = 0.
volumeSell = 0.
for i = 0 to period
if close > open
volumeBuy += volume
else
volumeSell += volume
The indicator sums both over a chosen period to calculate the ratio of buy-to-sell pressure.
Delta (%) = (Buy Volume ÷ (Buy Volume + Sell Volume)) × 100.
Gradient colors highlight whether buying or selling pressure dominates.
🔵 FEATURES
Calculates real-time Volume Delta for the selected chart or for multiple assets.
Colors candles dynamically based on the delta intensity (green = buy pressure, red = sell pressure).
Displays a dashboard table showing volume delta % for up to five instruments.
The dashboard features visual progress bars for quick intermarket comparison.
An optional Delta Bar Panel shows the ratio of Buy/Sell volumes near the latest bar.
A floating label shows the exact Buy/Sell percentages.
Works across all symbols and timeframes for multi-asset delta tracking.
🔵 HOW TO USE
When Buy % > Sell % , it often signals bullish momentum or strong accumulation—but can also indicate over-excitement and a possible market top.
Market Tops
When Sell % > Buy % , it typically reflects bearish pressure or distribution—but may also occur near a market bottom where selling exhaustion forms.
Market Bottom
Use the Dashboard to compare volume flow across correlated assets (e.g., major Forex pairs or sector groups).
Combine readings with trend or volatility filters to confirm whether the imbalance aligns with broader directional conviction.
Treat the Delta Bar visualization as a real-time sentiment gauge—showing which side (buyers or sellers) dominates the current session.
🔵 CONCLUSION
Volume Delta transforms volume analysis into an intuitive directional signal.
By quantifying buy/sell pressure and displaying it as a percentage or color gradient, it provides traders with a clearer picture of real-time volume imbalance — whether within one market or across multiple correlated instruments.

Basic FVG (Zuki)This indicator identifies and displays Fair Value Gaps (FVGs) to highlight market imbalances.
FEATURES:
- Detects classic bullish and bearish FVGs.
- Option to automatically delete FVGs once filled by a wick.
- Customize FVG colors and box length.
- Use Lookback Period and Max FVG settings to keep the chart clean.
Simple

Volume Sampled Supertrend [BackQuant]Volume Sampled Supertrend
A Supertrend that runs on a volume sampled price series instead of fixed time. New synthetic bars are only created after sufficient traded activity, which filters out low participation noise and makes the trend much easier to read and model.
Original Script Link
This indicator is built on top of my volume sampling engine. See the base implementation here:
Why Volume Sampling
Traditional charts print a bar every N minutes regardless of how active the tape is. During quiet periods you accumulate many small, low information bars that add noise and whipsaws to downstream signals.
Volume sampling replaces the clock with participation. A new synthetic bar is created only when a pre-set amount of volume accumulates (or, in Dollar Bars mode, when pricevolume reaches a dollar threshold). The result is a non-uniform time series that stretches in busy regimes and compresses in quiet regimes. This naturally:
filters dead time by skipping low volume chop;
standardizes the information content per bar, improving comparability across regimes;
stabilizes volatility estimates used inside banded indicators;
gives trend and breakout logic cleaner state transitions with fewer micro flips.
What this tool does
It builds a synthetic OHLCV stream from volume based buckets and then applies a Supertrend to that synthetic price. You are effectively running Supertrend on a participation clock rather than a wall clock.
Core Features
Sampling Engine - Choose Volume buckets or Dollar Bars . Thresholds can be dynamic from a rolling mean or median, or fixed by the user.
Synthetic Candles - Plots the volume sampled OHLC candles so you can visually compare against regular time candles.
Supertrend on Synthetic Price - ATR bands and direction are computed on the sampled series, not on time bars.
Adaptive Coloring - Candle colors can reflect side, intensity by volume, or a neutral scheme.
Research Panels - Table shows total samples, current bucket fill, threshold, bars-per-sample, and synthetic return stats.
Alerts - Long and Short triggers on Supertrend direction flips for the synthetic series.
How it works
Sampling
Pick Sampling Method = Volume or Dollar Bars.
Set the dynamic threshold via Rolling Lookback and Filter (Mean or Median), or enable Use Fixed and type a constant.
The script accumulates volume (or pricevolume) each time bar. When the bucket reaches the threshold, it finalizes one or more synthetic candles and resets accumulation.
Each synthetic candle stores its own OHLCV and is appended to the synthetic series used for all downstream logic.
Supertrend on the sampled stream
Choose Supertrend Source (Open, High, Low, Close, HLC3, HL2, OHLC4, HLCC4) derived from the synthetic candle.
Compute ATR over the synthetic series with ATR Period , then form upperBand = src + factorATR and lowerBand = src - factorATR .
Apply classic trailing band and direction rules to produce Supertrend and trend state.
Because bars only come when there is sufficient participation, band touches and flips tend to align with meaningful pushes, not idle prints.
Reading the display
Synthetic Volume Bars - The non-uniform candles that represent equal information buckets. Expect more candles during active sessions and fewer during lulls.
Volume Sampled Supertrend - The main line. Green when Trend is 1, red when Trend is -1.
Markers - Small dots appear when a new synthetic sample is created, useful for aligning activity cycles.
Time Bars Overlay (optional) - Plot regular time candles to compare how the synthetic stream compresses quiet chop.
Settings you will use most
Data Settings
Sampling Method - Volume or Dollar Bars.
Rolling Lookback and Filter - Controls the dynamic threshold. Median is robust to outliers, Mean is smoother.
Use Fixed and Fixed Threshold - Force a constant bucket size for consistent sampling across regimes.
Max Stored Samples - Ring buffer limit for performance.
Indicator Settings
SMA over last N samples - A moving average computed on the synthetic close series. Can be hidden for a cleaner layout.
Supertrend Source - Price field from the synthetic candle.
ATR Period and Factor - Standard Supertrend controls applied on the synthetic series.
Visuals and UI
Show Synthetic Bars - Turn synthetic candles on or off.
Candle Color Mode - Green/Red, Volume Intensity, Neutral, or Adaptive.
Mark new samples - Puts a dot when a bucket closes.
Show Time Bars - Overlay regular candles for comparison.
Paint candles according to Trend - Colors chart candles using current synthetic Supertrend direction.
Line Width , Colors , and Stats Table toggles.
Some workflow notes:
Trend Following
Set Sampling Method = Volume, Filter = Median, and a reasonable Rolling Lookback so busy regimes produce more samples.
Trade in the direction of the Volume Sampled Supertrend. Because flips require real participation, you tend to avoid micro whipsaws seen on time bars.
Use the synthetic SMA as a bias rail and trailing reference for partials or re-entries.
Breakout and Continuation
Watch for rapid clustering of new sample markers and a clean flip of the synthetic Supertrend.
The compression of quiet time and expansion in busy bursts often makes breakouts more legible than on uniform time charts.
Mean Reversion
In instruments that oscillate, faded moves against the synthetic Supertrend are easier to time when the bucket cadence slows and Supertrend flattens.
Combine with the synthetic SMA and return statistics in the table for sizing and expectation setting.
Stats table (top right)
Method and Total Samples - Sampling regime and current synthetic history length.
Current Vol or Dollar and Threshold - Live bucket fill versus the trigger.
Bars in Bucket and Avg Bars per Sample - How much time data each synthetic bar tends to compress.
Avg Return and Return StdDev - Simple research metrics over synthetic close-to-close changes.
Why this reduces noise
Time based bars treat a 5 minute print with 1 percent of average participation the same as one with 300 percent. Volume sampling equalizes bar information content. By advancing the bar only when sufficient activity occurs, you skip low quality intervals that add variance but little signal. For banded systems like Supertrend, this often means fewer false flips and cleaner runs.
Notes and tips
Use Dollar Bars on assets where nominal price varies widely over time or across symbols.
Median filter can resist single burst outliers when setting dynamic thresholds.
If you need a stable research baseline, set Use Fixed and keep the threshold constant across tests.
Enable Show Time Bars occasionally to sanity check what the synthetic stream is compressing or stretching.
Link again for reference
Original Volume Based Sampling engine:
Bottom line
When you let participation set the clock, your Supertrend reacts to meaningful flow instead of idle prints. The result is a cleaner state machine, fewer micro whipsaws, and a trend read that respects when the market is actually trading.

CustVolumeStudy - Stacked Buy/Sell + Sell% (top-right)Current Bar Sell + Stacked Buy/Sell. This indicator helps tell the story of momentum on the current bar. If the % is high then it is bearish. Low it is bullish.
Syxx Delta [Syxx] - Delta Candles-Delta Candles
Volume Delta Candles offer a straightforward way to analyze trading activity within each candle, making it easier to see what's happening without needing an extra volume indicator. This tool uses lower timeframe or real-time data to show the percentage of buying and selling volume within a candle as a colored bar. Make sure you understand Volume and Volume Delta before jumping in. If you’re not sure, reach out to me first for a quick rundown. But if you're already familiar, you're good to go!
Key Features:
Intrabar Volume Analysis: This feature focuses on the volume within each candle, giving you a clearer picture of the trading activity without relying on external indicators.
Volume Delta: Volume Delta represents the difference between buying and selling volumes. Buy volume is linked to bullish candles, while sell volume is tied to bearish ones. A positive volume delta is shown as a green area, and a negative volume delta is shown as red.
Candle Coloring: Depending on your settings, the tool can color bars either fully or halfway. When set to "Full Bar," it fills the entire bar based on the volume delta. When set to "Half Bar," it colors half or the entire half of the bar. A bar with more selling activity than buying (negative delta) will fill from the top or center downward, and vice versa for a positive delta.
Volume Highlighting: The tool highlights the price level within each candle where the highest volume occurred with a line. If you enable the "Show Previous Max Volume Price" setting, a dot will mark the previous candle's highest volume level.
Real-Time Data: It can use either lower timeframe data or real-time tick data, depending on your preference.

Coinbase Premium IndexCoinbase Premium Index
This indicator tracks the price premium or discount of Bitcoin on Coinbase relative to Binance, providing insights into institutional demand and market sentiment.
How It Works:
- Compares BTC/USD price on Coinbase vs BTC/USDT on Binance
- Calculates the price differential in real-time
- Displays as a histogram with positive (green) or negative (red) values
- Offers both percentage and dollar-based views
Key Features:
- Dual Display Modes: Switch between percentage and dollar premium
- Color-Coded Histogram: Green bars indicate Coinbase premium, red bars show discount
- Real-Time Data: Uses live price feeds from both exchanges
- Clean Visualization: Easy-to-read histogram format in separate pane
Market Implications:
- Positive Premium (Green): Coinbase trading higher = potential institutional buying pressure
- Negative Premium (Red): Coinbase trading lower = possible institutional selling or retail dominance
- Magnitude Matters: Larger premiums/discounts suggest stronger sentiment shifts
- Divergence Signals: Premium changes can precede price movements
Use Cases:
- Gauge institutional vs retail sentiment
- Identify potential trend reversals
- Confirm breakout strength
- Monitor smart money flow
Settings:
- Display Mode: Choose between "Percentage" or "Dollar" view
Volume Exponential Moving Averages (EMA)
Description:
This script is a simple script that plots a desired exponential moving average of buy and sell volume as a line chart with a tunable smoothing factor. There is a highlight on the plot area of either green or red to denote if the EMA of buy volume or sell volume is of a higher value. This indicator uses basic math of exponential averages and calculates volume using the formulas: "buy volume" = the product of total volume and the "closing price" minus the "low price" divided by "high price" minus the "low price" for a specific candle. Conversely, "sell volume" = the product of "total volume" and the "high price" minus the "close price" divided by "high price" minus the "low price" for a specific candle.
Utility:
This indicator is an effective way to gauge the acceleration/ deceleration of buyers and sellers in the market and can be used in combination with market structure and important levels to understand if buyers or sellers are taking over at any given time.
How to use this indicator:
There are two settings for this indicator:
1. The Length of the EMA: The length of the EMA can be adjusted based on your preference for a running number of candles' data. If you are interested to know short term changes in volume (e.g. over the past few candles at a major level) you can adjust this setting lower (~3-9 length). Conversely, if you are interested in volume trends over a greater number of candles you can increase this to your liking.
Personal preference : Because I am a short term daytrader/ scalper, I keep this setting at 6 length to see immediate changes in the acceleration or deceleration of buyers/ sellers.
2. The Smoothing Factor: The smoothing factor can be adjusted to further tune the size of trend you are interested in with 1 = No smoothing of the EMA line. Smoothing of the EMA line increases as the value for smoothing increases, resulting in a less volatile, more smooth EMA line. However, the more smooth the line, the less sensitive the EMA will be to immediate changes in volume pace. The less smoothing factor is applied, the more volatile data will be, resulting in quicker observation of shorter term trends. Again the same rules apply as the EMA length as these are similar in function: If you are interested to know short term changes in volume (e.g. over the past few candles at a major level) you can adjust this setting lower (~2-6). Conversely, if you are interested in volume trends over a greater number of candles you can increase this to your liking.
Personal preference : Because I am a short term daytrader/ scalper, I keep this setting at 2-4 smoothing factor to see immediate changes in the acceleration or deceleration of buyers/ sellers.
You should, of course, play with these settings to your exact preferences based on your trading style.
Tips for using this indicator:
General Use:
When the buy volume EMA is moving up, buyers are increasing the pace of buying and when the buy volume EMA is moving down, buyers are decreasing the pace of buying. Conversely, when the sell volume EMA is moving up, sellers are increasing the pace of selling and when the sell volume EMA is moving down, sellers are decreasing the pace of selling. The overall movement of the stock is relative to the combination of these rates. e.g. If both buyers and sellers are increasing at the same rate (EMAs slopes are roughly equal) there will be not a large change in price. If the slope of the buy volume EMA is greater than the slope of sell volume EMA, the price should move up. Conversely, if the slope of the sell volume EMA is greater than the slope of buy volume EMA, the price should move down.
Predicting pullbacks, reversals, and continuations:
This indicator allows you to see if buyers or sellers are increasing their pace, even if the stock price is in consolidation. This allows you to predict if out of the consolidation buyers or sellers are likely to win based on the momentum of the volume in consolidation. e.g. If price is in consolidation after an uptrend and the buy volume EMA starts to decrease, this could be a sign that buyers are running out of steam at this price level. Another example, If at a major support the buy volume EMA begins to trend up then buyers are accelerating the pace of buying at this level.
EMA crosses: There is something to be said about the point at which the buy volume EMA and sell volume EMA cross. This signifies that at this moment there is a shift in which the acceleration of one party outpaces that of the other and can result in increased speed of the movement of the stock price.
Considerations
Because volume changes constantly, this indicator is best to identify short term changes in volume that could impact price movements. It is not guaranteed to continue just because buyers or sellers have had a change in pace. Therefore it is advised to use this indicator in combination with significant price levels such as pivot points, or price levels from volume profile tools to identify the price zones where significant volume changes are likely to impact price movements. It is also advised to continue to monitor the changes in pace in buyers and sellers using this volume EMA indicator to determine if a change in pace is short lived or if it will continue for a longer duration.
Examples of use:
Bullish Reversal:
Bearish Continuation:
Bearish EMA Crossover: (Settings: Length 6, Smoothing factor 3)
Bullish EMA Crossover: (Settings: Length 6, Smoothing factor 4)
Volume BubblesVolume Bubbles Indicator
Introduction
The Volume Bubbles indicator is a powerful tool designed to visually highlight significant volume spikes on your TradingView charts. It helps traders identify potential areas of whale accumulation (large buying activity) or dumping (large selling activity) by displaying colored bubbles on candles where volume exceeds a customizable threshold. Green bubbles indicate bullish (buy) volume on up candles, suggesting possible accumulation, while red bubbles signal bearish (sell) volume on down candles, indicating potential dumping. The bubble size scales with the volume magnitude, making it easy to spot major market moves at a glance.
This indicator is particularly useful for crypto, forex, and stock traders looking to gauge market sentiment and large player involvement without cluttering the chart. It's built in Pine Script v5 and overlays directly on your price action.
How It Works
The indicator calculates a moving average of volume (default: 20-period SMA) and detects spikes when current volume exceeds this average by a multiplier (default: 2x).
Buy Bubbles (Green): Appear on bullish candles (close >= open) at the low wick, representing potential whale buying or accumulation zones.
Sell Bubbles (Red): Appear on bearish candles (close < open) at the high wick, indicating potential whale selling or dumping zones.
Bubble Size: Dynamically sized based on volume thresholds – huge for >1M, large for 500K-1M, normal for <500K.
Transparency: Increases with volume ratio for better visibility on extreme spikes.
Tooltip:
Hover over a bubble to see detailed info like total volume, average volume, and ratio.
By focusing on these high-volume events, traders can spot key support/resistance levels where whales might be active.
How to Use for Whale Accumulation and Dumping
Whales (large holders) often move markets with high-volume trades. This indicator helps spot them:
Accumulation (Buying): Look for clusters of large green bubbles at price lows or during consolidations. This suggests whales are buying dips, potentially signaling a reversal or uptrend start. Combine with support levels for confirmation.
Dumping (Selling): Watch for big red bubbles at price highs or after rallies. This indicates whales unloading positions, which could lead to downtrends or corrections. Pair with resistance levels.
Tips:
Use on higher timeframes (e.g., 1H+) for reliable signals.
Confirm with other indicators like RSI or MACD to avoid false positives.
In trending markets, buy bubbles in uptrends confirm strength; sell bubbles in downtrends signal continuation.
Credits and Disclaimer
Inspired by volume analysis techniques. This is free to use; feedback welcome! Not financial advice – trade at your own risk.

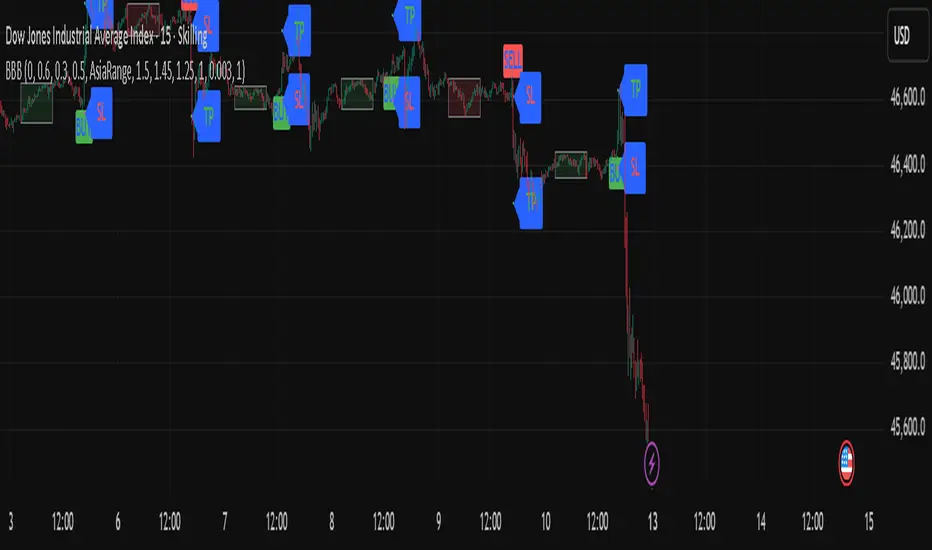
BBB INDICATOR - London Breakout BBB Indicator — London Breakout
The indicator highlights potential London session breakouts derived from the Asian session range.
How it works (high level):
• Draws the Asian session box (03:00–10:00 UTC+3).
• After London opens (11:00 UTC+3), a breakout is valid when the candle’s body exceeds user-defined thresholds (body% of bar, buffer vs Asia range, optional body ≥ k × ATR).
• Once valid, it plots Entry at the breakout close, SL based on the selected method, and TP using a fixed R:R (default 1:1.5).
Intended use: XAUUSD / 15m (testable elsewhere).
Important: Use on standard candlestick charts only. Non-standard chart types (Heikin Ashi, Renko, Kagi, Point & Figure, Range) are not supported and may produce unrealistic results.
Inputs overview: Asia session hours, London open, body% threshold, Asia-range buffer %, optional ATR multiple, and R:R.
Notes: Educational tool to assist analysis; not financial advice. No external links or solicitations.