Position Size calculatorOverview
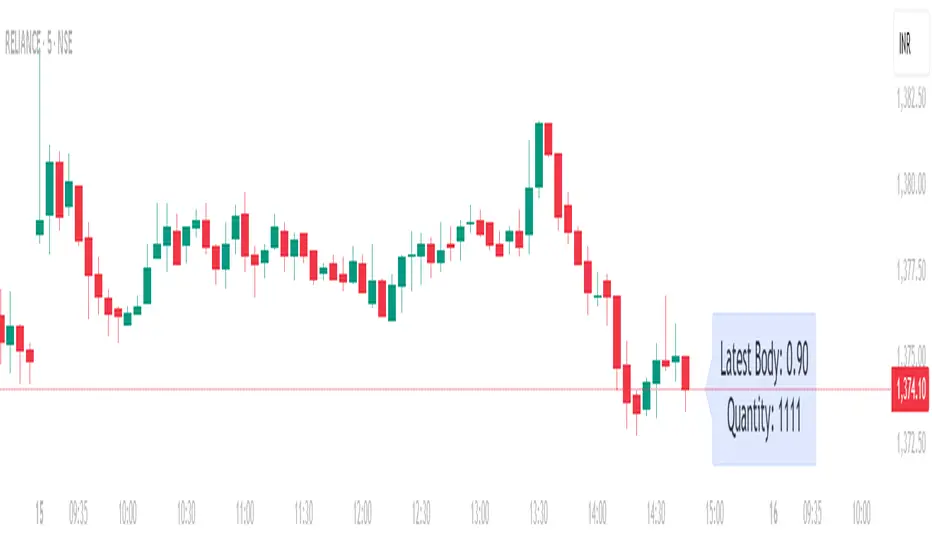
This indicator automatically calculates the average candle body size (|open − close|) for the current trading day and derives a position size (quantity) based on your fixed risk per trade (default ₹1000).
For example:
If today’s average candle body = ₹3.50 and risk = ₹1000 → Quantity = 285
How It Works:
The indicator calculates the absolute difference between open and close (the candle’s body) for every bar of the current day.
It averages those body sizes to estimate the average daily volatility.
Then it divides your chosen risk per trade by the average body size to estimate an appropriate quantity.
It automatically resets at the start of each new day.
Why Use It
While risk size can be derived manually or using TradingView’s built-in Long/Short Position Tool, this indicator provides a faster, more practical alternative when you need to make quick trade decisions — especially in fast-moving intraday markets .
It keeps you focused on execution rather than calculation.
Tip
You can still verify or fine-tune the quantity using the Long/Short Position Tool or a manual calculator, but this indicator helps you react instantly when opportunities appear.
Volume
SicariSicari
What is it?
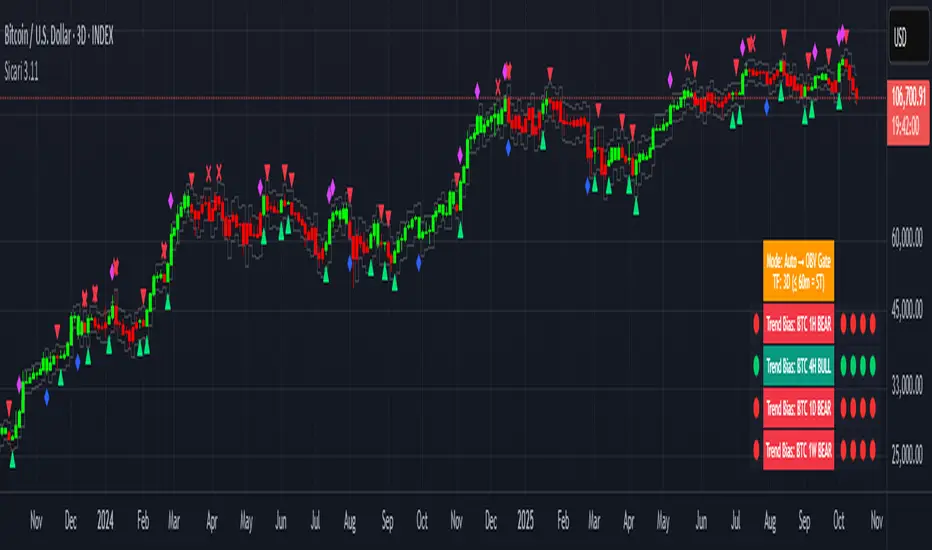
Sicari is a trend-following trading system that identifies potential bullish or bearish trends. It blends EMA trend, OBV participation, and an Adaptive SuperTrend gate (machine-learning k-means over ATR bands) into a strict 2-of-3 confirmation model.
By default, it uses a clean two-colour scheme: 🟢 green = long bias and 🔴 red = short bias.
Optionally, a four-colour mode exposes hedge and early-risk conditions.
Sicari works across all asset classes and timeframes (recommended: 15-minute to monthly).
How it works
* Auto mode adapts by timeframe: ≤60m uses a Hard-Gate where SuperTrend must confirm to flip; >60m uses Majority mode where OBV carries more weight for faster reversals
* Voters are EMA, OBV, and Adaptive SuperTrend; a flip requires 2 of 3 agreement (Hard-Gate also needs ST)
* Optional four-colour candles highlight hedge state when voters disagree. The hedge direction is OBV-led (↑ / ↓ tint), helping you trim risk or wait for full confirmation.
* Multi-Timeframe Trend Bias panel (1H, 4H, 1D, 1W): left dot = live bias for that TF; Four dots on the right show = last four closed bars (newest on right). In 4-colour mode, the left/current dot follows 4-colour logic, history dots remain 2-colour for stability. Compact mode optionally shows only current dots per TF.
What you can plot
* Candles: two-colour by default (🟢 long / 🔴 short); optional 4-colour hedge mode (OBV-led ↑/↓ tint).
* Triangles: mark long/short flips.
* Multi-Timeframe Trend Bias panel: 1H / 4H / 1D / 1W
* VWAPs: Session + Weekly VWAP for fair-value anchoring.
* Moving Averages: Daily 20/50 (non-repainting) and Weekly 20/50/100 stair-step MAs for structure.
* Dynamic ATR Stops: step-line long/short stop bands for risk control and stopped-out detection.
* RSI Take-Profit markers: X-shaped markers on the chart TF (touch / re-entry logic)
* 4H RSI Diamonds: non-repainting diamonds confirming on 4H close
Combined Asset Volume (crypto-aware)
* One toggle aggregates spot volume across major venues
* Majors (BTC/ETH): Binance + Coinbase + Bitfinex + Kraken (USD/USDT/USDC)
* Alts: Binance + Bybit + KuCoin + Coinbase (lean, USDT/USD)
* CRYPTOCAP indexes, non-crypto or FX pairs automatically fall back to the chart’s own volume
* OBV has a unit-volume fallback when volume data is missing
Alerts (programmatic or traditional)
* Programmatic (recommended): Create one alert → “Any alert() function call”. This single alert respects your chosen settings (asset, timeframe, 2/four-colour mode, RSI levels, chop/flip cooldown, stops on/off, etc.) and fires for all enabled conditions once-per-bar-close. Long/short signals trigger only at flips, not every bar.
* Traditional: add specific alerts only for what you want (entries, exits, etc.)
Alert list (fires on bar close)
* 🚀🟢 LONG entry
* 🔻🔴 SHORT entry
* 🟡 HEDGE LONG (four-colour mode)
* 🟠 HEDGE SHORT (four-colour mode)
* 🎯 Take Profit Long (RSI-based)
* 🎯 Take Profit Short (RSI-based)
* 💥🔴 HTF Super SHORT (4H RSI diamond)
* 🚀🟢 HTF Super LONG (4H RSI diamond)
* 💀 Stopped Out of Short (dynamic ATR stop)
* 💀 Stopped Out of Long (dynamic ATR stop)
Programmatic alerts include tick-aware thousands separators and VWAP references on intraday charts for mobile readability
Setup & tips
* After adding Sicari: Click the three dots next to the script name → Visual order → Bring to front. This hides the original candles so Sicari’s candles are fully visible
* Keep Auto mode ON; enable 4-colour only if you want hedge awareness; toggle VWAPs and MAs as structure guides
* Works on crypto, indices, FX and equities - any symbol, ny timeframe
* Use standard candles (not Heikin Ashi)
* Colours optimised for dark backgrounds
Sicari distills trend, participation, and structure into one adaptive stream - delivering institutional-grade precision, clarity, and timing within the Sicari ecosystem.
Volume Imbalances & Gann's Square IndicatorVolume Imbalances & Gann's Square Indicator:
This script is a comprehensive trading toolkit designed to help intraday and swing traders identify high-probability trade setups by combining the strengths of Gann's Theory, price-volume analysis, and multi-indicator signal confirmation in one indicator.
Key Features and Their Roles:
Gann’s S/R Levels:
Calculates main and auxiliary support/resistance lines using Gann’s “odd square” approach based on the current price. Levels are projected historically and into the future to clearly visualize critical zones for potential reversals and breakouts.
Volume*Price (VP) Spike Table:
Detects and displays real-time buy and sell volume spikes above a configurable threshold, highlighting large market transactions. The on-chart table summarizes recent major spikes with time and price for context, resetting every session.
Multi-EMA & VWAP Logic:
Integrates three customizable EMAs, VWAP, and Supertrend. Users can toggle signals from EMA crossovers, price-VWAP positioning, or Supertrend direction to match their preferred trading style and filter signals for trend or mean-reversion strategies.
Buy/Sell Labels and Signal Source Control:
Clearly plots buy/sell marker labels with customizable text, color, and size, based on the chosen signal source (EMA cross, VWAP, Supertrend). Labels offset from candles for easy visibility.
First Candle Range & Session Tools:
Plots the initial range (high, low, and midpoint) of a user-defined session, helping visualize and trade session breakouts or range retests. Session logic ensures all statistical tables and levels reset at session start.
Automated Risk/Reward Table:
Instantly calculates capital allocation, stop-loss, potential quantity, and two profit targets for both long and short trades. Helps traders plan size and risk per trade in compliance with risk management principles.
Highest/Lowest VP Markers:
Highlights the day’s peak and trough volume*price values for context on institutional buying or selling pressure.
Previous Day Range Plotter:
Draws previous session’s high/low levels for reliable reference zones and potential trade targets.
Integration Rationale:
All components are thoughtfully integrated to provide a holistic decision-making workflow:
Volume/price spikes act as momentum or liquidity signals.
Gann levels define the “where” for reaction or breakout trades.
Signal logics (EMA/VWAP/Supertrend) answer the “when,” enabling higher-confidence entries only when multiple conditions align.
How to Use:
Select your preferred inputs for EMAs, VWAP, and risk settings in the panel.
Analyze the chart for signals where buy/sell labels align with fresh VP spikes near Gann or previous day support/resistance.
Use the risk/reward table for strict money management.
Reference spike tables and session range for contextual confirmation.
Visuals and Chart Guidance:
The script displays only essential tables, lines, and labels described above.
All chart elements are explained in this description—no external scripts needed for interpretation.
Each table and marker is linked to actionable trading logic, eliminating clutter.
Closed-source Explanation:
The indicator uses session-based calculations, real-time data arrays, and proprietary math to unify Gann theory logic, large transaction detection, and multi-indicator confirmation. All major trade conditions have alert signals for ready integration with TradingView’s alert system.


High Volume Arrow Signals (Ajustável)The High Volume Arrow Signals (Adjustable) indicator is a professional technical analysis tool designed to clearly pinpoint moments when trading volume significantly exceeds its recent average, signaling potential institutional pressure, strong conviction, or market exhaustion.
Its primary function is to overlay confirmation signals directly onto the price bars without altering the original candle colors.
Strategic Application
This indicator is most effective when used as a confluence tool to confirm moves initiated by price action or other indicators:
Breakout Confirmation: An arrow plotted during a price range breakout suggests the move has genuine volume conviction.
Reversal Identification: A Buy arrow appearing at a key support level (or a Sell arrow at resistance) indicates strong volume rejection and a potential turning point.
The adjustable multiplier ensures users can fine-tune the indicator to the specific volatility and volume characteristics of assets like BTC and ETH across different timeframes.


Squeeze Momentum MACDSqueeze Momentum MACD
🧠 Description
Squeeze Momentum MACD combines the concept of market volatility compression (the “squeeze”) from Bollinger Bands (BB) and Keltner Channels (KC) with a MACD-style momentum oscillator to reveal potential breakout phases.
The indicator first calculates:
BB Width = Upper Band − Lower Band
KC Width = Upper Band − Lower Band
Then it computes their difference:
Δ = BB Width − KC Width
When Δ > 0 → BB width is greater than KC width → volatility is expanding → potential momentum breakout.
When Δ < 0 → BB is inside KC → volatility is compressing → potential squeeze phase before expansion.
This Δ value is then processed through a MACD-style calculation:
MACD Line = EMA(fast) − EMA(slow)
Signal Line = EMA(MACD, signal length)
Histogram = MACD − Signal
The result is a visual momentum oscillator that behaves like MACD but measures volatility expansion instead of price direction.
🔹 Features:
Dynamic 4-color MACD & Signal lines (positive/negative + rising/falling)
Optional display of raw BB & KC widths
Fully adjustable parameters for BB, KC, and MACD
Works on all timeframes and instruments
🔹 Ideal For:
Detecting market squeezes and breakout momentum
Timing entries before volatility expansion
Integrating volatility and momentum into a single framework

Volume Biased CandlesVolume Biased Candles
This indicator visualizes the underlying volume polarity of price action by coloring candles based on directional volume bias over a rolling bucket of bars.
Instead of reading price alone, each candle reflects whether buying or selling pressure has dominated within its recent volume structure — giving a more intuitive picture of volume sentiment beneath price movement.
🔹 How it works
Bucket Size (n) → defines how many candles are aggregated to evaluate directional volume bias
For each bucket, total up-volume and down-volume are compared to determine overall market pressure
Volume Bias Score → a continuous ratio from -1 to +1, representing the relative dominance of buyers or sellers
Candles are colored according to the active bias — green for positive (buying), red for negative (selling)
🔹 Use cases
Visualize shifts in market control without needing divergence overlays
Combine with delta divergence or price structure tools to validate entries and exits
Simplify volume and price insights into an intuitive, single-chart visualization
✨ Volume Biased Candles transforms standard candles into a live sentiment gauge, revealing whether the dominant flow behind price movement is bullish or bearish.

5min ORB with FVG God Modethis is 15 min Order Block strategy who works verry well on 3 min chart just must to close some
trading hours

High Volume AlertThis Pine Script monitors trading volume in real time and alerts you whenever current volume is unusually high — specifically, when it’s greater than a chosen multiple (for example, 1.5×) of the average volume over a recent period (for example, 20 bars).
It’s a quick way to detect volume spikes, which often precede breakouts or reversals.

AlphaFlow - Trend DetectorOVERVIEW
AlphaFlow identifies and tracks large volume moves by combining volume analysis, price impact measurement, and conviction scoring to separate significant institutional moves from normal trading activity. Rather than just flagging high volume, this indicator evaluates whether large trades actually moved the market and assigns conviction levels based on multiple confirmation factors.
WHAT MAKES THIS ORIGINAL
This is not simply a volume indicator or volume-weighted price tracker. The originality lies in the multi-factor conviction scoring system that evaluates whether large volume moves represent genuine institutional conviction or just noise.
Key Differentiators:
- Combines volume ratio AND price impact (volume alone doesn't mean conviction)
- Conviction scoring system that weighs trend alignment, follow-through, and volume persistence
- Cumulative flow tracking that shows persistent directional pressure over time
- Market regime detection (bullish/bearish/sideways) based on flow dynamics
- Tiered signal system (EXTREME/HIGH/MEDIUM conviction) rather than binary signals
This approach solves the problem of volume spikes that don't lead to meaningful price action, or price moves on low volume that don't persist.
HOW IT WORKS
1. Whale Detection Engine:
Volume Qualification: Compares current volume to a rolling average (default 50 bars). Whale activity requires volume to be at least 1.5x the average (adjustable).
Price Impact Requirement: Volume alone isn't enough. The bar must also show significant price movement (default 0.1% minimum). This filters out high-volume consolidation where no one is actually committed to direction.
Direction Identification: Bullish whale = close > open on high volume. Bearish whale = close < open on high volume.
2. Conviction Scoring System:
The indicator doesn't just flag whale activity - it evaluates conviction through multiple factors:
Base Conviction: Calculated from (volume_ratio × price_impact) / 10
This gives higher scores to moves with both exceptional volume AND large price swings.
Trend Alignment Bonus (1.5x multiplier): Whale moves aligned with the 20-period EMA trend receive higher conviction scores. Institutional money tends to accumulate with the trend, not against it.
Follow-Through Bonus (1.3x multiplier): After whale activity, does price continue in that direction over the next bars (default 3)? Genuine conviction shows persistence.
Volume Persistence (1.2x multiplier): Is elevated volume sustained over multiple bars, or is it a one-time spike? The 3-bar average volume ratio above 1.5x indicates sustained interest.
Conviction Levels:
- EXTREME: Score > 15 (large whale emoji labels, highest confidence)
- HIGH: Score > 8 (triangle signals, strong confidence)
- MEDIUM: Score > 3 (small triangles, moderate confidence)
- LOW: Score < 3 (not plotted to reduce noise)
3. Cumulative Flow Analysis:
Rather than treating each whale move in isolation, the indicator tracks cumulative flow using an EMA of whale activity. This reveals persistent directional pressure.
Flow Calculation: Each whale bar contributes (whale_strength × direction) to the flow. Strength is volume_ratio × price_impact_percent.
Flow Momentum: Rate of change in the cumulative flow (5-bar change)
Flow Acceleration: Second derivative (3-bar change of momentum)
These metrics reveal whether whale activity is accelerating, decelerating, or reversing.
4. Market Regime Detection:
Bullish Regime: Cumulative flow > 2 AND momentum positive
Bearish Regime: Cumulative flow < -2 AND momentum negative
Sideways Regime: Neither condition met
The background color reflects the current regime, helping traders understand the broader context.
5. Flow Strength Meter:
The main plot normalizes cumulative flow to a -100 to +100 scale based on the 100-bar range. This provides a consistent visual reference regardless of the asset or timeframe.
Extreme levels at ±50 indicate particularly strong directional flow where reversals or consolidation become more likely.
HOW TO USE IT
Settings Configuration:
Whale Detection Section:
- Volume Average Period (default 50): Shorter periods make detection more sensitive to recent volume changes. Longer periods require more exceptional volume to trigger.
- Whale Volume Multiplier (default 1.5): How much above average volume must be to qualify. Lower = more signals. Higher = only extreme moves.
- Minimum Price Impact (default 0.1%): Filters out high-volume bars that didn't actually move price. Adjust based on asset volatility.
Trend Analysis:
- Trend Strength Period (default 20): EMA period for trend alignment bonus
- Confirmation Bars (default 3): How many bars to check for follow-through
Visual Settings:
- Flow Strength Meter: Main plot showing normalized cumulative flow
- Conviction Labels: Detailed labels showing volume ratio and price impact on extreme/high conviction whales
- Trend Background: Color-coded regime indication
Signal Interpretation:
EXTREME Conviction (Whale Emoji Labels):
These are the highest confidence signals. Large volume with significant price impact, aligned with trend, showing follow-through. These often mark the beginning or continuation of strong moves.
HIGH Conviction (Large Triangles):
Strong signals meeting most criteria. Good for main entries or adding to positions.
MEDIUM Conviction (Small Triangles):
Whale activity present but with fewer confirmation factors. Use for partial positions or require additional confirmation.
Flow Strength Meter:
- Above zero and rising: Bullish flow building
- Below zero and falling: Bearish flow building
- Approaching ±50: Extreme readings, watch for exhaustion
- Crossing zero: Flow regime change
Dashboard Information:
The top-right table shows:
- Current regime (bullish/bearish/sideways)
- Flow strength value
- Last whale direction
- Conviction level of last whale
- Current volume ratio
- Flow momentum direction
- Indicator status
Trading Strategies:
Trend Following: Take EXTREME and HIGH conviction signals aligned with the flow meter direction. Enter when flow is positive and rising for bullish whales, negative and falling for bearish whales.
Regime-Based: Only trade in bullish/bearish regimes (colored backgrounds). Avoid trading in sideways regimes where whale moves tend to reverse quickly.
Flow Reversals: When flow meter crosses zero with EXTREME conviction whale in the new direction, this often marks regime changes.
Exhaustion Plays: When flow reaches ±50 extreme levels, watch for EXTREME conviction whales in the opposite direction as potential reversal signals.
TECHNICAL DETAILS
Volume Ratio = Current Volume / SMA(Volume, Period)
Price Impact % = ABS(Close - Open) / Open × 100
Whale Detected = (Volume Ratio >= Multiplier) AND (Price Impact >= Minimum)
Whale Direction = Close > Open ? 1 : -1
Base Conviction = (Volume Ratio × Price Impact %) / 10
Trend Alignment = Whale Direction == Trend Direction ? 1.5 : 1.0
Follow-Through = Price continues whale direction over N bars ? 1.3 : 1.0
Volume Persistence = SMA(Volume Ratio, 3) > 1.5 ? 1.2 : 1.0
Final Conviction = Base × Trend Alignment × Follow-Through × Volume Persistence
Whale Flow = Whale Detected ? (Volume Ratio × Price Impact × Direction) : 0
Cumulative Flow = EMA(Whale Flow, 20)
Flow Momentum = Change(Cumulative Flow, 5)
Flow Acceleration = Change(Momentum, 3)
Normalized Flow Strength = (Cumulative Flow / Highest(ABS(Cumulative Flow), 100)) × 100
WHAT THIS SOLVES
Common Volume Indicator Problems:
- Volume spikes that don't move price (consolidation noise)
- Price moves on low volume that quickly reverse
- No differentiation between strong and weak volume signals
- Treating all high-volume bars equally regardless of context
- No measure of whether volume represents conviction or panic
Whale Flow Solutions:
- Requires both volume AND price impact for signals
- Conviction scoring separates strong moves from weak ones
- Cumulative flow shows persistent pressure vs isolated spikes
- Trend alignment and follow-through filter low-quality signals
- Tiered system lets traders choose their confidence threshold
LIMITATIONS
- Cannot identify individual whales or attribute volume to specific entities
- High volume can come from many sources (whales, retail panic, algo activity)
- Works best on liquid assets with consistent volume patterns
- Less reliable on low-volume assets or during market closures
- Conviction scoring thresholds may need adjustment per asset/timeframe
- Does not predict future whale activity, only identifies it after bars close
- Flow can remain at extremes longer than expected during strong trends
- False signals can occur during news events or earnings
- Not a standalone trading system - requires risk management and other analysis
Best used in combination with price action, support/resistance, and broader market context.
EDUCATIONAL VALUE
For traders learning about:
- Volume analysis beyond simple volume indicators
- Multi-factor signal confirmation systems
- Market regime and flow concepts
- Conviction-based scoring methodologies
- Cumulative indicator design
- Normalized plotting for cross-asset comparison
- Pine Script table and dashboard creation
Not financial advice.

XAUUSD Scalper-AbsoluteTesting for first time, indicator with an idea to get the volitality. first time will be bad but let us see with time

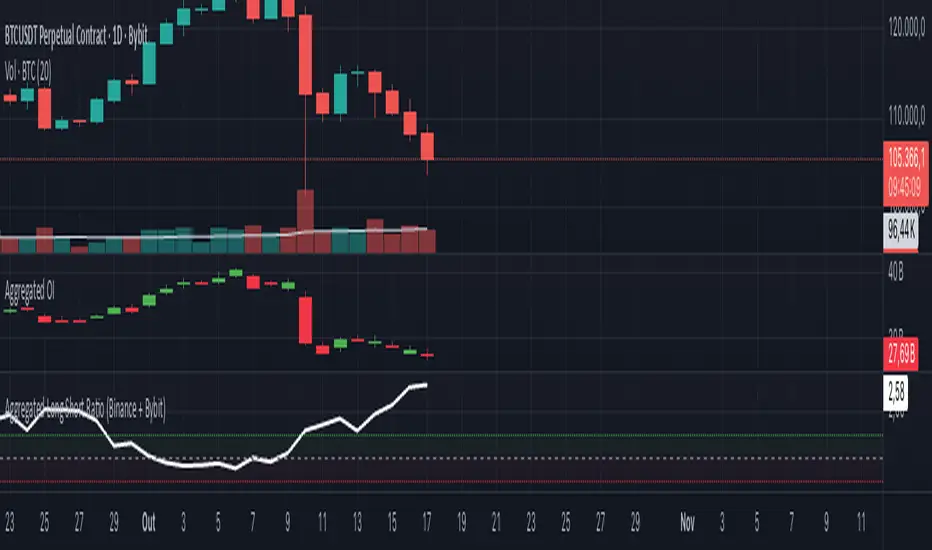
Aggregated Long Short Ratio (Binance + Bybit)This indicator displays the Long/Short Ratio (LSR) from Binance and Bybit exchanges, plus an aggregated average. LSR shows the ratio between traders holding long positions vs short positions.
Settings AvailableExchanges Group:
☑️Show Binance - Display Binance LSR line
☑️ Show Bybit - Display Bybit LSR line
☑️ Show Aggregated LSR - Display combined average
Timeframe - Choose data timeframe (leave empty for chart timeframe)
Visualization Group:
🎨 Binance Color - Default: Yellow
🎨 Bybit Color - Default: Orange
🎨 Aggregated Color - Default: White
📖 How to Read the Indicator
⚠️ CRITICAL: Always analyze LSR together with Open Interest (OI)
Key Levels:
LSR = 1.0 (gray dashed line) = Balance - Equal longs and shorts
LSR > 1.0 = More longs than shorts (bullish sentiment)
LSR < 1.0 = More shorts than longs (bearish sentiment)
Extreme Zones:
LSR > 1.5 (green zone) = Very bullish - Possible market top
LSR < 0.5 (red zone) = Very bearish - Possible market bottom
Why Open Interest Matters:
LSR alone doesn't tell the full story. You MUST check Open Interest:
Rising OI + High LSR (>1.5) = New longs opening → Strong momentum OR potential trap
Rising OI + Low LSR (<0.5) = New shorts opening → Strong momentum OR potential trap
Falling OI + Extreme LSR = Positions closing → Weak signal, avoid trading
Stable OI + Extreme LSR = No new positions → Less reliable signal
💡 Trading Interpretation
⚠️ ALWAYS combine LSR with Open Interest analysis!
Contrarian Strategy (High Leverage Zones):
High LSR (>1.5) + Rising OI → Many new longs → Potential short squeeze OR reversal down
Low LSR (<0.5) + Rising OI → Many new shorts → Potential long squeeze OR reversal up
Trend Confirmation:
Rising LSR + Rising price + Rising OI = Strong bullish trend with new positions
Falling LSR + Falling price + Rising OI = Strong bearish trend with new positions
Weak Signals (Avoid):
Extreme LSR + Falling OI = Positions closing → Low conviction
Extreme LSR + Stable OI = No new money → Wait for confirmation
Divergences:
Price higher highs but LSR falling + Rising OI = Bearish divergence (shorts accumulating)
Price lower lows but LSR rising + Rising OI = Bullish divergence (longs accumulating)
Best Setups:
Reversal: Extreme LSR (>1.5 or <0.5) + Rising OI + Price rejection
Trend: LSR trending with price + Steadily rising OI
Caution: Extreme LSR + Falling OI = Ignore signal
Built-in Alerts
The indicator includes 4 preset alerts:
LSR Crossed Above 1.0 - Market turned bullish
LSR Crossed Below 1.0 - Market turned bearish
LSR Very High - Above 1.5 (possible top)
LSR Very Low - Below 0.5 (possible bottom)
To Set Up Alerts:
Click the "..." on the indicator
Select "Add Alert"
Choose the condition you want
Configure notification method
Best Practices
MANDATORY: Always add Open Interest indicator to your chart alongside LSR
To add OI: Click Indicators → Search "Open Interest" → Add official TradingView OI
Use on perpetual futures charts (symbols ending in .P)
Works best on USDT pairs (BTCUSDT, ETHUSDT, etc.)
Combine LSR + OI + price action + support/resistance levels
Higher timeframes (4h, 1D) give more reliable signals
Don't trade LSR extremes without confirming OI direction
Golden Rule: Rising OI = Strong signal | Falling OI = Weak signal
⚠️ Important Notes
Indicator requires TradingView Premium or above (uses Request library)
Only works on crypto perpetual futures
Data availability depends on exchange API
NA values mean data is not available for that exchange/symbol
Never use LSR without Open Interest context
Open Interest + Continuation/Discontinuation Patterns📈 Open Interest + Continuation/Discontinuation Patterns
This indicator analyzes Open Interest data to detect four key convergence/divergence patterns that signal potential trend continuation or reversal:
Buyer Continuation
Seller Continuation
Buyer Discontinuation
Seller Discontinuation
Each pattern is identified by comparing price action with Open Interest behavior, using pivot-based logic and ATR filtering for precision. When a valid pattern is detected, the indicator draws visual lines on the chart and triggers custom alert conditions for each type, enabling timely decision-making.
The Open Interest data is plotted as a candle-style oscillator, offering a clear view of momentum shifts. The detection logic is fully configurable, allowing users to adjust pivot sensitivity, lookback ranges, and ATR filters to suit different market conditions.
Key features:
🔍 Detects continuation and discontinuation patterns via convergence/divergence logic
🔔 Alerts for all four pattern types
🕯️ Candle-style visualization of Open Interest
⚙️ ATR-based filtering and pivot customization
Perfect for traders seeking to enhance their market timing using Open Interest dynamics and divergence-based signals.

Delta Volume ReversalThis script displays Delta Volume-based reversal arrows by analyzing buying vs. selling volume from a lower timeframe. An up arrow appears when a red candle closes with dominant buying volume (bullish delta), while a down arrow appears on green candles with dominant selling volume (bearish delta). This highlights potential hidden strength or weakness in price action.
Credits:
Original from Delta Volume by SiddWolf — adapted and enhanced with reversal arrow visualization.

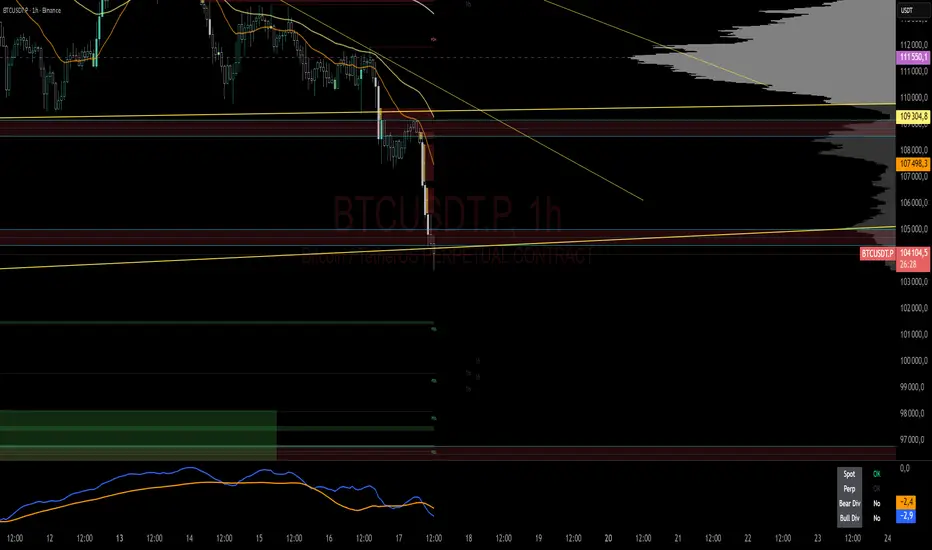
BTC — CVD Divergence (Spot & Perp, robuste v6)If the price is above the CVD, it usually means the move is being pushed by leverage rather than real buying — the market is stretched and at risk of a correction.
If the price is below the CVD, it suggests that buyers are quietly absorbing — pressure is building for a bullish recovery once leverage clears out.