EMA50/200 — Nth Close After Break (Up/Down/Both)This indicator tracks EMA-based momentum confirmation using a customizable N-bar rule.
🧠 Logic:
- You can choose whether to track EMA 50 or EMA 200.
- When the price breaks above (or below) the selected EMA, the indicator starts counting.
- If the price stays on that side of the EMA for N consecutive closes, a single signal is triggered on the Nth bar.
- After signaling, the counter resets — the next signal appears only after a new EMA break.
⚙️ Parameters:
- Target EMA: Choose which EMA (50 or 200) the logic is based on.
- N: Number of consecutive bars required after a break.
- Direction: Up / Down / Both.
- Optional trend filters: Require EMA50 > EMA200 for Up signals, or EMA50 < EMA200 for Down signals.
- Blue ▲ = Bullish signal (Nth close after breaking above EMA)
- Red ▼ = Bearish signal (Nth close after breaking below EMA)
✅ Ideal for identifying strong trend confirmations and filtering out false EMA breakouts.
Candlestick analysis

Multi-Timeframe FVG Detector v2 STEWNewest FVG with alerts and ability to show current TimeFrame Viewed

Volume Quintiles - 10 Trading Days, Time-of-Day Awarethis logging in the last 20 trading days in the same time.

指定周期 MACustom Timeframe Moving Average (MA)
This indicator allows you to display a Moving Average from a higher or custom timeframe directly on your current chart.
📌 Features:
Choose any custom timeframe (e.g. 1H, 4H, 1D)
Supports multiple MA lengths (e.g. 20, 40, 60…)
Helps identify trend direction and key dynamic support/resistance
Ideal for multi-timeframe trading strategies
💡 Usage Example:
View 1H MA on a 5-minute chart for stronger trend confirmation
Use longer period MA as trend filter, shorter MA for entry signals
🚀 A great tool for swing traders, scalpers, and day traders who rely on multi-timeframe confluence.

HammerThis indicator automatically detects powerful candlestick formations such as Hammer, Inverted Hammer, Bullish Engulfing, Hanging Man, Shooting Star, and Bearish Engulfing.
It visually marks potential reversal zones on the chart and provides instant Long / Short alerts.
By combining pattern recognition with swing levels, it helps you identify possible trend reversals more clearly.
A simple, fast, and price-action-focused tool for smarter trading decisions.
💡 Yellow dotted lines indicate possible reaction zones around swing points.
Pro Trading Signals - Trend + S/R + Risk// ============================================
// PROFESSIONAL TRADING STRATEGY NOTES
// ============================================
// === WHAT THIS STRATEGY DOES ===
// 1. TREND ANALYSIS: Uses multiple EMAs (9, 21, 50, 200) to identify trend direction
// 2. SUPPORT/RESISTANCE: Automatically detects key price levels
// 3. RISK MANAGEMENT: Calculates stop loss and take profit with 2:1+ R:R ratio
// 4. SIGNAL SCORING: Only trades high-quality setups (60/100+ score)
// 5. ENTRY TYPES: Pullbacks, support/resistance bounces, breakouts
// === KEY IMPROVEMENTS FROM BASIC SIGNALS ===
// ✓ Trend alignment required (no counter-trend trades)
// ✓ Support/resistance confirmation
// ✓ Volume and momentum filters
// ✓ Automatic stop loss and take profit levels
// ✓ Signal quality scoring (filters out weak signals)
// ✓ Risk:Reward ratio enforcement (minimum 2:1)
// ✓ Volatility filter (avoids choppy markets)


Qullamaggie 8EMA/21EMA/50EMA//Exponantial Moving Average - 8
//Exponantial Moving Average - 21
//Simple Moving Average - 50

Weekly Breakout Screenermencari harga saham yang kuat breakout harga mingguan. potensi swing trading

4h Top & BottomDraws a line at the top of the first 4h candle as well as the bottom. Colors the background green for possible long entries after reclaiming the bottom and red for short entries after rejecting the top.
VNREAL-ExVG (ex VHM, VRE, IDC) — rebased=100 — no-arraysVNREAL-ExVG (ex VHM, VRE, IDC) — rebased=100 — no-arrays

BOS INDICATOR )Good for breaking structures. tells you where a break in structure occurs by outlining the break in structure in a red or green candle

Confluence Zone BuilderWhat It Does
The Confluence Zone Builder is a technical analysis indicator that identifies high-probability price levels by detecting where multiple technical factors align (converge) at the same price area. These "confluence zones" represent levels where price is statistically more likely to react - either bouncing (support/resistance) or breaking through (breakout targets).
How It Works
1. Multi-Factor Analysis
The indicator calculates key technical levels from various sources:
Fibonacci Retracements (23.6%, 38.2%, 50%, 61.8%, 78.6%) - Support/resistance levels based on recent price swings
Fibonacci Extensions (127.2%, 141.4%, 161.8%, 200%, 261.8%) - Breakout targets beyond the current range (both bullish and bearish)
Pivot Points (Classic pivots: P, R1-R3, S1-S3) - Daily/weekly reference points traders watch
Moving Averages (EMA 20, 50 and SMA 100, 200) - Dynamic support/resistance that institutions track
VWAP - Volume-weighted average price, popular among institutional traders
Psychological Levels - Round numbers that attract orders
Previous Period Levels - Prior day/week high, low, and close
2. Proximity Clustering
When multiple factors fall within a defined proximity range (default 0.5%), they're grouped together into a single "confluence zone." This prevents cluttering the chart with dozens of individual lines.
3. Weighted Scoring System
Not all technical factors are equal. The indicator assigns importance weights:
Key Fibonacci levels (61.8%) and major MAs (200, 50) get higher weights (2.0-2.5x)
Pivot points and VWAP get medium weights (1.5x)
Minor factors get lower weights (1.0x)
The total score reflects both the number of factors and their importance.
4. Historical Validation
The indicator analyzes the last 50 bars (customizable) to track:
Touches: How many times price reached each zone
Rejections: Times price bounced off the zone (✅)
Breaks: Times price broke through the zone (❌)
Win Rate: Percentage of times the zone held (rejections ÷ touches)
5. Dynamic Adjustment
Zones aren't static - they adapt based on how price interacts with them:
Strengthens (+0.5 per rejection, +0.2 per touch): Zones that repeatedly hold become more important
Weakens (-0.8 per break): Zones that fail to hold lose credibility
Visual Indicators:
Thick solid lines = Strong zones (more rejections than breaks)
Dashed lines = Weak zones (more breaks than rejections)
Color-coded by score: Blue (low), Yellow (medium), Red (high)
What You Gain From Using It
For Support/Resistance Trading:
High-probability entries: Enter at zones with high confluence scores and strong historical win rates
Better risk management: Place stops beyond strong confluence zones that are likely to hold
Reduced false signals: Multi-factor confirmation reduces reliance on single indicators
For Breakout Trading:
Target identification: Fibonacci extensions provide profit targets beyond current ranges
Breakout confirmation: Weak zones (dashed lines, low win rates) are easier to break - ideal for breakout entries
False breakout avoidance: Strong zones (thick lines, high win rates) require more confirmation before entering
For Position Management:
Exit planning: Take profits at high-confluence zones ahead
Stop placement: Use strong zones as logical stop-loss levels
Trade filtering: Higher probability setups occur at stronger zones
Key Advantages:
Objective confluence detection - No manual line drawing needed
Data-driven validation - Historical performance shows which zones actually matter
Adaptive intelligence - Zones strengthen/weaken based on real price action
Clean visualization - Top zones only, with compact labels showing score and factors
Customizable - Adjust weights, components, and thresholds to your trading style
Bottom Line:
Instead of guessing which technical level matters most, this indicator does the heavy lifting - analyzing multiple factors, validating them historically, and highlighting only the zones where price is most likely to react. It's like having confluence analysis automated with statistical backing.

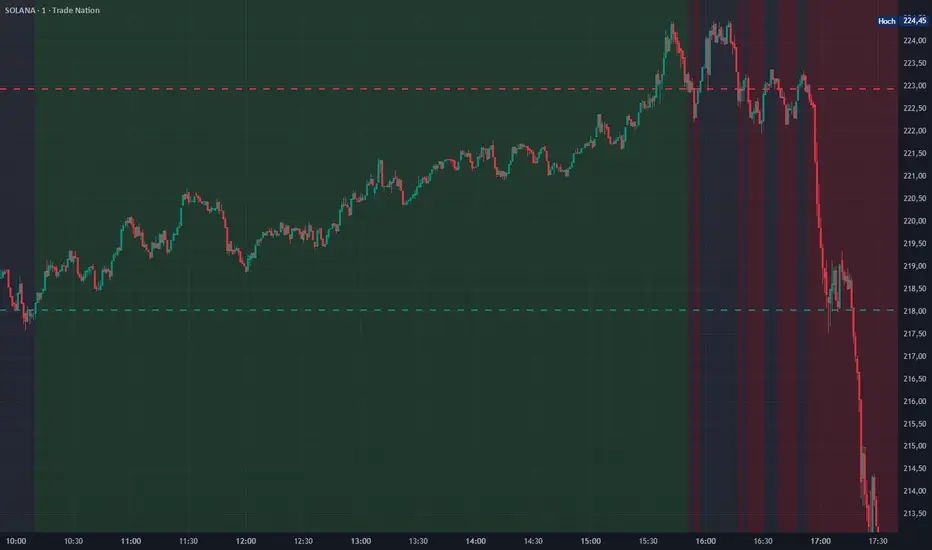
ShockDrop Alerts v1⚡ ShockDrop Alerts — Rapid Drop & Drawdown Detector
ShockDrop Alerts helps you react instantly to sudden market shocks.
It tracks both fast price drops and intraday drawdowns, plotting clean visual arrows and sending alerts when volatility spikes — so you can respond before small dips turn into major moves.
⚙️ How It Works
• Fast Drop (FAST) – detects sharp declines (e.g. 2 % in 4 minutes) using 1-minute data across any timeframe.
• Drawdown (DD) – triggers when price trades a set percentage below the day’s session high (e.g. 2 %).
Each alert type has its own independent cooldown timer and can be toggled on or off.
🎯 What You’ll See
• FAST → 🔴 red arrow above the bar (rapid drop detection)
• DD → 🟠 orange arrow below the bar (intraday drawdown)
These appear only when your defined conditions are met. Connect them to TradingView alerts for instant popup, email, mobile, or webhook notifications.
🧭 Key Features
• Detects high-velocity price shocks in real time
• Separate cooldowns for FAST and DD triggers
• Extended-hours toggle to include pre/post-market data
• Clean, clutter-free visuals — only actionable arrows
• Uses 1-minute precision data, works on any symbol or timeframe
• Supports server-side alerts (TradingView Pro +)
📬 Why Traders Use It
• Get early warnings during flash crashes or liquidity spikes
• Automate risk-based exits when markets accelerate downward
• Track SPY, QQQ, crypto, or futures for rapid reversals
• Stay alert to high-impact news events — such as surprise policy comments, earnings releases, or market-moving presidential posts — that can cause sudden volatility
Requires TradingView Pro + for continuous server-side alerting.