(5+15+60min+1D)EMA20+Y'SH/L+count简介: 这是一个专为 5分钟图表 (5min Chart) 日内交易者设计的综合辅助工具。它结合了多周期趋势均线、美股核心交易时段的时间周期计数以及关键流动性位置(前一日高低点)的智能突破监测。该脚本针对美股个股及 24/7 交易的 BTC/ETH 进行了优化,强制锁定纽约时间进行运算。
核心功能:
1. 多周期 EMA 监控系统 (MTF EMAs)
5min EMA20 (蓝色):日内短期趋势核心线(默认开启)。
60min EMA20 (绿色):小时级别趋势参考(默认开启)。
15min EMA20 (红色) & 1D EMA20 (橙色):可选开启,用于捕捉更大周期的支撑阻力。
特点:所有均线采用最细线宽,平滑显示,右上角表格实时展示当前价格。
2. 美股时段 Bar Count 计数器
时间锚定:以纽约时间 (New York Time) 09:30 开盘为起点(Bar 0)。
显示规则:仅在 K 线底部显示 偶数 序号 (0, 2, 4, 6 ...),直至第 82 根 K 线停止。
关键时间窗 (Time Pivots):
Bar 18 (约 NY 10:55) 和 Bar 40 (约 NY 12:45) 会被自动高亮。
字体变为 蓝色粗体,且对应 K 线实体变为蓝色,提示潜在的变盘或宏观流动性注入时刻。
3. 智能 PDH/PDL 射线 (Smart Rays)
精确锚点:前一日高点 (PDH) 和低点 (PDL) 的射线不是从开盘画起,而是从昨日形成高低点的具体时间点射出,精确还原价格行为。
自动阻断 (Breakout Logic):一旦当前价格触碰或突破该射线,射线将自动停止延伸,直观展示“阻力/支撑已失效”。
自动清理:每日自动清除旧线,仅保留当天的参考线,保持图表整洁。
4. 视觉优化
每日分割线:自动绘制灰色虚线分隔交易日。
图表限制:脚本仅在 5分钟图表上可见,切换周期自动隐藏,避免干扰大周期分析。
设置说明:
可在设置面板中自由开关各周期 EMA 的显示。
可开关底部的计数数字显示。
English Version (for TradingView Publishing)
Title: 5min Intraday Precision Toolkit: MTF EMAs + NY Session Count + Smart Rays
Introduction: This is a comprehensive auxiliary tool designed specifically for 5-minute chart intraday traders. It combines multi-timeframe trend EMAs, time cycle counting based on the US Session, and smart breakout monitoring for key liquidity levels (Previous Day High/Low). Optimized for US Equities and Crypto (BTC/ETH) using New York Time.
Key Features:
1. Multi-Timeframe EMA System
5min EMA20 (Blue): Core short-term intraday trend (On by default).
60min EMA20 (Green): Hourly trend reference (On by default).
15min EMA20 (Red) & 1D EMA20 (Orange): Optional overlays for higher timeframe support/resistance.
Visuals: All EMAs are rendered with fine lines for a clean look, accompanied by a top-right dashboard table.
2. NY Session Bar Count
Time Anchor: Starts counting from 09:30 New York Time (Bar 0).
Display Logic: Displays only EVEN numbers (0, 2, 4...) at the bottom of the bars, stopping at count 82.
Time Pivots:
Bar 18 (~10:55 NY) and Bar 40 (~12:45 NY) are highlighted.
Labels turn Bold Blue, and the specific candles are colored Blue to indicate potential reversal or liquidity injection times.
3. Smart PDH/PDL Rays
Precise Origin: Rays for Previous Day High (PDH) and Previous Day Low (PDL) originate from the exact timestamp they were created yesterday, not just the daily open.
Breakout Stop Logic: Rays automatically stop extending once price touches or breaks them, clearly indicating that the level has been tested.
Auto-Clean: Automatically removes old rays from previous days to keep the chart clean.
4. Visual Optimization
Daily Separators: Automatic vertical dotted lines marking new days.
Visibility: All elements are hidden on non-5m charts to prevent clutter.
Settings:
Toggle visibility for individual EMAs.
Toggle visibility for the bottom bar counter.
Candlestick analysis

Continuation Model by XausThis report summarizes the historical performance of the Institutional Daily Bias Probability Model on
EURUSD daily data for the 2025 calendar year. The model combines three components: 1.
Continuation bias around the previous day's high/low (PDH/PDL). 2. Reversal bias based on failed
continuation, failed breakouts, and exhaustion. 3. Neutral bias to identify liquidity-building days when no
directional trades should be taken. A fixed 25-pip stop loss (0.0025) is assumed for R-multiple
calculations. Trades are only taken when Neutral score < 50 and either Continuation or Reversal score
is at least 70, with Neutral overriding, then Reversal, then Continuation.

Exhaustion IndicatorThe ScalpSQZ indicator is designed to identify four critical market states using volatility structure, momentum behavior, and exhaustion conditions. It enhances scalping precision by visually marking transitions between consolidation, squeeze conditions, and momentum reversals through color-coded candles.
1. Squeeze Conditions (Orange Candles)
Orange candles highlight volatility compression, detected when Bollinger Bands contract inside the Keltner Channels. This structure signals that market volatility is tightening and a significant expansion move is likely to follow. The squeeze represents a pre-breakout environment and serves as the earliest warning of a potential directional shift.
2. Consolidation Conditions (Yellow Candles)
Yellow candles identify phases of low directional momentum. These conditions occur when RSI remains near neutral values, MACD histogram activity is minimal, and the Rate of Change stays muted. This combination indicates that the market is balanced and non-trending, often preceding a volatility spike or a new trend. Consolidation helps traders avoid low-probability entries during indecisive price action.
3. Momentum Exhaustion — Overbought Fade (White Candles)
White candles signal potential top-side exhaustion. This occurs when RSI enters overbought territory while the MACD histogram begins to weaken compared to the previous bar. This condition does not necessarily call a reversal but warns that bullish momentum is deteriorating and upside continuation may be limited. It is particularly useful for identifying trend fatigue and tightening stop-loss placement.
4. Momentum Exhaustion — Oversold Fade (Purple Candles)
Purple candles identify bottom-side exhaustion and appear when RSI reaches oversold levels, MACD momentum begins improving, and the current close shows buyer defense relative to the previous low. This condition suggests selling pressure is diminishing and a potential reversal or relief bounce may be forming. Purple candles serve as an early indication of bearish trend exhaustion.
Color Priority System
The indicator follows a fixed hierarchy to ensure clarity:
Squeeze (orange) has the highest priority, followed by consolidation (yellow). Exhaustion signals (white for tops, purple for bottoms) apply only when no squeeze or consolidation conditions are active. This structure ensures that the most critical market states are always highlighted first.
Purpose and Application
ScalpSQZ helps traders identify optimal environments for breakouts, anticipate trend exhaustion, and avoid low-quality trades during choppy or low-momentum conditions. It is suitable for scalping, day trading, and swing trading across any asset class or timeframe.

Smart Scalper V7 [Churn Filter]Indicator uses relative volume by time as well as ADX to highlight if volume is high to prevent trading in chop or being faked out.
Dec 1
Release Notes
How to Read the "Traffic Light" 🚦
You asked: "How do I work out if volume is higher or lower?" Look at the White Horizontal Line running across the indicator.
Height (Quantity):
Above the Line: Volume is High (The crowd is here).
Below the Line: Volume is Low (Everyone is at lunch).
Color (Quality):
🟢 Green: High Volume + Strong Trend. (Best for Entries).
🟡 Yellow: High Volume but NO Trend. This is usually a Reversal or a Trap. (Big fight, no winner yet).
🟠 Orange: Trending, but on Low Volume. The price is drifting. Don't trust it—it can snap back easily.
🔴 Red: Low Volume, No Trend. The "Kill Zone." Do not trade.

Fair Value Gap Signals [Kodexius]Fair Value Gap Signals is an advanced market structure tool that automatically detects and tracks Fair Value Gaps (FVGs), evaluates the quality of each gap, and highlights high value reaction zones with visual metrics and signal markers.
The script is designed for traders who focus on liquidity concepts, order flow and mean reversion. It goes beyond basic FVG plotting by continuously monitoring how price interacts with each gap and by quantifying three key aspects of each zone:
-Entry velocity inside the gap
-Volume absorption during tests
-Structural integrity and depth of penetration
The result is a dynamic, information rich visualization of which gaps are being respected, which are being absorbed, and where potential reversals or continuations are most likely to occur.
All visual elements are configurable, including the maximum number of visible gaps per direction, mitigation method (close or wick) and an ATR based filter to ignore insignificant gaps in low volatility environments.
🔹 Features
🔸 Automated Fair Value Gap Detection
The script detects both bullish and bearish FVGs based on classic three candle logic:
Bullish FVG: current low is strictly above the high from two bars ago
Bearish FVG: current high is strictly below the low from two bars ago
🔸 ATR Based Gap Filter
To avoid clutter and low quality signals, the script can ignore very small gaps using an ATR based filter.
🔸Per Gap State Machine and Lifecycle
Each gap is tracked with an internal status:
Fresh: gap has just formed and has not been tested
Testing: price is currently trading inside the gap
Tested: gap was tested and left, waiting for a potential new test
Rejected: price entered the gap and then rejected away from it
Filled: gap is considered fully mitigated and no longer active
This state machine allows the script to distinguish between simple touches, multiple tests and meaningful reversals, and to trigger different alerts accordingly.
🔸 Visual Ranking of Gaps by Metrics
For each active gap, three additional horizontal rank bars are drawn on top of the gap area:
Rank 1 (Vel): maximum entry velocity inside the gap
Rank 2 (Vol): relative test volume compared to average volume
Rank 3 (Dpt): remaining safety of the gap based on maximum penetration depth
These rank bars extend horizontally from the creation bar, and their length is a visual score between 0 and 1, scaled to the age of the gap. Longer bars represent stronger or more favorable conditions.
🔸Signals and Rejection Markers
When a gap shows signs of rejection (price enters the gap and then closes away from it with sufficient activity), the script can print a signal label at the reaction point. These markers summarize the internal metrics of the gap using a tooltip:
-Velocity percentage
-Volume percentage
-Safety score
-Number of tests
🔸 Flexible Mitigation Logic (Close or Wick)
You can choose how mitigation is defined via the Mitigation Method input:
Close: the gap is considered filled only when the closing price crosses the gap boundary
Wick: a full fill is detected as soon as any wick crosses the gap boundary
🔸 Alert Conditions
-New FVG formed
-Price entering a gap (testing)
-Gap fully filled and invalidated
-Rejection signal generated
🔹Calculations
This section summarizes the main calculations used under the hood. Only the core logic is covered.
1. ATR Filter and Gap Size
The script uses a configurable ATR length to filter out small gaps. First the ATR is computed:
float atrVal = ta.atr(atrLength)
Gap size for both directions is then measured:
float gapSizeBull = low - high
float gapSizeBear = low - high
If useAtrFilter is enabled, gaps smaller than atrVal are ignored. This ties the minimum gap size to the current volatility regime.
2. Fair Value Gap Detection
The basic FVG conditions use a three bar structure:
bool fvgBull = low > high
bool fvgBear = high < low
For bullish gaps the script stores:
-top as low of the current bar
-bottom as high
For bearish gaps:
-top as high of the current bar
-bottom as low
This defines the price range that is considered the imbalance area.
3. Depth and Safety Score
Depth measures how far price has penetrated into the gap since its creation. For each bar, the script computes a currentDepth and updates the maximum depth:
float currentDepth = 0.0
if g.isBullish
if l < g.top
currentDepth := g.top - l
else
if h > g.bottom
currentDepth := h - g.bottom
if currentDepth > g.maxDepth
g.maxDepth := currentDepth
The safety score expresses how much of the gap remains intact:
float depthRatio = g.maxDepth / gapSize
float safetyScore = math.max(0.0, 1.0 - depthRatio)
safetyScore near 1: gap is mostly untouched
safetyScore near 0: gap is mostly or fully filled
4. Velocity Metric
Velocity captures how aggressively price moves inside the gap. It is based on the body to range ratio of each bar that trades within the gap and rewards bars that move in the same direction as the gap:
float barRange = h - l
float bodyRatio = math.abs(close - open) / barRange
float directionBonus = 0.0
if g.isBullish and close > open
directionBonus := 0.2
else if not g.isBullish and close < open
directionBonus := 0.2
float currentVelocity = math.min(bodyRatio + directionBonus, 1.0)
The gap keeps track of the strongest observed value:
if currentVelocity > g.maxVelocity
g.maxVelocity := currentVelocity
This maximum is later used as velScore when building the velocity rank bar.
5. Volume Accumulation and Volume Score
While price is trading inside a gap, the script accumulates the traded volume:
if isInside
g.testVolume += volume
It also keeps track of the number of tests and the volume at the start of the first test:
if g.status == "Fresh"
g.status := "Testing"
g.testCount := 1
g.testStartVolume := volume
An average volume is computed using a 20 period SMA:
float volAvg = ta.sma(volume, 20)
The expected volume is approximated as:
float expectedVol = volAvg * math.max(1, (bar_index - g.index) / 2)
The volume score is then:
float volScore = math.min(g.testVolume / expectedVol, 1.0)
This produces a normalized 0 to 1 metric that shows whether the gap has attracted more or less volume than expected over its lifetime.
6. Rank Bar Scaling
All three scores are projected visually along the time axis as horizontal bars. The script uses the age of the gap in bars as the maximum width:
float maxWidth = math.max(bar_index - g.index, 1)
Then each metric is mapped to a bar length:
int len1 = int(math.max(1, maxWidth * velScore))
g.rankBox1.set_right(g.index + len1)
int len2 = int(math.max(1, maxWidth * volScore))
g.rankBox2.set_right(g.index + len2)
int len3 = int(math.max(1, maxWidth * safetyScore))
g.rankBox3.set_right(g.index + len3)
This creates an intuitive visual representation where stronger metrics produce longer rank bars, making it easy to quickly compare the relative quality of multiple FVGs on the chart.

Linechart + Wicks - by SupersonicFXThis is a simple indicator that shows the highs and lows (wicks) on the linechart.
You can vary the colors.
Nothing more to say.
Hope some of you find it useful.

Cloud Matrix [CongTrader]🚀 Cloud Matrix — Advanced Multi-Layer Ichimoku System
Cloud Matrix is an enhanced trend-analysis system built on the public-domain Ichimoku Kinko Hyo methodology.
This indicator delivers a multi-dimensional view of trend, momentum, and market structure, allowing traders to evaluate market conditions at a glance.
Cloud Matrix is not a simple Ichimoku clone. It introduces advanced confirmation logic, multi-timeframe trend filtering, and a modern visual framework designed for today’s dynamic markets.
🔥 Key Features & Highlights
1️⃣ Smart Preset Engine (4 Modes)
Choose from optimized presets for different markets and volatility levels:
Traditional 9/26/52
Crypto Fast 10/30/60
Crypto Medium 20/60/120
Custom Mode
→ Fast, adaptable, and beginner-friendly.
2️⃣ Advanced Trend Confirmation Engine
Cloud Matrix uses a 5-factor scoring system to filter high-quality signals:
Tenkan vs Kijun
Price vs Cloud
Cloud Twist
Chikou Position
Close vs Kijun
A bullish/bearish signal only triggers when multiple Ichimoku conditions align, reducing noise dramatically.
3️⃣ Higher-Timeframe EMA200 Filter
One of the signature strengths of Cloud Matrix:
EMA200 from a higher timeframe
Helps you follow the dominant macro trend
Avoids counter-trend traps
Ideal for swing and position traders
4️⃣ Intelligent Auto Signals
The indicator includes refined and clean signals for:
Bullish / Bearish TK Cross
Bullish / Bearish Kumo Breakout
All signals support:
Labels
Alerts
“Alert on Close” mode to avoid repaint-related confusion
5️⃣ Enhanced Kumo Cloud Visualization
Adjustable opacity (strong / soft)
Clear bullish/bearish cloud shading
Improved readability on fast markets
6️⃣ Real-Time Market State Dashboard
A compact dashboard shows all key Ichimoku conditions:
Price vs Cloud
Cloud Twist (Bullish/Bearish)
Tenkan–Kijun Relationship
Chikou Status
HTF EMA Trend
Active Preset
→ Designed for instant market diagnostics.
🎯 How Traders Use Cloud Matrix
Perfect for:
Trend following
Swing trading
Crypto, Stocks, Forex
Early breakout detection
Filtering low-quality setups
📌 Suggested Usage
Bullish Bias When:
Price is above the Cloud
Cloud Twist is bullish
Tenkan crosses above Kijun
Chikou is above price
HTF EMA200 is bullish
Bearish Bias When:
Opposite conditions apply.
⚠️ Important Note
This indicator is for analysis and educational purposes only.
It does not provide financial advice or guaranteed trading results.
Ichimoku concepts belong to the public domain; this is a modernized expansion built for study and research.
✍️ Author
CongTrader – 2025
Designed to help traders see the market through a multi-layered, structured lens..

Reversal Reactor - Multi-Pattern Candle Reversal ScannerReversal Reactor - Multi-Pattern Candle Reversal Scanner
⚪ Overview
Reversal Reactor is a comprehensive candle-pattern and volume-pressure detection engine designed to highlight possible reversal environments.
It identifies abnormal volume surges, major single-candle reversal structures, and multi-candle formations such as Morning/Evening Stars — all refined through adjustable shadow-to-body ratios and adaptive lookback logic.
⚪ Core Features
Big-Volume Candle Detection : green or red full body.
Flags candles with unusually high volume relative to a volume EMA. These moments often reflect climactic pushes, absorption, forced liquidations, or rapid sentiment flips.
Reversal Candle Pattern Suite
A unified engine that detects major reversal structures with individual on/off control:
• Engulfing — Strong directional assertion via body-wide engulfing of prior candle.
• Morning Star — Three-stage bullish reversal following sustained selling.
• Evening Star — Bearish transition structure after an extended advance.
• Hammer — Long lower or upper wick showing strong rejection from one side of the market..
• Shooting Star — Long upper wick showing aggressive upside rejection.
• Hanging Man — Bearish exhaustion signal forming near range highs.
• Doji — Neutral indecision candle marking potential transition zones.
Shadow-to-Body Ratio Control
Fine-tunes wick-dominant pattern detection (hammer/star types) by requiring the shadow to exceed the body by a customizable multiplier, reducing low-quality signals.
Adaptive Lookback Logic
Allows users to adjust historical evaluation depth, improving sensitivity across different volatility regimes and asset behaviors. Default setting is recommended.
⚪ How Traders Use It
• Spot exhaustion near key support/resistance.
• Validate reversal attempts with volume confirmation.
• Filter for clean candle structures before entering momentum shifts.
Disclaimer
This indicator is intended for educational and informational purposes only. It does not constitute financial advice, nor does it guarantee performance or profitability. Always conduct your own analysis and manage risk appropriately when trading.

Trading Sessions High/Low Zones The BestHiển thị toàn bộ session zone, có tùy chọn các ngày cần hiển thị gần nhất.
Hỗ trợ tốt hơn :)

HTF Candle Overlay – Multi-Timeframe Visualization ToolThis indicator overlays true Higher Timeframe (HTF) candlesticks directly onto any lower timeframe chart, allowing you to see the larger market structure while trading on precise execution timeframes such as 1-minute, 3-minute, or 5-minute.
Instead of constantly switching chart timeframes, you can now see both higher and lower timeframe price action at the same time. Each HTF candle is drawn as a large transparent candlestick with full upper and lower wicks, perfectly aligned in both time and price.
This makes it easy to identify:
- Trend direction from the higher timeframe
- Key support and resistance zones inside each HTF candle
- Liquidity sweeps and rejections across timeframes
- Optimal entries on lower timeframes with higher-timeframe confirmation
Key Features
- Displays true Higher Timeframe candles on any lower timeframe
- Clear transparent candle bodies for unobstructed price visibility
- Full upper and lower wicks
- Non-repainting confirmed candles
- Optional live display of the currently forming HTF candle
- Accurate time-based alignment
- Lightweight and optimized for performance
Who This Indicator Is For
- Scalpers who want higher-timeframe bias
- Day traders using multi-timeframe confirmation
- Smart Money / ICT traders monitoring HTF structure
- Anyone who wants clean multi-timeframe clarity without chart switching
How To Use
- Apply the indicator to any chart.
- Select your preferred Higher Timeframe (HTF) in the settings.
- Use your lower timeframe for entries while respecting HTF structure and direction.
- This tool helps you trade with the bigger picture in view while executing with precision on lower timeframes.

3EMA-8EMA Current Candle Scannerintraday scanner can also be used for short term trades, crossing above the ema high and low with volume gives signal

猛の掟・本物っぽいTradingViewスクリーナー 完全版//@version=5
indicator("猛の掟・本物っぽいTradingViewスクリーナー 完全版", overlay=false, max_labels_count=500, max_lines_count=500)
// =============================
// 入力パラメータ
// =============================
emaLenShort = input.int(5, "短期EMA", minval=1)
emaLenMid = input.int(13, "中期EMA", minval=1)
emaLenLong = input.int(26, "長期EMA", minval=1)
macdFastLen = input.int(12, "MACD Fast", minval=1)
macdSlowLen = input.int(26, "MACD Slow", minval=1)
macdSignalLen = input.int(9, "MACD Signal", minval=1)
macdZeroTh = input.float(0.2, "MACDゼロライン近辺とみなす許容値", step=0.05)
volMaLen = input.int(5, "出来高平均日数", minval=1)
volMinRatio = input.float(1.3, "出来高倍率(初動判定しきい値)", step=0.1)
volStrongRatio = input.float(1.5, "出来高倍率(本物/三点シグナル用)", step=0.1)
highLookback = input.int(60, "直近高値の参照本数", minval=10)
pullbackMin = input.float(5.0, "押し目最小 ", step=0.5)
pullbackMax = input.float(15.0, "押し目最大 ", step=0.5)
breakLookback = input.int(15, "レジブレ後とみなす本数", minval=1)
wickBodyMult = input.float(2.0, "ピンバー:下ヒゲが実体の何倍以上か", step=0.5)
// 表示設定
showPanel = input.bool(true, "下パネルにスコアを表示する")
showTable = input.bool(true, "右上に8条件チェック表を表示する")
// =============================
// 基本指標計算
// =============================
emaShort = ta.ema(close, emaLenShort)
emaMid = ta.ema(close, emaLenMid)
emaLong = ta.ema(close, emaLenLong)
= ta.macd(close, macdFastLen, macdSlowLen, macdSignalLen)
volMa = ta.sma(volume, volMaLen)
volRatio = volMa > 0 ? volume / volMa : 0.0
recentHigh = ta.highest(high, highLookback)
prevHigh = ta.highest(high , highLookback)
pullbackPct = recentHigh > 0 ? (recentHigh - close) / recentHigh * 100.0 : 0.0
// ローソク足要素
body = math.abs(close - open)
upperWick = high - math.max(open, close)
lowerWick = math.min(open, close) - low
// =============================
// A:トレンド条件
// =============================
emaUp = emaShort > emaShort and emaMid > emaMid and emaLong > emaLong
goldenOrder = emaShort > emaMid and emaMid > emaLong
aboveEma2 = close > emaLong and close > emaLong
trendOK = emaUp and goldenOrder and aboveEma2
// =============================
// B:MACD条件
// =============================
macdGC = ta.crossover(macdLine, macdSignal)
macdNearZero = math.abs(macdLine) <= macdZeroTh
macdUp = macdLine > macdLine
macdOK = macdGC and macdNearZero and macdUp
// =============================
// C:出来高条件
// =============================
volInitOK = volRatio >= volMinRatio // 8条件用
volStrongOK = volRatio >= volStrongRatio // 三点シグナル用
volumeOK = volInitOK
// =============================
// D:ローソク足パターン
// =============================
isBullPinbar = lowerWick > wickBodyMult * body and lowerWick > upperWick and close >= open
isBullEngulf = close > open and open < close and close > open
isBigBullCross = close > emaShort and close > emaMid and open < emaShort and open < emaMid and close > open
candleOK = isBullPinbar or isBullEngulf or isBigBullCross
// =============================
// E:価格帯(押し目&レジブレ)
// =============================
pullbackOK = pullbackPct >= pullbackMin and pullbackPct <= pullbackMax
isBreakout = close > prevHigh and close <= prevHigh
barsSinceBreak = ta.barssince(isBreakout)
afterBreakZone = barsSinceBreak >= 0 and barsSinceBreak <= breakLookback
afterBreakPullbackOK = afterBreakZone and pullbackOK and close > emaShort
priceOK = pullbackOK and afterBreakPullbackOK
// =============================
// 8条件の統合
// =============================
allRulesOK = trendOK and macdOK and volumeOK and candleOK and priceOK
// =============================
// 最終三点シグナル
// =============================
longLowerWick = lowerWick > wickBodyMult * body and lowerWick > upperWick
macdGCAboveZero = ta.crossover(macdLine, macdSignal) and macdLine > 0
volumeSpike = volStrongOK
finalThreeSignal = longLowerWick and macdGCAboveZero and volumeSpike
buyConfirmed = allRulesOK and finalThreeSignal
// =====================================================
// スクリーナー用スコア(0=なし, 1=猛, 2=確)
// =====================================================
score = buyConfirmed ? 2 : (allRulesOK ? 1 : 0)
// 色分け(1行で安全な書き方)
col = score == 2 ? color.new(color.yellow, 0) : score == 1 ? color.new(color.lime, 0) : color.new(color.gray, 80)
// -----------------------------------------------------
// ① 視覚用:下パネルのカラム表示
// -----------------------------------------------------
plot(showPanel ? score : na,
title = "猛スコア(0=なし,1=猛,2=確)",
style = plot.style_columns,
color = col,
linewidth = 2)
hline(0, "なし", color=color.new(color.gray, 80))
hline(1, "猛", color=color.new(color.lime, 60))
hline(2, "確", color=color.new(color.yellow, 60))
// -----------------------------------------------------
// ② Data Window 用出力(スクリーナー風)
// -----------------------------------------------------
plot(score, title="Score_0なし1猛2確", color=color.new(color.white, 100), display=display.data_window)
plot(allRulesOK ? 1 : 0, title="A_Trend_OK", color=color.new(color.white, 100), display=display.data_window)
plot(macdOK ? 1 : 0, title="B_MACD_OK", color=color.new(color.white, 100), display=display.data_window)
plot(volumeOK ? 1 : 0, title="C_Volume_OK", color=color.new(color.white, 100), display=display.data_window)
plot(candleOK ? 1 : 0, title="D_Candle_OK", color=color.new(color.white, 100), display=display.data_window)
plot(priceOK ? 1 : 0, title="E_Price_OK", color=color.new(color.white, 100), display=display.data_window)
plot(longLowerWick ? 1 : 0, title="F_Pin下ヒゲ_OK", color=color.new(color.white, 100), display=display.data_window)
plot(macdGCAboveZero ? 1 : 0, title="G_MACDゼロ上", color=color.new(color.white, 100), display=display.data_window)
plot(volumeSpike ? 1 : 0, title="H_出来高1.5倍", color=color.new(color.white, 100), display=display.data_window)
// -----------------------------------------------------
// ③ 右上に「8条件チェック表」を表示(最終バーのみ)
// -----------------------------------------------------
var table info = table.new(position.top_right, 2, 9,
border_width = 1,
border_color = color.new(color.white, 60))
// 1行分の表示用ヘルパー
fRow(string label, bool cond, int row) =>
color bg = cond ? color.new(color.lime, 70) : color.new(color.red, 80)
string txt = cond ? "達成" : "未達"
// 左列:条件名
table.cell(info, 0, row, label, text_color = color.white, bgcolor = color.new(color.black, 0))
// 右列:結果(達成 / 未達)
table.cell(info, 1, row, txt, text_color = color.white, bgcolor = bg)
if barstate.islast and showTable
// ヘッダー(2列とも黒背景)
table.cell(info, 0, 0, "猛の掟 8条件チェック", text_color = color.white, bgcolor = color.new(color.black, 0))
table.cell(info, 1, 0, "", text_color = color.white, bgcolor = color.new(color.black, 0))
fRow("A: トレンド", trendOK, 1)
fRow("B: MACD", macdOK, 2)
fRow("C: 出来高", volumeOK, 3)
fRow("D: ローソク", candleOK, 4)
fRow("E: 押し目/レジブレ", priceOK, 5)
fRow("三点: ヒゲ", longLowerWick, 6)
fRow("三点: MACDゼロ上", macdGCAboveZero,7)
fRow("三点: 出来高1.5倍", volumeSpike, 8)

Session Fibonacci Tracker with Dynamic Range FreezeSession Fibonacci Tracker with Dynamic Range Freeze
This indicator plots Fibonacci retracement and extension levels based on session high/low ranges with a unique "freeze" mechanism that locks levels during volatility and recalculates only when price returns to the established range.
How It Works:
The indicator uses a three-stage process to maintain stable Fibonacci levels:
Range Establishment: At the start of each session (default 1800 ET), the indicator tracks the session high and low. Fibonacci levels are calculated with dynamic anchoring - when price is above the session open, 0 anchors at the high with 1 at the low; when below, 0 anchors at the low with 1 at the high.
Freeze Mechanism: Once the range is established, it immediately freezes. If a candle closes outside this range, the Fibonacci levels remain locked at their current values even as new session highs or lows form. This prevents levels from constantly recalculating during trending moves.
Recalculation: The frozen range only updates when price action (high or low) touches back inside the established range. At this point, levels recalculate based on the current session high/low, then freeze again.
Key Features:
Customizable Fibonacci levels: All retracement (0.236, 0.382, 0.500, 0.618, 0.786) and extension levels (-1.0, -0.618, -0.272, 1.272, 1.618, 2.0) can be enabled/disabled and adjusted to custom values
Time-based line extension prevents historical buffer overflow errors
Works across all timeframes
Session start time fully customizable
Visual status indicator shows whether levels are frozen or active
All lines and labels are fully customizable (colors, width, labels, prices)
Use Cases:
This indicator is particularly useful for traders who want stable reference levels during volatile periods. Traditional Fibonacci tools recalculate with every new extreme, making them difficult to use as support/resistance during trends. This implementation keeps levels stable until price returns to consolidation, providing consistent reference points for entries, exits, and stop placement.
Settings:
Session Settings: Configure session start time (default 1800 ET)
Fibonacci Levels: Enable/disable and customize each retracement level value
Extension Levels: Enable/disable and customize each extension level value
Visual Settings: Adjust line extension, width, labels, and price display
Colors: Customize colors for open line, 0 level, 1 level, retracements, and extensions

AQR Momentum AQR Momentum – Short Description
Uses the slopes of 20/55/200-day moving averages to measure short-, mid-, and long-term trend direction.
Green = rising trend; Red = falling trend.
55-day slope is the primary momentum signal; 200-day shows the market regime.

NoProcess Prior Month/Week/Day High/Low/EQ Prior Period Levels
Plots key support/resistance levels from previous timeframes: Day, Week, and Month.
Levels Displayed:
PDH/PDL/PDE — Prior Day High, Low, and Equilibrium (midpoint)
PWH/PWL/PWE — Prior Week High, Low, and Equilibrium
PMH/PML/PME — Prior Month High, Low, and Equilibrium
Features:
Toggle each timeframe independently
Single color control for clean chart aesthetics
Configurable right extension (1-50 bars)
Dotted line style with labels positioned at line endpoints
Use Case:
Reference levels for institutional order flow concepts. Prior period highs/lows act as liquidity pools; equilibriums mark fair value zones where price often rebalances. Works on any instrument and timeframe.

VWAP + EMA9 With SignalsThis script is for scalping on the 5 minute timeframe. It contains signals that indicate intersection of VWAP by the EMA9. It contains Buy signals when a candle closes above both lines indicating a quick continuation of a long position (quick scalp) as well as Sell signals when a candle closes below both lines indicating a quick continuation of a short position (quick scalp). Please note that i do not recommend entries at Buy and Sell signals during Accumulation/Consolidation. Positions should be taken with volume.

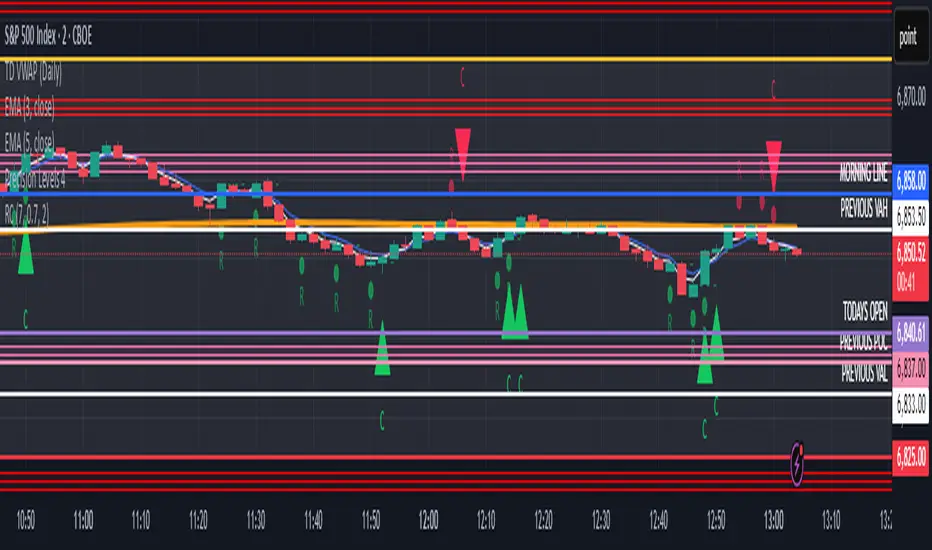
Reversal ConfirmationReversal Confirmation (RC)
This indicator identifies potential price reversals using a simple but effective two-candle pattern. It detects when a trend exhausts and confirms the reversal when the next candle eclipses the close of the reversal candle.
How It Works
The indicator uses a two-step process to confirm reversals:
Reversal Candle (R) - The first candle that closes in the opposite direction after a sustained trend. This signals potential exhaustion of the current move.
Confirmation Candle (C) - The candle that eclipses (closes beyond) the close of the reversal candle. This confirms the reversal is underway.
For a bullish reversal, the confirmation candle must close above the close of the reversal candle. For a bearish reversal, the confirmation candle must close below the close of the reversal candle.
Key Features
Requires a significant prior trend before looking for reversals, filtering out choppy sideways markets
Uses ATR to measure move significance, adapting to current volatility
Clean two-candle pattern that's easy to understand and trade
Visual dashed line showing the reversal candle close level that must be eclipsed
Built-in alerts for all signal types
Settings
Trend Lookback - Number of candles to analyze for prior trend detection (default: 7)
Trend Strength - Percentage of lookback candles required in trend direction (default: 0.7 = 70%)
Minimum Move (ATR multiple) - How large the prior move must be before signaling (default: 2.0)
Show Bullish/Bearish - Toggle each signal type on or off
Mark Reversal Candles - Toggle visibility of the reversal candle markers
Visual Signals
"R" with small circle - Marks the reversal candle where the pattern begins
"C" with triangle - Marks the confirmation candle (your entry signal)
Dashed line - Shows the close level of the reversal candle that must be eclipsed
Alerts
Three alert options are available:
Bullish Confirmation
Bearish Confirmation
Any Confirmation
How To Set Up Alerts
Add the indicator to your chart
Right-click on the chart and select "Add Alert" (or press Alt+A)
In the Condition dropdown, select "Reversal Confirmation"
Choose your preferred alert type
Set notification preferences (popup, email, sound, webhook)
Click "Create"
Tips For Best Results
Signals appearing at key support/resistance levels tend to be more reliable
Combine with VWAP, moving averages, or prior day high/low for confluence
Use higher timeframe trend direction as a filter
Increase Minimum Move ATR in volatile conditions to reduce false signals
Adjust Trend Lookback based on your timeframe (higher values for longer timeframes)
The Logic Behind It
After a sustained move in one direction, the first candle to close in the opposite direction signals potential exhaustion. However, one candle alone isn't enough. When the next candle eclipses the close of that reversal candle, it confirms that buyers (or sellers) have truly taken control and the reversal is underway.
Note: This indicator is for informational purposes only and should not be used as the sole basis for trading decisions. Always use proper risk management and consider combining with other forms of analysis.

Wp's Vector CandlesVector Candles are special, color-coded candlesticks that highlight significant market activity, showing intense buying/selling (climax), institutional entry, momentum shifts, or potential reversals by analyzing high volume and large price ranges (spreads). They transform normal charts to instantly spot areas of extreme participation (bullish green/blue, bearish red/violet) versus standard conditions (gray), helping traders see market dynamics beyond just price.

Quicksilver Master Terminal [Institutional]Overview
The Quicksilver Master Terminal is a comprehensive data visualization interface designed to bring institutional-grade market awareness to the retail chart. It replaces the need for multiple cluttered indicators by consolidating Trend, Momentum, Volatility, and Structure into a single Heads-Up Display (HUD).
Designed by Quicksilver Algo Systems, this tool is engineered for precision scalpers and prop firm traders who require instant situational awareness without switching timeframes.
Features
1. The Institutional HUD (Heads-Up Display)
Located in the top-right corner, this live dashboard provides real-time metrics on:
Market Structure: Instantly identifies if the asset is in a Bullish or Bearish regime relative to the 200 EMA.
Momentum Status: Tracks overbought/oversold conditions using smoothed Stochastic logic.
Volatility (ATR): Displays live Average True Range data for precise Stop Loss placement.
Volume Flow: Detects institutional volume spikes (1.5x average).
2. The Trend Cloud
A dynamic visual ribbon that fills the space between the Fast EMA (50) and Slow EMA (200).
Green Cloud: Strong Bullish Trend (Look for Longs).
Red Cloud: Strong Bearish Trend (Look for Shorts).
Cross: Visual warning of trend reversals.
3. Sniper Signal Logic
The script paints "INSTITUTIONAL BUY" and "INSTITUTIONAL SELL" labels only when high-probability confluence occurs:
Exhaustion: Stochastic RSI breaches extreme levels (<20 or >80).
Confirmation: Price action aligns with Heikin Ashi smoothing to filter noise.
Momentum: Fast %K crosses Slow %D.
How to Use
For Scalping (1m - 5m): Wait for the Trend Cloud to align with the Signal. Take "BUY" signals only when the Cloud is Green.
For Risk Management: Use the live "Volatility" number in the HUD to set your Stop Loss (e.g., 1.5x the current Volatility value).
About the Developer
This script is part of the Quicksilver Ecosystem. We build algorithmic solutions focused on capital preservation and risk management for funded traders.
Disclaimer: This tool is for educational market analysis only. Past performance is not indicative of future results.

Multi-Candle Reversal ConfirmationMulti-Candle Reversal Confirmation (MCRC)
This indicator identifies potential price reversals using a 3-candle confirmation pattern. It filters out noise by requiring a significant prior trend before signaling, helping you catch turning points rather than getting trapped in choppy price action.
How It Works
The indicator uses a three-step process to confirm reversals:
Candle 1 (Rejection) - Detects a rejection candle after a sustained move. This includes hammer/shooting star patterns with long wicks, doji candles showing indecision, or stall candles with unusually small bodies.
Candle 2 (Reversal) - Confirms the candle closes in the opposite direction of the prior trend.
Candle 3 (Confirmation) - Validates the reversal by either continuing in the new direction or breaking the high/low of the previous candle.
Key Features
Requires a significant prior trend before looking for reversals (no signals in choppy, sideways markets)
Uses ATR to measure move significance, adapting to current volatility
Marks rejection candles with small circles for early awareness
Confirmed signals shown as triangles with Bull/Bear labels
Built-in alerts for all signal types
Settings
Wick to Body Ratio - How pronounced the rejection wick must be compared to the candle body (default: 2.0)
Doji Threshold - Maximum body size relative to total range to qualify as a doji (default: 0.1)
Trend Lookback - Number of candles to analyze for prior trend detection (default: 5)
Trend Strength - Percentage of lookback candles required in trend direction (default: 0.6 = 60%)
Minimum Move (ATR multiple) - How large the prior move must be before signaling (default: 1.5)
Show Bullish/Bearish - Toggle each signal type on or off
Visual Signals
Small Circle - Marks potential rejection candles (first candle in the pattern)
Green Triangle (Bull) - Confirmed bullish reversal signal
Red Triangle (Bear) - Confirmed bearish reversal signal
Alerts
Three alert options are available:
Bullish Reversal Confirmed
Bearish Reversal Confirmed
Any Reversal Confirmed
How To Set Up Alerts
Add the indicator to your chart
Right-click on the chart and select "Add Alert" (or press Alt+A)
In the Condition dropdown, select "Multi-Candle Reversal Confirmation"
Choose your preferred alert type
Set notification preferences (popup, email, sound, webhook)
Click "Create"
Tips For Best Results
Combine with key support/resistance levels for higher probability trades
Use higher timeframe trend direction as a filter
Adjust Trend Lookback based on your timeframe (higher for longer timeframes)
Increase Minimum Move ATR in volatile conditions to reduce false signals
Signals appearing near VWAP, moving averages, or prior day levels tend to be more reliable
Note: This indicator is for informational purposes only and should not be used as the sole basis for trading decisions. Always use proper risk management and consider combining with other forms of analysis.
EMA Divergence Color CandlesThis indicator colors candles based on their position relative to the EMA and the strength of the divergence.
Above EMA → Blue (bullish zone)
Below EMA → Red (bearish zone)
Divergence strength is shown in 3 color levels:
Weak (close to EMA)
Medium
Strong (far from EMA)
The indicator draws its own candles, so no TradingView settings need to be changed.
The EMA line is also shown on top of the custom candles.

Zero Lag EMA_BhavatThis is a test script for zelma. This is intended to cut down the lag from traditional ema indicators.

VAPO OsilatorThe Real Map of Buying and Selling Pressure.
VAPO Advanced is fundamentally different from conventional oscillators that only measure momentum based on price. By integrating Volume and price movement (Pressure), it quantitatively maps the true buying and selling pressure in the market.
How It Works and What Are Its Advantages?
1. Core Pressure Measurement
Logic: The oscillator interprets high-volume price increases as strong buying pressure (+P) and high-volume price decreases as strong selling pressure (-P). Low-volume moves weaken the signal strength.
Benefit: This effectively filters out misleading signals caused by "fake" price movements (manipulation or low-volume spikes). It only displays momentum shifts that are supported by volume.
2. Dynamic Signal Line and Histogram
Signal Line: Provides a dynamic signal line smoothed by your choice of Moving Average type (EMA, SMA, WMA).
Histogram: Shows the difference between the VAPO line and the Signal line. A zero-line crossover of the histogram is the clearest signal that pressure is shifting direction. As the Green histogram grows, Buying Pressure accelerates; as the Red histogram grows, Selling Pressure accelerates.
3. Reliable Confirmation Tool
VAPO serves as an excellent confirmation tool when used alongside your primary trend indicators. For instance, when a trend indicator gives a BUY signal, VAPO crossing above the zero line (positive pressure) significantly increases the reliability of that signal.
⚠️ DISCLAIMER: THIS IS NOT FINANCIAL ADVICE. ALL INFORMATION PROVIDED IS FOR EDUCATIONAL AND ANALYTICAL PURPOSES ONLY.
YASAL UYARI: BU BİR YATIRIM TAVSİYESİ DEĞİLDİR. SUNULAN TÜM BİLGİLER YALNIZCA EĞİTİM VE ANALİZ AMAÇLIDIR.
