Exhaustion IndicatorThe ScalpSQZ indicator is designed to identify four critical market states using volatility structure, momentum behavior, and exhaustion conditions. It enhances scalping precision by visually marking transitions between consolidation, squeeze conditions, and momentum reversals through color-coded candles.
1. Squeeze Conditions (Orange Candles)
Orange candles highlight volatility compression, detected when Bollinger Bands contract inside the Keltner Channels. This structure signals that market volatility is tightening and a significant expansion move is likely to follow. The squeeze represents a pre-breakout environment and serves as the earliest warning of a potential directional shift.
2. Consolidation Conditions (Yellow Candles)
Yellow candles identify phases of low directional momentum. These conditions occur when RSI remains near neutral values, MACD histogram activity is minimal, and the Rate of Change stays muted. This combination indicates that the market is balanced and non-trending, often preceding a volatility spike or a new trend. Consolidation helps traders avoid low-probability entries during indecisive price action.
3. Momentum Exhaustion — Overbought Fade (White Candles)
White candles signal potential top-side exhaustion. This occurs when RSI enters overbought territory while the MACD histogram begins to weaken compared to the previous bar. This condition does not necessarily call a reversal but warns that bullish momentum is deteriorating and upside continuation may be limited. It is particularly useful for identifying trend fatigue and tightening stop-loss placement.
4. Momentum Exhaustion — Oversold Fade (Purple Candles)
Purple candles identify bottom-side exhaustion and appear when RSI reaches oversold levels, MACD momentum begins improving, and the current close shows buyer defense relative to the previous low. This condition suggests selling pressure is diminishing and a potential reversal or relief bounce may be forming. Purple candles serve as an early indication of bearish trend exhaustion.
Color Priority System
The indicator follows a fixed hierarchy to ensure clarity:
Squeeze (orange) has the highest priority, followed by consolidation (yellow). Exhaustion signals (white for tops, purple for bottoms) apply only when no squeeze or consolidation conditions are active. This structure ensures that the most critical market states are always highlighted first.
Purpose and Application
ScalpSQZ helps traders identify optimal environments for breakouts, anticipate trend exhaustion, and avoid low-quality trades during choppy or low-momentum conditions. It is suitable for scalping, day trading, and swing trading across any asset class or timeframe.
Candlestick analysis

Smart Scalper V7 [Churn Filter]Indicator uses relative volume by time as well as ADX to highlight if volume is high to prevent trading in chop or being faked out.
Dec 1
Release Notes
How to Read the "Traffic Light" 🚦
You asked: "How do I work out if volume is higher or lower?" Look at the White Horizontal Line running across the indicator.
Height (Quantity):
Above the Line: Volume is High (The crowd is here).
Below the Line: Volume is Low (Everyone is at lunch).
Color (Quality):
🟢 Green: High Volume + Strong Trend. (Best for Entries).
🟡 Yellow: High Volume but NO Trend. This is usually a Reversal or a Trap. (Big fight, no winner yet).
🟠 Orange: Trending, but on Low Volume. The price is drifting. Don't trust it—it can snap back easily.
🔴 Red: Low Volume, No Trend. The "Kill Zone." Do not trade.

Fair Value Gap Signals [Kodexius]Fair Value Gap Signals is an advanced market structure tool that automatically detects and tracks Fair Value Gaps (FVGs), evaluates the quality of each gap, and highlights high value reaction zones with visual metrics and signal markers.
The script is designed for traders who focus on liquidity concepts, order flow and mean reversion. It goes beyond basic FVG plotting by continuously monitoring how price interacts with each gap and by quantifying three key aspects of each zone:
-Entry velocity inside the gap
-Volume absorption during tests
-Structural integrity and depth of penetration
The result is a dynamic, information rich visualization of which gaps are being respected, which are being absorbed, and where potential reversals or continuations are most likely to occur.
All visual elements are configurable, including the maximum number of visible gaps per direction, mitigation method (close or wick) and an ATR based filter to ignore insignificant gaps in low volatility environments.
🔹 Features
🔸 Automated Fair Value Gap Detection
The script detects both bullish and bearish FVGs based on classic three candle logic:
Bullish FVG: current low is strictly above the high from two bars ago
Bearish FVG: current high is strictly below the low from two bars ago
🔸 ATR Based Gap Filter
To avoid clutter and low quality signals, the script can ignore very small gaps using an ATR based filter.
🔸Per Gap State Machine and Lifecycle
Each gap is tracked with an internal status:
Fresh: gap has just formed and has not been tested
Testing: price is currently trading inside the gap
Tested: gap was tested and left, waiting for a potential new test
Rejected: price entered the gap and then rejected away from it
Filled: gap is considered fully mitigated and no longer active
This state machine allows the script to distinguish between simple touches, multiple tests and meaningful reversals, and to trigger different alerts accordingly.
🔸 Visual Ranking of Gaps by Metrics
For each active gap, three additional horizontal rank bars are drawn on top of the gap area:
Rank 1 (Vel): maximum entry velocity inside the gap
Rank 2 (Vol): relative test volume compared to average volume
Rank 3 (Dpt): remaining safety of the gap based on maximum penetration depth
These rank bars extend horizontally from the creation bar, and their length is a visual score between 0 and 1, scaled to the age of the gap. Longer bars represent stronger or more favorable conditions.
🔸Signals and Rejection Markers
When a gap shows signs of rejection (price enters the gap and then closes away from it with sufficient activity), the script can print a signal label at the reaction point. These markers summarize the internal metrics of the gap using a tooltip:
-Velocity percentage
-Volume percentage
-Safety score
-Number of tests
🔸 Flexible Mitigation Logic (Close or Wick)
You can choose how mitigation is defined via the Mitigation Method input:
Close: the gap is considered filled only when the closing price crosses the gap boundary
Wick: a full fill is detected as soon as any wick crosses the gap boundary
🔸 Alert Conditions
-New FVG formed
-Price entering a gap (testing)
-Gap fully filled and invalidated
-Rejection signal generated
🔹Calculations
This section summarizes the main calculations used under the hood. Only the core logic is covered.
1. ATR Filter and Gap Size
The script uses a configurable ATR length to filter out small gaps. First the ATR is computed:
float atrVal = ta.atr(atrLength)
Gap size for both directions is then measured:
float gapSizeBull = low - high
float gapSizeBear = low - high
If useAtrFilter is enabled, gaps smaller than atrVal are ignored. This ties the minimum gap size to the current volatility regime.
2. Fair Value Gap Detection
The basic FVG conditions use a three bar structure:
bool fvgBull = low > high
bool fvgBear = high < low
For bullish gaps the script stores:
-top as low of the current bar
-bottom as high
For bearish gaps:
-top as high of the current bar
-bottom as low
This defines the price range that is considered the imbalance area.
3. Depth and Safety Score
Depth measures how far price has penetrated into the gap since its creation. For each bar, the script computes a currentDepth and updates the maximum depth:
float currentDepth = 0.0
if g.isBullish
if l < g.top
currentDepth := g.top - l
else
if h > g.bottom
currentDepth := h - g.bottom
if currentDepth > g.maxDepth
g.maxDepth := currentDepth
The safety score expresses how much of the gap remains intact:
float depthRatio = g.maxDepth / gapSize
float safetyScore = math.max(0.0, 1.0 - depthRatio)
safetyScore near 1: gap is mostly untouched
safetyScore near 0: gap is mostly or fully filled
4. Velocity Metric
Velocity captures how aggressively price moves inside the gap. It is based on the body to range ratio of each bar that trades within the gap and rewards bars that move in the same direction as the gap:
float barRange = h - l
float bodyRatio = math.abs(close - open) / barRange
float directionBonus = 0.0
if g.isBullish and close > open
directionBonus := 0.2
else if not g.isBullish and close < open
directionBonus := 0.2
float currentVelocity = math.min(bodyRatio + directionBonus, 1.0)
The gap keeps track of the strongest observed value:
if currentVelocity > g.maxVelocity
g.maxVelocity := currentVelocity
This maximum is later used as velScore when building the velocity rank bar.
5. Volume Accumulation and Volume Score
While price is trading inside a gap, the script accumulates the traded volume:
if isInside
g.testVolume += volume
It also keeps track of the number of tests and the volume at the start of the first test:
if g.status == "Fresh"
g.status := "Testing"
g.testCount := 1
g.testStartVolume := volume
An average volume is computed using a 20 period SMA:
float volAvg = ta.sma(volume, 20)
The expected volume is approximated as:
float expectedVol = volAvg * math.max(1, (bar_index - g.index) / 2)
The volume score is then:
float volScore = math.min(g.testVolume / expectedVol, 1.0)
This produces a normalized 0 to 1 metric that shows whether the gap has attracted more or less volume than expected over its lifetime.
6. Rank Bar Scaling
All three scores are projected visually along the time axis as horizontal bars. The script uses the age of the gap in bars as the maximum width:
float maxWidth = math.max(bar_index - g.index, 1)
Then each metric is mapped to a bar length:
int len1 = int(math.max(1, maxWidth * velScore))
g.rankBox1.set_right(g.index + len1)
int len2 = int(math.max(1, maxWidth * volScore))
g.rankBox2.set_right(g.index + len2)
int len3 = int(math.max(1, maxWidth * safetyScore))
g.rankBox3.set_right(g.index + len3)
This creates an intuitive visual representation where stronger metrics produce longer rank bars, making it easy to quickly compare the relative quality of multiple FVGs on the chart.

Linechart + Wicks - by SupersonicFXThis is a simple indicator that shows the highs and lows (wicks) on the linechart.
You can vary the colors.
Nothing more to say.
Hope some of you find it useful.

HTF Candle Overlay – Multi-Timeframe Visualization ToolThis indicator overlays true Higher Timeframe (HTF) candlesticks directly onto any lower timeframe chart, allowing you to see the larger market structure while trading on precise execution timeframes such as 1-minute, 3-minute, or 5-minute.
Instead of constantly switching chart timeframes, you can now see both higher and lower timeframe price action at the same time. Each HTF candle is drawn as a large transparent candlestick with full upper and lower wicks, perfectly aligned in both time and price.
This makes it easy to identify:
- Trend direction from the higher timeframe
- Key support and resistance zones inside each HTF candle
- Liquidity sweeps and rejections across timeframes
- Optimal entries on lower timeframes with higher-timeframe confirmation
Key Features
- Displays true Higher Timeframe candles on any lower timeframe
- Clear transparent candle bodies for unobstructed price visibility
- Full upper and lower wicks
- Non-repainting confirmed candles
- Optional live display of the currently forming HTF candle
- Accurate time-based alignment
- Lightweight and optimized for performance
Who This Indicator Is For
- Scalpers who want higher-timeframe bias
- Day traders using multi-timeframe confirmation
- Smart Money / ICT traders monitoring HTF structure
- Anyone who wants clean multi-timeframe clarity without chart switching
How To Use
- Apply the indicator to any chart.
- Select your preferred Higher Timeframe (HTF) in the settings.
- Use your lower timeframe for entries while respecting HTF structure and direction.
- This tool helps you trade with the bigger picture in view while executing with precision on lower timeframes.

Session Fibonacci Tracker with Dynamic Range FreezeSession Fibonacci Tracker with Dynamic Range Freeze
This indicator plots Fibonacci retracement and extension levels based on session high/low ranges with a unique "freeze" mechanism that locks levels during volatility and recalculates only when price returns to the established range.
How It Works:
The indicator uses a three-stage process to maintain stable Fibonacci levels:
Range Establishment: At the start of each session (default 1800 ET), the indicator tracks the session high and low. Fibonacci levels are calculated with dynamic anchoring - when price is above the session open, 0 anchors at the high with 1 at the low; when below, 0 anchors at the low with 1 at the high.
Freeze Mechanism: Once the range is established, it immediately freezes. If a candle closes outside this range, the Fibonacci levels remain locked at their current values even as new session highs or lows form. This prevents levels from constantly recalculating during trending moves.
Recalculation: The frozen range only updates when price action (high or low) touches back inside the established range. At this point, levels recalculate based on the current session high/low, then freeze again.
Key Features:
Customizable Fibonacci levels: All retracement (0.236, 0.382, 0.500, 0.618, 0.786) and extension levels (-1.0, -0.618, -0.272, 1.272, 1.618, 2.0) can be enabled/disabled and adjusted to custom values
Time-based line extension prevents historical buffer overflow errors
Works across all timeframes
Session start time fully customizable
Visual status indicator shows whether levels are frozen or active
All lines and labels are fully customizable (colors, width, labels, prices)
Use Cases:
This indicator is particularly useful for traders who want stable reference levels during volatile periods. Traditional Fibonacci tools recalculate with every new extreme, making them difficult to use as support/resistance during trends. This implementation keeps levels stable until price returns to consolidation, providing consistent reference points for entries, exits, and stop placement.
Settings:
Session Settings: Configure session start time (default 1800 ET)
Fibonacci Levels: Enable/disable and customize each retracement level value
Extension Levels: Enable/disable and customize each extension level value
Visual Settings: Adjust line extension, width, labels, and price display
Colors: Customize colors for open line, 0 level, 1 level, retracements, and extensions

NoProcess Prior Month/Week/Day High/Low/EQ Prior Period Levels
Plots key support/resistance levels from previous timeframes: Day, Week, and Month.
Levels Displayed:
PDH/PDL/PDE — Prior Day High, Low, and Equilibrium (midpoint)
PWH/PWL/PWE — Prior Week High, Low, and Equilibrium
PMH/PML/PME — Prior Month High, Low, and Equilibrium
Features:
Toggle each timeframe independently
Single color control for clean chart aesthetics
Configurable right extension (1-50 bars)
Dotted line style with labels positioned at line endpoints
Use Case:
Reference levels for institutional order flow concepts. Prior period highs/lows act as liquidity pools; equilibriums mark fair value zones where price often rebalances. Works on any instrument and timeframe.

VWAP + EMA9 With SignalsThis script is for scalping on the 5 minute timeframe. It contains signals that indicate intersection of VWAP by the EMA9. It contains Buy signals when a candle closes above both lines indicating a quick continuation of a long position (quick scalp) as well as Sell signals when a candle closes below both lines indicating a quick continuation of a short position (quick scalp). Please note that i do not recommend entries at Buy and Sell signals during Accumulation/Consolidation. Positions should be taken with volume.

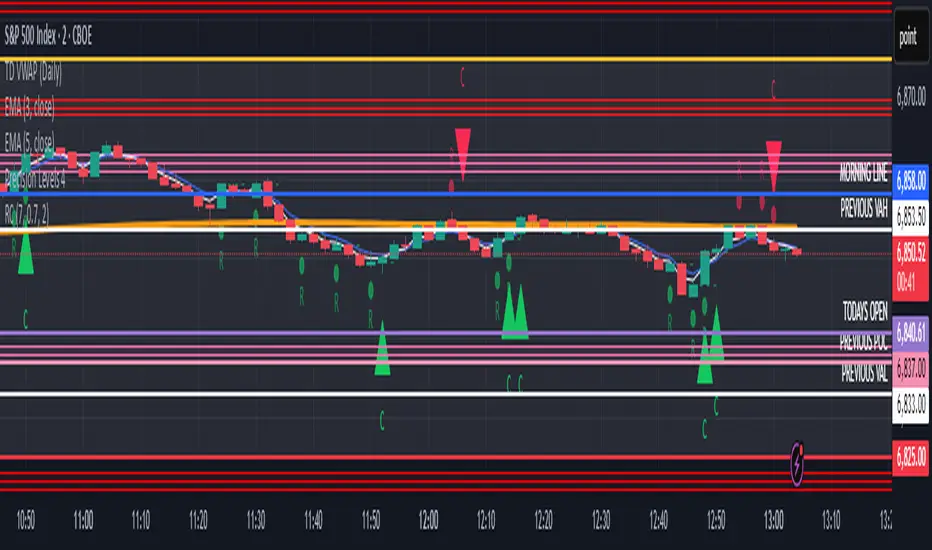
Reversal ConfirmationReversal Confirmation (RC)
This indicator identifies potential price reversals using a simple but effective two-candle pattern. It detects when a trend exhausts and confirms the reversal when the next candle eclipses the close of the reversal candle.
How It Works
The indicator uses a two-step process to confirm reversals:
Reversal Candle (R) - The first candle that closes in the opposite direction after a sustained trend. This signals potential exhaustion of the current move.
Confirmation Candle (C) - The candle that eclipses (closes beyond) the close of the reversal candle. This confirms the reversal is underway.
For a bullish reversal, the confirmation candle must close above the close of the reversal candle. For a bearish reversal, the confirmation candle must close below the close of the reversal candle.
Key Features
Requires a significant prior trend before looking for reversals, filtering out choppy sideways markets
Uses ATR to measure move significance, adapting to current volatility
Clean two-candle pattern that's easy to understand and trade
Visual dashed line showing the reversal candle close level that must be eclipsed
Built-in alerts for all signal types
Settings
Trend Lookback - Number of candles to analyze for prior trend detection (default: 7)
Trend Strength - Percentage of lookback candles required in trend direction (default: 0.7 = 70%)
Minimum Move (ATR multiple) - How large the prior move must be before signaling (default: 2.0)
Show Bullish/Bearish - Toggle each signal type on or off
Mark Reversal Candles - Toggle visibility of the reversal candle markers
Visual Signals
"R" with small circle - Marks the reversal candle where the pattern begins
"C" with triangle - Marks the confirmation candle (your entry signal)
Dashed line - Shows the close level of the reversal candle that must be eclipsed
Alerts
Three alert options are available:
Bullish Confirmation
Bearish Confirmation
Any Confirmation
How To Set Up Alerts
Add the indicator to your chart
Right-click on the chart and select "Add Alert" (or press Alt+A)
In the Condition dropdown, select "Reversal Confirmation"
Choose your preferred alert type
Set notification preferences (popup, email, sound, webhook)
Click "Create"
Tips For Best Results
Signals appearing at key support/resistance levels tend to be more reliable
Combine with VWAP, moving averages, or prior day high/low for confluence
Use higher timeframe trend direction as a filter
Increase Minimum Move ATR in volatile conditions to reduce false signals
Adjust Trend Lookback based on your timeframe (higher values for longer timeframes)
The Logic Behind It
After a sustained move in one direction, the first candle to close in the opposite direction signals potential exhaustion. However, one candle alone isn't enough. When the next candle eclipses the close of that reversal candle, it confirms that buyers (or sellers) have truly taken control and the reversal is underway.
Note: This indicator is for informational purposes only and should not be used as the sole basis for trading decisions. Always use proper risk management and consider combining with other forms of analysis.

Wp's Vector CandlesVector Candles are special, color-coded candlesticks that highlight significant market activity, showing intense buying/selling (climax), institutional entry, momentum shifts, or potential reversals by analyzing high volume and large price ranges (spreads). They transform normal charts to instantly spot areas of extreme participation (bullish green/blue, bearish red/violet) versus standard conditions (gray), helping traders see market dynamics beyond just price.

Quicksilver Master Terminal [Institutional]Overview
The Quicksilver Master Terminal is a comprehensive data visualization interface designed to bring institutional-grade market awareness to the retail chart. It replaces the need for multiple cluttered indicators by consolidating Trend, Momentum, Volatility, and Structure into a single Heads-Up Display (HUD).
Designed by Quicksilver Algo Systems, this tool is engineered for precision scalpers and prop firm traders who require instant situational awareness without switching timeframes.
Features
1. The Institutional HUD (Heads-Up Display)
Located in the top-right corner, this live dashboard provides real-time metrics on:
Market Structure: Instantly identifies if the asset is in a Bullish or Bearish regime relative to the 200 EMA.
Momentum Status: Tracks overbought/oversold conditions using smoothed Stochastic logic.
Volatility (ATR): Displays live Average True Range data for precise Stop Loss placement.
Volume Flow: Detects institutional volume spikes (1.5x average).
2. The Trend Cloud
A dynamic visual ribbon that fills the space between the Fast EMA (50) and Slow EMA (200).
Green Cloud: Strong Bullish Trend (Look for Longs).
Red Cloud: Strong Bearish Trend (Look for Shorts).
Cross: Visual warning of trend reversals.
3. Sniper Signal Logic
The script paints "INSTITUTIONAL BUY" and "INSTITUTIONAL SELL" labels only when high-probability confluence occurs:
Exhaustion: Stochastic RSI breaches extreme levels (<20 or >80).
Confirmation: Price action aligns with Heikin Ashi smoothing to filter noise.
Momentum: Fast %K crosses Slow %D.
How to Use
For Scalping (1m - 5m): Wait for the Trend Cloud to align with the Signal. Take "BUY" signals only when the Cloud is Green.
For Risk Management: Use the live "Volatility" number in the HUD to set your Stop Loss (e.g., 1.5x the current Volatility value).
About the Developer
This script is part of the Quicksilver Ecosystem. We build algorithmic solutions focused on capital preservation and risk management for funded traders.
Disclaimer: This tool is for educational market analysis only. Past performance is not indicative of future results.

Multi-Candle Reversal ConfirmationMulti-Candle Reversal Confirmation (MCRC)
This indicator identifies potential price reversals using a 3-candle confirmation pattern. It filters out noise by requiring a significant prior trend before signaling, helping you catch turning points rather than getting trapped in choppy price action.
How It Works
The indicator uses a three-step process to confirm reversals:
Candle 1 (Rejection) - Detects a rejection candle after a sustained move. This includes hammer/shooting star patterns with long wicks, doji candles showing indecision, or stall candles with unusually small bodies.
Candle 2 (Reversal) - Confirms the candle closes in the opposite direction of the prior trend.
Candle 3 (Confirmation) - Validates the reversal by either continuing in the new direction or breaking the high/low of the previous candle.
Key Features
Requires a significant prior trend before looking for reversals (no signals in choppy, sideways markets)
Uses ATR to measure move significance, adapting to current volatility
Marks rejection candles with small circles for early awareness
Confirmed signals shown as triangles with Bull/Bear labels
Built-in alerts for all signal types
Settings
Wick to Body Ratio - How pronounced the rejection wick must be compared to the candle body (default: 2.0)
Doji Threshold - Maximum body size relative to total range to qualify as a doji (default: 0.1)
Trend Lookback - Number of candles to analyze for prior trend detection (default: 5)
Trend Strength - Percentage of lookback candles required in trend direction (default: 0.6 = 60%)
Minimum Move (ATR multiple) - How large the prior move must be before signaling (default: 1.5)
Show Bullish/Bearish - Toggle each signal type on or off
Visual Signals
Small Circle - Marks potential rejection candles (first candle in the pattern)
Green Triangle (Bull) - Confirmed bullish reversal signal
Red Triangle (Bear) - Confirmed bearish reversal signal
Alerts
Three alert options are available:
Bullish Reversal Confirmed
Bearish Reversal Confirmed
Any Reversal Confirmed
How To Set Up Alerts
Add the indicator to your chart
Right-click on the chart and select "Add Alert" (or press Alt+A)
In the Condition dropdown, select "Multi-Candle Reversal Confirmation"
Choose your preferred alert type
Set notification preferences (popup, email, sound, webhook)
Click "Create"
Tips For Best Results
Combine with key support/resistance levels for higher probability trades
Use higher timeframe trend direction as a filter
Adjust Trend Lookback based on your timeframe (higher for longer timeframes)
Increase Minimum Move ATR in volatile conditions to reduce false signals
Signals appearing near VWAP, moving averages, or prior day levels tend to be more reliable
Note: This indicator is for informational purposes only and should not be used as the sole basis for trading decisions. Always use proper risk management and consider combining with other forms of analysis.
EMA Divergence Color CandlesThis indicator colors candles based on their position relative to the EMA and the strength of the divergence.
Above EMA → Blue (bullish zone)
Below EMA → Red (bearish zone)
Divergence strength is shown in 3 color levels:
Weak (close to EMA)
Medium
Strong (far from EMA)
The indicator draws its own candles, so no TradingView settings need to be changed.
The EMA line is also shown on top of the custom candles.

Zero Lag EMA_BhavatThis is a test script for zelma. This is intended to cut down the lag from traditional ema indicators.

VAPO OsilatorThe Real Map of Buying and Selling Pressure.
VAPO Advanced is fundamentally different from conventional oscillators that only measure momentum based on price. By integrating Volume and price movement (Pressure), it quantitatively maps the true buying and selling pressure in the market.
How It Works and What Are Its Advantages?
1. Core Pressure Measurement
Logic: The oscillator interprets high-volume price increases as strong buying pressure (+P) and high-volume price decreases as strong selling pressure (-P). Low-volume moves weaken the signal strength.
Benefit: This effectively filters out misleading signals caused by "fake" price movements (manipulation or low-volume spikes). It only displays momentum shifts that are supported by volume.
2. Dynamic Signal Line and Histogram
Signal Line: Provides a dynamic signal line smoothed by your choice of Moving Average type (EMA, SMA, WMA).
Histogram: Shows the difference between the VAPO line and the Signal line. A zero-line crossover of the histogram is the clearest signal that pressure is shifting direction. As the Green histogram grows, Buying Pressure accelerates; as the Red histogram grows, Selling Pressure accelerates.
3. Reliable Confirmation Tool
VAPO serves as an excellent confirmation tool when used alongside your primary trend indicators. For instance, when a trend indicator gives a BUY signal, VAPO crossing above the zero line (positive pressure) significantly increases the reliability of that signal.
⚠️ DISCLAIMER: THIS IS NOT FINANCIAL ADVICE. ALL INFORMATION PROVIDED IS FOR EDUCATIONAL AND ANALYTICAL PURPOSES ONLY.
YASAL UYARI: BU BİR YATIRIM TAVSİYESİ DEĞİLDİR. SUNULAN TÜM BİLGİLER YALNIZCA EĞİTİM VE ANALİZ AMAÇLIDIR.

Momentum Candle by DNDFXMomentum Candle v2 is a simple yet powerful indicator designed to detect strong momentum candles based on candle body size and the ratio between the body and total wick.
This indicator is ideal for traders who focus on:
Momentum trading
Breakout strategies
XAUUSD (Gold) scalping
Supply & Demand / Smart Money Concepts (SMC) confirmation
🔧 How the Indicator Works
The indicator analyzes each candle and classifies it as a Bullish Momentum or Bearish Momentum candle when these conditions are met:
✅ The candle body exceeds the minimum size
✅ The total wick is smaller compared to the body
✅ The Body-to-Wick ratio meets the strength filter
Visual signals include:
Green background for bullish momentum
Red background for bearish momentum
Up/Down triangle markers as entry guidance
⚙️ Customizable Parameters
Min Body Size (Points) – Sets the minimum candle body size
Min Body : Wick Ratio – Controls how dominant the body is compared to the wicks
All parameters can be optimized according to your trading style and timeframe.
✅ Best Use Cases
This indicator is useful for:
Breakout confirmation
Momentum validation
Filtering false breakouts
Scalping and intraday trading on XAUUSD
🧠 Trading Tips
For better accuracy, combine this indicator with:
Support & Resistance
Supply & Demand zones
Break of Structure (BOS) / CHoCH
Best performance on M5 – H1 timeframes.
⚠️ DISCLAIMER
This indicator is a supporting tool, not a guaranteed profit system. Always apply proper risk management. You are fully responsible for your trading decisions.

Candlestick Pattern Identifier (Extended + Alerts)Candlestick Pattern Identifier (Extended + Alerts)


Effort per 1% Move (Normalized Columns)This indicator Shows a Normalized "effort" needed to move a certain assets price by 1 percent.
Used correctly, this can help in visualizing manipulation and shows a certain chance of a candle turning to a swing point.

Koushik_BBEMAJust a combination of BB and EMA. An easy way to immediately add bollinger band and multiple ema to your chart.

5MA+スーパートレンド + Disparity Scalping (SIMPLE FILTER)5MA + ATR Trend Filter + Disparity Scalping
This indicator combines a five-EMA trend framework, an ATR-based trailing trend line, a volatility breakout detector, and an ultra-fast scalping module using RSI and custom momentum prediction.
It is designed for both trend continuation and rapid reversal trading.
🔹 Main Components
1️⃣ Five-EMA Trend Framework
Uses 9 / 20 / 50 / 100 / 200 EMAs
Identifies short-term and long-term market direction
Provides dynamic support and resistance
Helpful for determining breakout vs. pullback conditions
2️⃣ ATR-Based Trailing Trend Line
Uses ATR multiplier to build a trailing stop line
Color change indicates directional shift
Works as a trend filter or trailing stop reference
Helps avoid counter-trend trades during strong trends
3️⃣ High-Volatility Breakout Detector (Optimized for Fast Markets)
Uses ATR expansion, Bollinger band breakout, and volatility comparison (HV vs RV)
Detects sudden market acceleration
Generates breakout BUY/SELL signals when volatility pressure aligns with direction
Useful for explosive markets such as gold or crypto, but compatible with all assets
4️⃣ Ultra-Fast Disparity Scalper
Measures price distance from EMA5 and EMA10
Uses RSI for exhaustion filtering
Predicts momentum turns with a custom RVI-based algorithm
Generates early reversal BUY/SELL signals before full market reaction
Designed for scalping in high-speed environments
5️⃣ Simple Overheat Filter
Blocks trades in extremely overbought/oversold zones
Gray signals indicate low-quality trade setups to avoid
Helps remove “chasing” entries during excessive deviation
🎯 Best Use Cases
Scalping fast reversals
Entering trends after confirmed volatility breakouts
Filtering entries during extreme overbought/oversold phases
Combining EMA structure with breakout momentum
⚠️ Important Notice
This tool is designed to support decision making, not guarantee trade results.
For best performance, combine with:
Price action (market structure)
Volume/volatility context
Support and resistance analysis
🏷️ Short Description (for compact summary)
Five-EMA trend structure with ATR trailing filter, volatility breakout detection, and ultra-fast scalping using RSI + momentum prediction. Suitable for both rapid reversals and trend continuation setups.

5MA+TrendMagic + Disparity Scalping (SIMPLE FILTER)5MA + Trend Filter + Disparity Scalping
This multi-purpose indicator combines a five-EMA trend structure, a volatility-based trend filter, and an ultra-fast scalping module to detect both trend continuation and sharp reversal opportunities.
It is suitable for scalping, day trading, and trend-following strategies.
🔹 Main Components
1️⃣ Five-EMA Trend Structure
Displays 9 / 20 / 50 / 100 / 200 EMA levels
Helps identify short-term and long-term market direction
Useful for support and resistance during trending markets
2️⃣ Volatility-Driven Trend Filter
Uses CCI and ATR to form a dynamic trailing line
The line switches color based on momentum direction
Can act as a trailing stop or trend confirmation filter
Helps avoid counter-trend entries
3️⃣ High-Volatility GOLD Signal
Detects sudden volatility expansions using ATR, Bollinger metrics, and volatility comparison (HV vs RV)
Marks rapid breakout situations with potential continuation setups
Available for all assets, optimized for highly volatile markets
4️⃣ Ultra-Fast Disparity Scalper
Measures price deviation from EMA5 and EMA10
Confirms exhaustion using RSI + momentum prediction from a custom RVI model
Generates early BUY/SELL reversal markers
Detects momentum shifts before price fully reacts
5️⃣ Simple Overheat Filter
Prevents trades in extremely overbought/oversold zones
Gray-colored signals indicate unsafe trades to avoid
🎯 Best Use Cases
Catching early reversals during fast movement
Identifying strong trend continuation after volatility expansion
Avoiding low-probability scalps in overheated conditions
Applying EMA structure for confluence with price action
⚠️ Note
This indicator is a decision-support tool, not a standalone signal generator.
For best precision, combine with:
Market structure
Volume analysis
Support / resistance levels
🏷️ Short Description (for compact field)
Multi-function tool combining 5EMA structure, volatility-based trend filtering, and ultra-fast reversal scalping using RSI + custom RVI momentum. Ideal for both trend continuation and rapid reversals.

ATR + BJ Signal(GOLD)This script visualizes a price-based counting pattern that highlights potential market exhaustion and reversal areas.
When a series of candles continues in one direction, the indicator measures price momentum loss and marks possible turning points.
Features
Counts consecutive upward or downward price movement
Highlights possible exhaustion or reversal areas
Optional alerts, take-profit and stop-loss visual levels
Fully customizable colors and display settings
Useful as a confirmation tool with trend or volume indicators
This indicator is designed to assist decision-making, not to generate mechanical buy/sell signals.
Best used together with other trend or volatility tools.
📎 Short Description (for compact field)
Counts consecutive price movement to highlight potential market exhaustion and reversal zones.
Helps identify when strong trends may be weakening.
