Candlestick analysis

Sonic R+EMA PYTAGOYou must determine the supply and demand zone as ema34, ema89, ema200, ema610. Then open the long position or the short position with SL and TP.

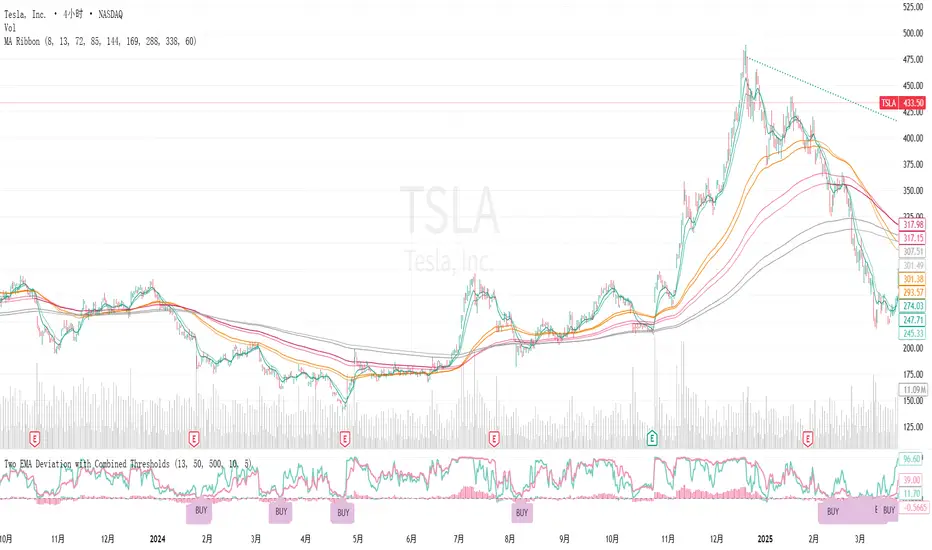
双EMA速度乖离Two EMA Deviation with Combined ThresholdsEMATwo EMA Deviation with Combined Thresholds
Two EMA Deviation with Combined ThresholdsTwo EMA Deviation with Combined ThresholdsTwo EMA Deviation with Combined ThresholdsTwo EMA Deviation with Combined ThresholdsTwo EMA Deviation with Combined ThresholdsTwo EMA Deviation with Combined ThresholdsTwo EMA Deviation with Combined Thresholds
Highlight 15:00 to 19:00 candles CK - Indicator can used for back testing price movement on 1 hour timeframe for commodities

BTC LL->HH Liquidity Sweep / BOS / Retest / 4H Bias v6_8BTC LL->HH Liquidity Sweep / BOS / Retest / 4H Bias v6_8

2-Period RSI Extreme One-Bar CrossIndicates when a 2 period rsi crosses from oversold of 10 or less to 50 and vice versa will indicate when the 2 period rsi crosses from overbought of 90 and above to 50.

Midnight Lines for Tokyo, London, New Yorkممتاز 👌 إليك **تعريفًا محدثًا وكاملًا للمؤشر باللغتين العربية والإنجليزية**، مع إدراج توضيح دقيق لتعامل المؤشر مع **تغيّر التوقيت الصيفي والشتوي (DST)** في لندن ونيويورك:
---
## 🇬🇧 **English Description (with DST behavior)**
**Indicator name:** *Midnight Lines for Tokyo, London, and New York*
**Purpose:**
This indicator automatically draws **vertical lines** on the chart at **midnight (00:00)** for the three major global trading sessions:
* **Tokyo**
* **London**
* **New York**
### 🔹 How it works:
1. The script checks each candle’s time using the built-in TradingView time zone function:
* `"Asia/Tokyo"`
* `"Europe/London"`
* `"America/New_York"`
2. When it detects **00:00** in any of these zones, it draws:
* A **vertical dotted line** that extends from the top to the bottom of the chart.
* A **label** at the top with the session name (e.g., “Tokyo Midnight”).
3. Each session has its own color for clarity:
* **Blue** → Tokyo Midnight
* **Green** → London Midnight
* **Red** → New York Midnight
### 🕒 Automatic Daylight Saving Time (DST) Adjustment:
The indicator automatically adapts to **Daylight Saving Time changes** in both **London** and **New York**:
* When London switches between **GMT and GMT+1**, the midnight line shifts automatically to remain accurate.
* When New York switches between **EST and EDT**, the script also updates accordingly.
* Tokyo does **not** observe DST, so its timing stays constant year-round.
### 🎯 Purpose:
Helps traders visually track the start of each new trading day in the major sessions and analyze:
* Session overlaps (e.g., London–New York overlap)
* Session-based trading strategies
* Price movement behavior at each new day open
---
## 🇸🇦 **الوصف بالعربية (مع إدراج تغير التوقيت)**
**اسم المؤشر:** خطوط منتصف الليل لجلسات طوكيو، لندن، ونيويورك
**الهدف:**
يقوم هذا المؤشر تلقائيًا برسم **خطوط عمودية** على الرسم البياني عند **منتصف الليل (00:00)** لكل من الجلسات الثلاث الرئيسية:
* **جلسة طوكيو**
* **جلسة لندن**
* **جلسة نيويورك**
### 🔹 كيفية العمل:
1. يستخدم المؤشر دوال TradingView لحساب الوقت الفعلي لكل مدينة:
* `"Asia/Tokyo"` لطوكيو
* `"Europe/London"` للندن
* `"America/New_York"` لنيويورك
2. عند وصول الساعة إلى **00:00** بتوقيت أي مدينة، يرسم المؤشر:
* **خطًا عموديًا متقطعًا** يمتد من أعلى إلى أسفل الرسم البياني.
* **تسمية (Label)** أعلى الخط باسم الجلسة (مثل “Tokyo Midnight”).
3. كل جلسة لها لون مختلف:
* **أزرق** → منتصف طوكيو
* **أخضر** → منتصف لندن
* **أحمر** → منتصف نيويورك
### 🕒 التعامل مع تغيّر التوقيت الصيفي والشتوي (DST):
يتكيّف المؤشر تلقائيًا مع تغيّر التوقيت في لندن ونيويورك:
* عندما تنتقل لندن بين **التوقيت الشتوي (GMT)** و**التوقيت الصيفي (GMT+1)**، يتحرك الخط تلقائيًا ليبقى في الساعة 00:00 المحلية.
* وعندما تنتقل نيويورك بين **EST** و**EDT**، يتم تعديل الخط كذلك تلقائيًا.
* أما طوكيو فلا تعتمد التوقيت الصيفي، لذا يبقى وقتها ثابتًا دائمًا على الساعة **00:00 JST**.
### 🎯 الفائدة:
يساعد المتداولين على تحديد **بداية كل جلسة تداول رئيسية**، ومراقبة:
* **تداخل الجلسات** مثل لندن ونيويورك
* **تحركات السعر عند بداية اليوم الجديد**
* **استراتيجيات التداول الزمنية حسب الجلسة**
---

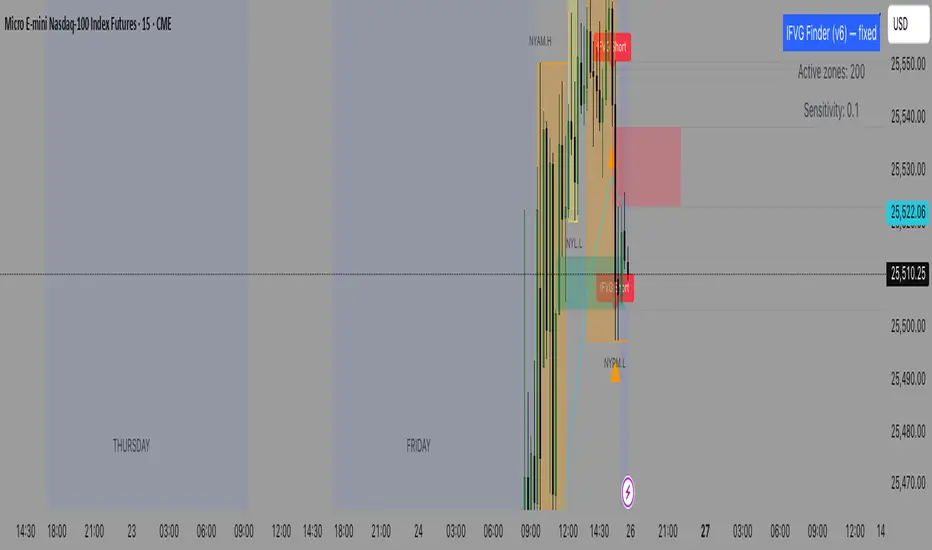
IFVG (Inverted Fair Value Gap) Finder Detects standard Fair Value Gaps (3-candle definition) on any timeframe.
Tracks those FVG zones on the chart.
Marks Inverted Fair Value Gaps (IFVGs) when price breaches (invalidates) an FVG and later retests it from the other side.
Draws the zones and plots clear entry arrows when a retest is detected (so you can use them to enter trades).
Has alertconditions you can enable for automated alerts.
Renko BandsThis is renko without the candles, just the endpoint plotted as a line with bands around it that represent the brick size. The idea came from thinking about what renko actually gives you once you strip away the visual brick format. At its core, renko is a filtered price series that only updates when price moves a fixed amount, which means it's inherently a trend-following mechanism with built-in noise reduction. By plotting just the renko price level and surrounding it with bands at the brick threshold distances, you get something that works like regular volatility bands while still behaving as a trend indicator.
The center line is the current renko price, which trails actual price based on whichever brick sizing method you've selected. When price moves enough to complete a brick in the renko calculation, the center line jumps to the new brick level. The bands sit at plus and minus one brick size from that center line, showing you exactly how far price needs to move before the next brick would form. This makes the bands function as dynamic breakout levels. When price touches or crosses a band, you know a new renko brick is forming and the trend calculation is updating.
What makes this cool is the dual-purpose nature. You can use it like traditional volatility bands where the outer edges represent boundaries of normal price movement, and breaks beyond those boundaries signal potential trend continuation or exhaustion. But because the underlying calculation is renko rather than standard deviation or ATR around a moving average, the bands also give you direct insight into trend state. When the center line is rising consistently and price stays near the upper band, you're in a clean uptrend. When it's falling and price hugs the lower band, downtrend. When the center line is flat and price is bouncing between both bands, you're ranging.
The three brick sizing methods work the same way as standard renko implementations. Traditional sizing uses a fixed price range, so your bands are always the same absolute distance from the center line. ATR-based sizing calculates brick range from historical volatility, which makes the bands expand and contract based on the ATR measurement you chose at startup. Percentage-based sizing scales the brick size with price level, so the bands naturally widen as price increases and narrow as it decreases. This automatic scaling is particularly useful for instruments that move proportionally rather than in fixed increments.
The visual simplicity compared to full renko bricks makes this more practical for overlay use on your main chart. Instead of trying to read brick patterns in a separate pane or cluttering your price chart with boxes and lines, you get a single smoothed line with two bands that convey the same information about trend state and momentum. The center line shows you the filtered trend direction, the bands show you the threshold levels, and the relationship between price and the bands tells you whether the current move has legs or is stalling out.
From a trend-following perspective, the renko line naturally stays flat during consolidation and only moves when directional momentum is strong enough to complete bricks. This built-in filter removes a lot of the whipsaw that affects moving averages during choppy periods. Traditional moving averages continue updating with every bar regardless of whether meaningful directional movement is happening, which leads to false signals when price is just oscillating. The renko line only responds to sustained moves that meet the brick size threshold, so it tends to stay quiet when price is going nowhere and only signals when something is actually happening.
The bands also serve as natural stop-loss or profit-target references since they represent the distance price needs to move before the trend calculation changes. If you're long and the renko line is rising, you might place stops below the lower band on the theory that if price falls far enough to reverse the renko trend, your thesis is probably invalidated. Conversely, the upper band can mark levels where you'd expect the current brick to complete and potentially see some consolidation or pullback before the next brick forms.
What this really highlights is that renko's value isn't just in the brick visualization, it's in the underlying filtering mechanism. By extracting that mechanism and presenting it in a more traditional band format, you get access to renko's trend-following properties without needing to commit to the brick chart aesthetic or deal with the complications of overlaying brick drawings on a time-based chart. It's renko after all, so you get the trend filtering and directional clarity that makes renko useful, but packaged in a way that integrates more naturally with standard technical analysis workflows.

Buy vs Sell Liquidity + Difference (Bottom Right)Script Summary (Short Notes)
⚙️ Purpose
Tracks and displays Buy Volume vs Sell Volume difference during the day, based on candle direction.
Useful for spotting liquidity imbalance between buyers and sellers.
📊 How It Works
Volume Classification
If close > open → counts volume as Buy Volume
If close < open → counts volume as Sell Volume
Aggregation Timeframe
You can select a timeframe (1, 2, 3, 5, 15, 30 mins)
Script recalculates data from that aggregation level.
Daily Reset
At the start of a new trading day, totals reset to zero.
Cumulative Calculation
Adds all buy/sell volumes as the day progresses.
Calculates:
Total Volume
Difference (BUY − SELL)
Percentages (%)

DAMMU AUTOMATICAL AI ENRTY AND TARGET AND EXITMain Components
Supertrend System –
Detects market trend direction (Buy/Sell zones).
→ Green = Uptrend (Buy)
→ Red = Downtrend (Sell)
SMA Filter –
Uses 50 & 200 moving averages to confirm overall trend.
→ Price above both → Bullish
→ Price below both → Bearish
Buy/Sell Signals –
Generated when Supertrend flips direction and SMA confirms.
→ Triangle up = Buy
→ Triangle down = Sell
Take Profit / Stop Loss Levels –
Automatically calculated after Buy/Sell entry.
→ TP1, TP2, SL shown on chart
ADX (Sideways Zone Filter) –
If ADX < 25 → Market sideways → Avoid trades
Shows “No Trade Zone” area
Smart Money Concepts (SMC) Tools –
🔹 Market structure (HH, HL, LH, LL)
🔹 Order blocks (OB)
🔹 Equal highs/lows
🔹 Fair Value Gaps (FVG)
🔹 Premium & Discount zones
Helps find institutional entry points
Visual Display –
Color-coded background (trend zones)
Labels for buy/sell/structure
Optional FVG and order block boxes
Risk Management –
Input-based position sizing, SL & TP management
(to calculate profit levels and minimize loss)

FX Sessions by m_cptForex Intraday Sessions Indicator, config time in UTC-4. Support 4 main sessions, smooth end-to-start candles mode, without gaps if your sessions has config like:
1) 19:00 - 03:00
2) 02:00 - 03:00
3) 03:00 -11:00
No excluded last candles issue on all TFs.
Working on LTF up to 1h TF since its intraday sessions indicator.

Stop point MMAAn indicator that determines an important stopping area by overcoming the blue candle. The overriding party is determined by buyers or sellers, as it must be confirmed by two candles closing below
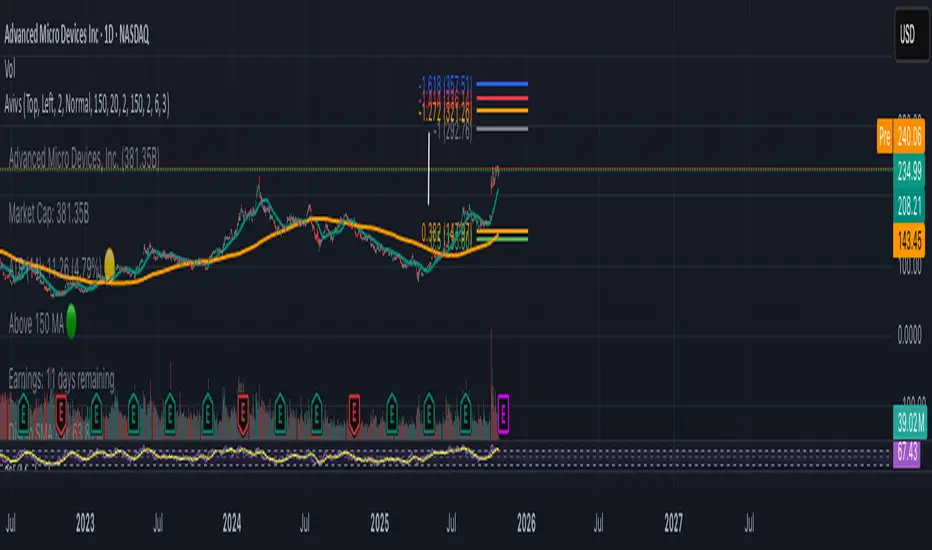
Avivso 150 + ATHThis Pine Script displays a dynamic on-chart watermark and key stock data.
It shows company info, symbol, industry, market cap, ATR(14) with color status, earnings countdown, and distances from the current price to SMA150 and the all-time high.
It also plots SMA 20 and SMA 150 moving-average lines on the chart and supports configurable position, size, and padding for the watermark.
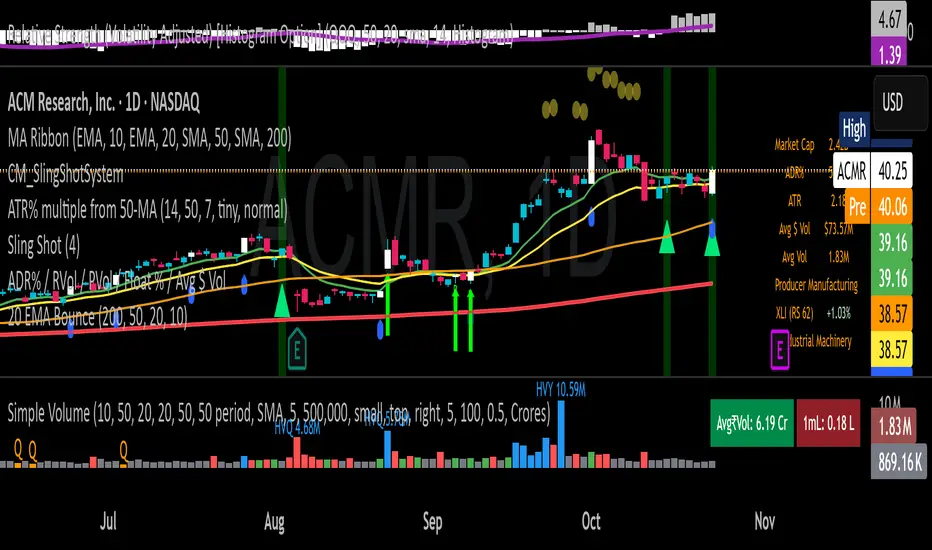
20 EMA Undercut Bounce - M4v3r1ck💎 The "EMA Undercut Bounce" Bullish Scanner
This indicator is designed to identify high-conviction continuation patterns where price makes a temporary dip for liquidity before resuming a powerful, established uptrend. It specifically looks for a bullish rejection off the 20-period Exponential Moving Average (EMA).
🎯 Strategy Logic
The signal is generated only on the Daily (1D) timeframe when the following five precise conditions are met on the most recent completed bar:
1. Price Action (The Undercut Bounce)
• Undercut: The bar's low price must have touched or temporarily traded below the 20-Day EMA.
• Rejection: The bar's close price must have fully recovered and closed above the 20-Day EMA. This is the classic sign of strong buying pressure defending a key support level.
2. Strong Trend Hierarchy (The Bullish Stack)
The moving averages must be perfectly stacked, confirming a robust multi-timeframe uptrend structure:
• 10-Day EMA > 20-Day EMA
• 20-Day EMA > 50-Day SMA
• 50-Day SMA > 200-Day SMA
3. Momentum Confirmation (The Upward Slope)
Both the 10-Day EMA and the 20-Day EMA must be rising from the previous day. This ensures that the short-term trend momentum is positive, ruling out signals during flat or turning markets.
💡 How to Use This Indicator
1. Timeframe: Ensure your chart is set to the Daily (1D) timeframe for accurate results.
2. Signal: A Green Background highlight and an Up-Arrow below the bar mark a confirmed signal.
3. Alerts: Use the built-in alert condition to set up notifications for stocks on your watchlist, allowing you to catch these high-quality setups without constantly monitoring charts.
This script is ideal for trend-following traders looking to enter a position after a healthy shakeout and confirmation of continued bullish commitment.
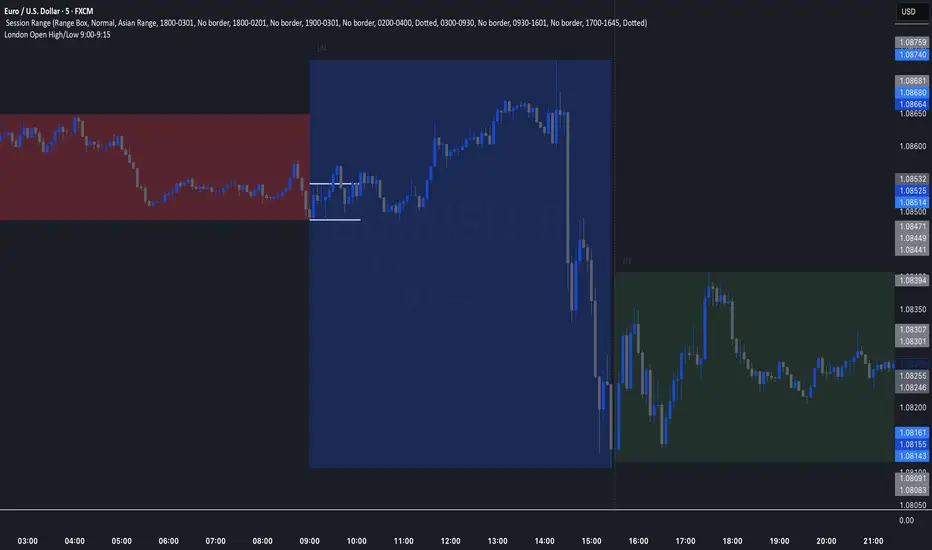
London Open High/Low 9:00-9:15indicator marks out high and low of the first 15 minutes of the London session.
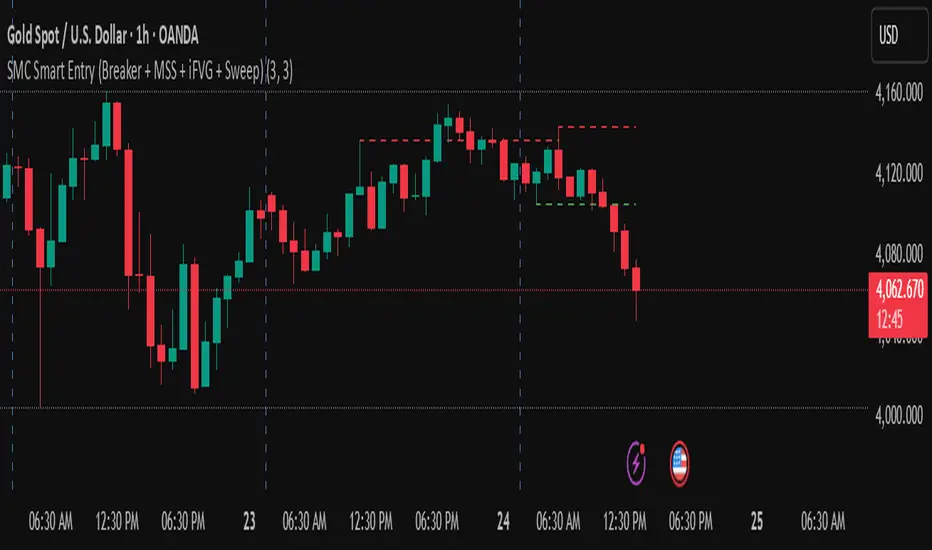
golden smart entrySmart Money Concepts (SMC) is a trading methodology that focuses on understanding and following the behavior of institutional investors—often referred to as "smart money." The goal is to identify high-probability trade setups by analyzing how these large players move the market.
UTS CORE + BOS + CHOCH – RR/TP/SL 📊 Indicator Working Principle
### 🔹 1. BOS (Break of Structure)
* **Definition:** Occurs when the price breaks the previous swing high or swing low level.
* **Interpretation:**
* If the last high is broken upwards → **Bullish BOS** (confirmation of uptrend).
* If the last low is broken downwards → **Bearish BOS** (confirmation of downtrend).
---
### 🔹 2. CHOCH (Change of Character)
* **Definition:** Indicates a trend reversal.
* **Interpretation:**
* In an uptrend, if the last low is broken downwards → **CHOCH↓** (start of downtrend).
* In a downtrend, if the last high is broken upwards → **CHOCH↑** (start of uptrend).
* **Chart:** Blue “CHOCH↑” labels on the chart mark trend reversals.
---
### 🔹 3. FVG (Fair Value Gap)
* **Definition:** A price gap formed between 3 candles.
* **Logic:**
* If the low of one candle stays above the high of the candle two bars back, a gap is created.
* Price tends to return to these gaps to “fill” them.
* **Chart:** The indicator highlights these gaps automatically (green/purple lines).
---
### 🔹 4. Signal Generation (BUY / SELL)
* A valid BOS or CHOCH confirmation + presence of FVG → **signal is triggered.**
* **Rules:**
* Upward break → **BUY signal**
* Downward break → **SELL signal**
* **Chart:** Red “SELL” and green “BUY” labels represent these trade signals.
---
### 🔹 5. RR – TP/SL Management
* When a trade is opened, the indicator automatically calculates **Entry, Stop Loss (SL), and Take Profits (TP1, TP2, TP3).**
* **Risk/Reward ratios:**
* TP1 = 1R
* TP2 = 2R
* TP3 = 3R
* If TP1 is hit and “Breakeven” option is enabled → SL moves to entry (risk-free trade).
---
👉 In short: this indicator tracks **market structure (BOS/CHOCH)**, detects **imbalances (FVG)**, and combines them with **risk/reward management (TP/SL)** to give you a ready-made trade

First X Days Of A YearFirst X-Day Indicator
Overview
The "First X-Day Indicator" is a powerful tool to visualize and analyze market sentiment during the crucial first trading days of each new year. It provides immediate visual feedback on whether the year is starting with positive or negative momentum compared to the previous year's close, a concept often related to market theories like the "January Effect" or the "First Five Days Rule."
The indicator is designed to be clean, intuitive, and fully customizable to fit your charting style.
Key Features
Yearly Baseline: Automatically draws a horizontal line at the previous year's closing price. This line serves as a clear 0% reference for the current year's performance.
Dynamic Background Coloring: For a user-defined number of days at the start of the year, the chart background is colored daily. Green indicates the close is above the previous year's close, while red indicates it's below.
Final Performance Symbol: At the end of the analysis period (e.g., on the 5th day), a single summary symbol (like 👍 or 👎) appears. This symbol represents the final performance outcome of the initial trading period.
Settings & Customization
You have full control over all visual elements:
Analysis Period: Define exactly how many days at the start of the year you want to analyze (e.g., 3, 5, or 10 days).
Line Customization: Fully control the yearly baseline's appearance. You can change its color, width, and style (Solid, Dashed, or Dotted) or hide it completely.
Symbol Customization: Choose any character or emoji for the positive and negative performance symbols. You can also adjust their size (Small, Normal, Large) or hide them.
Background Control: Enable or disable the daily background coloring and select your preferred custom colors for positive and negative days.

Previous session High/Low – Asia London USA Overview
This indicator automatically plots the Previous Day’s (PD) session Highs and Lows for the Asia (Tokyo), London, and USA (New York) trading sessions.
Each session is color-coded for clarity:
🟩 Asia (Green)
🟥 London (Red)
🟦 USA (Blue)
At the close of each session, the indicator records that session’s high and low, draws horizontal lines across the chart, and labels them neatly in the center of each range — above the high and below the low for perfect visual balance.
⚙️ How It Works
The script continuously tracks the current high and low within each session.
When a session closes, those values are locked in as the PD High and PD Low.
Clean lines and centered labels are drawn immediately.
The labels automatically offset slightly above or below the line to avoid overlap, with user-controlled spacing.
This helps traders quickly identify where price interacts with the previous session’s structure, a core concept for many session-based and liquidity-based strategies.
🧭 Sessions and Timezones
Each market session runs in its native timezone, so you can align them perfectly to your chart or your preferred trading hours:
Asia Session: Default 08:30 – 11:00 (Australia/Adelaide time)
London Session: Default 08:00 – 10:00 (Europe/London)
USA Session: Default 09:30 – 16:00 (America/New_York)
You can change each session’s hours and timezone from the Inputs panel.
🎨 Customization
In the Inputs menu you can:
Toggle each session on or off
Choose line color and thickness
Enable or disable labels
Adjust vertical offset (ticks) for label spacing
“High label offset” – moves label further above the high line
“Low label offset” – moves label further below the low line
These adjustments make it easy to keep charts clean and readable on any instrument or timeframe.
📈 Practical Use
This indicator is ideal for:
Session traders who mark PD Highs/Lows as liquidity zones
London or NY session scalpers who watch for breakouts, fakeouts, or reversals
ICT / Smart Money Concepts users wanting automatic session reference levels
Anyone wanting a quick visual map of inter-session structure
