Volume and Price Moving average StrategyNAME : Volume and Price Moving average Strategy
SUMMARY
Long when Indicator >= BuyandSell
Short when Indicator < BuyandSell
It is an index created by combining the moving average of trading volume and price.
To avoid future reference, you must set the Candle Chart time and Resolution Time equally.
If you set it differently, there is a gap in yield due to future reference.
For MA Type and MA period, it is to select what the moving average of the price will be set to.
For Indicator Value, it is about the set value of this indicator.
Price Type is what to use for price. Market price, low price, closing price, high price, typical price (market price + high price + low price) / 3, center (market price + high price) / 2
There are six types.
BuyandSell is to set the index value to enter and clear. The default is 0.
Although it can be set to 0 or more, there is a risk of over-optimization.
As you can see from the profit curve, Bitcoin is a good strategy that works well when volatility is high.
MDD is too large to operate with this indicator alone, so it would be good to use it with other indicators.
If you leave a good indicator comment, I'll test it. Thank you.
==========================
Korean
거래량과 가격의 이동평균을 조합하여 만든 지표입니다.
미래참조를 피하기 위해서는 반드시 캔들 차트의 시간과, Resolution Time을 똑같이 설정해야 합니다.
다르게 설정할 경우 미래참조로 인한 수익률 괴리가 생기니 꼭 똑같이 설정해주세요.
MA Type, MA period의 경우 가격의 이동평균을 무엇으로 설정할 것인지 선택하는 것 입니다.
Indicator Value의 경우 이 지표의 설정 값에 대한 것입니다.
Price Type은 가격으로 무엇을 사용할 것인지 입니다. 시가, 저가, 종가, 고가, Typical Price (시가+고가+저가)/3, Center(시가+고가)/2
이렇게 6종류가 있습니다.
BuyandSell은 진입, 청산할 지표값을 세팅하는 것입니다. 기본값 0입니다.
0이상, 이하로도 설정할 수 있지만, 그렇게 할 경우 과최적화의 위험이 있습니다.
수익 곡선을 보시면 아시겠지만 비트코인이 변동성이 클 때 잘 먹히는 좋은 전략입니다.
이 지표만으로는 MDD가 너무 커서 운용하기 힘드니 다른 지표와 같이 활용하시면 좋을 것 같습니다.
좋은 지표 코멘트로 남겨주시면 테스트 해보겠습니다. 감사합니다.
Indicador de Volume

Trend spider glueThis script works on all market types.
This script will show you when to long, short, exit (stop loss) and Take profit.
Signals take into account various elements such as momentum, volume , moving averages and long term trend analysis. Stop loss function is included to show you when a signal is invalidated.
Use this strategy strictly, patiently and with discipline to prevent unneeded losses, this will result in long term consistent profits.
This script has been set to work best on the intraday time frames, however it also works on the longer timeframes. Use the settings tab to dilute the indicators to ur own market.
Lastly, this indicator will not give signals if the market is not trending.
PM me here to get a free trial for the indicator !
HAPPY TRADING <3
Version 2 will be coming soon which will integerate more elements to allow for more accurate signals and faster stop losses !
disclaimer: although this indicator is taking many elements into account and is highly accurate the market is never certain, we are not responsible for any losses the script may result in as we are not financial advisors.

On Balance Volume with CrossOBV indicator with a few key changes that can turn it into a filter or trading indicator as-is.
Volume calculation given a look-back to help clarify trends without smoothing lag
Change the source (HLC3 indicates a little faster in backtesting)
Smooth the signal if desired
Moving average (MA) added for crossover indication in trend change
MA can be either EMA or HMA**
** My personal use:
EMA for trend filtering trades: Trade long signals if OBV is above the MA, trade short signals if OBV is below the MA.
HMA for scalping and chop: Normally set the HMA to 20 or 15 and trade the crosses. Works on most time frames and generates a lot of noise. 5 min and 15 min seems best for me in day trading
Example of trend trading using only the OBV-C and no other indicators, stops, or trailing stops:
This could obviously be improved using stops, trailing stops, or other indicators to filter when to enter & exit trades or mitigate loss.
Example of trading using the HMA and lower time frames with Elder's Force Index (EFI) used as a filter. Trade with both cross at or very near the same time. Winning trades in green:

[fikira] Volume + MTF MAVolume normally has 1 Moving Average (standard orange coloured)
This script gives 1 extra Moving Average (default blue coloured)
BOTH MA can be shown with Multi Time Frames,
based on the most excellent work of "PineCoders"
(MTF Selection Framework functions)!
This can provide more insights, also the crossovers can be interesting!
So, default there are 2 MA's of the present Time Frame + extra 2 TF's of these MA's
(default 2 and 4 times of the present TF)
All can be enabled/disabled,
Only 1 MA:
With labels and values:
Here 2 MA but + only 1 extra TF:

OBV Traffic LightsThe idea with On-balance volume (OBV) is to see price movement based on volume instead of the distance between the open and close of a candle. This can be used to find the relationship between volume and price action much easier than normal volume bars.
This version spices the OBV up a bit by basing it off of the current and previous close of the Heikin Ashi of the current bar, as well as adding "traffic light"
moving averages to the mix to get a better grasp of trends and when volume has shifted direction as well as by how much.
Thanks to Peter Whipp for the original idea of using the OBV with traffic light moving averages, as well as the default settings for them.

Volume Profile [Makit0]VOLUME PROFILE INDICATOR v0.5 beta
Volume Profile is suitable for day and swing trading on stock and futures markets, is a volume based indicator that gives you 6 key values for each session: POC, VAH, VAL, profile HIGH, LOW and MID levels. This project was born on the idea of plotting the RTH sessions Value Areas for /ES in an automated way, but you can select between 3 different sessions: RTH, GLOBEX and FULL sessions.
Some basic concepts:
- Volume Profile calculates the total volume for the session at each price level and give us market generated information about what price and range of prices are the most traded (where the value is)
- Value Area (VA): range of prices where 70% of the session volume is traded
- Value Area High (VAH): highest price within VA
- Value Area Low (VAL): lowest price within VA
- Point of Control (POC): the most traded price of the session (with the most volume)
- Session HIGH, LOW and MID levels are also important
There are a huge amount of things to know of Market Profile and Auction Theory like types of days, types of openings, relationships between value areas and openings... for those interested Jim Dalton's work is the way to come
I'm in my 2nd trading year and my goal for this year is learning to daytrade the futures markets thru the lens of Market Profile
For info on Volume Profile: TV Volume Profile wiki page at www.tradingview.com
For info on Market Profile and Market Auction Theory: Jim Dalton's book Mind over markets (this is a MUST)
BE AWARE: this indicator is based on the current chart's time interval and it only plots on 1, 2, 3, 5, 10, 15 and 30 minutes charts.
This is the correlation table TV uses in the Volume Profile Session Volume indicator (from the wiki above)
Chart Indicator
1 - 5 1
6 - 15 5
16 - 30 10
31 - 60 15
61 - 120 30
121 - 1D 60
This indicator doesn't follow that correlation, it doesn't get the volume data from a lower timeframe, it gets the data from the current chart resolution.
FEATURES
- 6 key values for each session: POC (solid yellow), VAH (solid red), VAL (solid green), profile HIGH (dashed silver), LOW (dashed silver) and MID (dotted silver) levels
- 3 sessions to choose for: RTH, GLOBEX and FULL
- select the numbers of sessions to plot by adding 12 hours periods back in time
- show/hide POC
- show/hide VAH & VAL
- show/hide session HIGH, LOW & MID levels
- highlight the periods of time out of the session (silver)
- extend the plotted lines all the way to the right, be careful this can turn the chart unreadable if there are a lot of sessions and lines plotted
SETTINGS
- Session: select between RTH (8:30 to 15:15 CT), GLOBEX (17:00 to 8:30 CT) and FULL (17:00 to 15:15 CT) sessions. RTH by default
- Last 12 hour periods to show: select the deph of the study by adding periods, for example, 60 periods are 30 natural days and around 22 trading days. 1 period by default
- Show POC (Point of Control): show/hide POC line. true by default
- Show VA (Value Area High & Low): show/hide VAH & VAL lines. true by default
- Show Range (Session High, Low & Mid): show/hide session HIGH, LOW & MID lines. true by default
- Highlight out of session: show/hide a silver shadow over the non session periods. true by default
- Extension: Extend all the plotted lines to the right. false by default
HOW TO SETUP
BE AWARE THIS INDICATOR PLOTS ONLY IN THE FOLLOWING CHART RESOLUTIONS: 1, 2, 3, 5, 10, 15 AND 30 MINUTES CHARTS. YOU MUST SELECT ONE OF THIS RESOLUTIONS TO THE INDICATOR BE ABLE TO PLOT
- By default this indicator plots all the levels for the last RTH session within the last 12 hours, if there is no plot try to adjust the 12 hours periods until the seesion and the periods match
- For Globex/Full sessions just select what you want from the dropdown menu and adjust the periods to plot the values
- Show or hide the levels you want with the 3 groups: POC line, VA lines and Session Range lines
- The highlight and extension options are for a better visibility of the levels as POC or VAH/VAL
THANKS TO
@watsonexchange for all the help, ideas and insights on this and the last two indicators (Market Delta & Market Internals) I'm working on my way to a 'clean chart' but for me it's not an easy path
@PineCoders for all the amazing stuff they do and all the help and tools they provide, in special the Script-Stopwatch at that was key in lowering this indicator's execution time
All the TV and Pine community, open source and shared knowledge are indeed the best way to help each other
IF YOU REALLY LIKE THIS WORK, please send me a comment or a private message and TELL ME WHAT you trade, HOW you trade it and your FAVOURITE SETUP for pulling out money from the market in a consistent basis, I'm learning to trade (this is my 2nd year) and I need all the help I can get
GOOD LUCK AND HAPPY TRADING

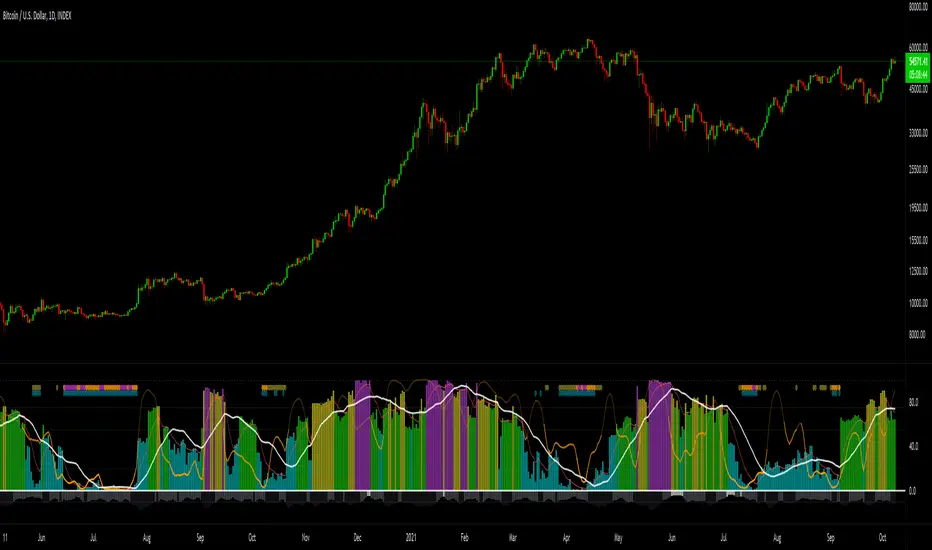
Borjas Tarh Explosive PivotsBorjas Tarh Explosive Pivots
This indicator includes:
1. Historical Volatility Percentile ( HVP ) +SMA+EMA
Core Idea (balipour) :
HVP Code Help (semiotic) : www.tradingview.com
For the Detailed Description read the Core (HVP) Idea indicator by "balipour" above.
2. Bollinger Bands Width ( BBW )
It's an Oscillation of BBW So it's trapped between 0 to 100. (And Lightly Smoothed)
3. Volume Oscillator
The Volume is oscillated so it's trapped between 0 and -30. (And Lightly Smoothed)
Below 10 Means the Volume in the context of the Candle Volume is pretty low.
4. The Shapes
These Shapes are based of all factors above.
D ( Blue ) : HVP is pretty Low. An Explosive Move is Coming.
A ( Yellow ) : An Explosive Move is Building Up.
B ( Orange ) : An Explosive Move is Near.
C ( Purple ) : An Explosive Move Will Happen Very Soon.
There is an Alternative Set:
On = Annual HVP and Default BBW .
Off = Fibonacci HVP and BBW .
© mrhashem
© Borjas Tarh Company

Average Volume at Time (AVAT)Calculation of average volume at current time for a number of previous sessions, known as Average Volume at Time (AVAT).
Inputs:
* period to use for accumulation. "D" is the default value, useful to view data for each session.
* number of previous sessions to average
TODO: more intelligent accumulation of number of bars in a session, since there may be sessions with different values
TODO: interpolate volume according to current time, inside of the last bar

Cumulative VolumeThe script shows how to accumulate volume values during a defined session/period.
The input is the period to use for accumulation. "D" is the default value, useful to view data for each session.

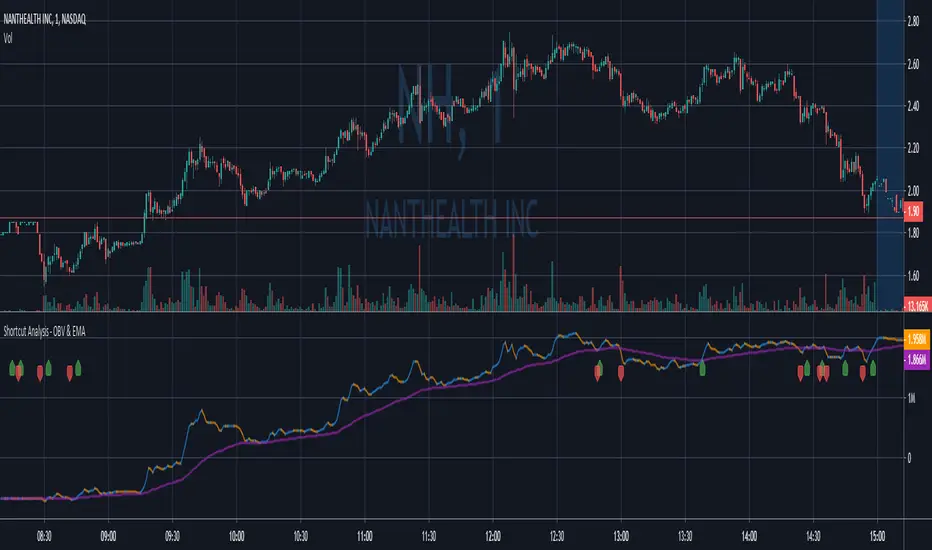
Shortcut Analysis - On-Balance Volume with EMAOn-Balance Volume indicator with the following features:
- Smoothing of the OBV line if you'd like (Default is set to 2 period SMA ).
- Color differences to show if the OBV line is higher or lower than it's previous valure.
- EMA of the OBV line to provide crossover/crossunder signals (Default is set to 50 periods).
- Symbols indicating crossover/crossunder of the OBV line on the EMA
Exhausted Volume (Expo)Exhausted Volume (Expo)
DESCRIPTION
Exhausted Volume (Expo) indicator visualize exhausted volume. Exhaustion often signals the reversal of a current trend because it illustrates excess levels of supply or demand, indicating a market is either overbought or oversold.
The indicator can also be used to detect volume pressure in either direction which can occur in breakouts or in reversal points. The input variable ‘Volume Length’ can be changed. A longer Volume length means that the indicator detects bolder exhausted volume.
• Volume pressure is seen in reversal points.
• Volume pressure can be seen in breakouts.
The indicator is also equipped with exhausted volume signals that are more sensitive. This is visualized with arrows up and down. The investor has the ability to adjust the sensitivity of these signals.
HOW TO USE
1. Use the indicator to identify exhausted volume
2. Use the indicator to identify volume pressure.
3. Use the indicator to identify reversal points.
4. Use the indicator to identify breakouts.
Combine the indicator with ‘ Climax Volume (Expo) ’
INDICATOR IN ACTION
EURUSD
EURUSD
BTCUSD
BTCUSD
The indicator works with RENKO, HEIKIN ASHI and with KAGI charts as well.
I hope you find this indicator useful, and please comment or contact me if you like the script or have any questions/suggestions for future improvements. Thanks!
I will continue to work on this indicator, so please share your experience and feedback with me so that I can continuously improve it. Thanks to everyone that have contacted me regarding my scripts. Your feedback is valuable for future developments!
ACCESS THE INDICATOR
• Contact me on TradingView or use the links below
-----------------
Disclaimer
Copyright by Zeiierman.
The information contained in my scripts/indicators/ideas does not constitute financial advice or a solicitation to buy or sell any securities of any type. I will not accept liability for any loss or damage, including without limitation any loss of profit, which may arise directly or indirectly from use of or reliance on such information.
All investments involve risk, and the past performance of a security, industry, sector, market, financial product, trading strategy, or individual’s trading does not guarantee future results or returns. Investors are fully responsible for any investment decisions they make. Such decisions should be based solely on an evaluation of their financial circumstances, investment objectives, risk tolerance, and liquidity needs.
My scripts/indicators/ideas are only for educational purposes!

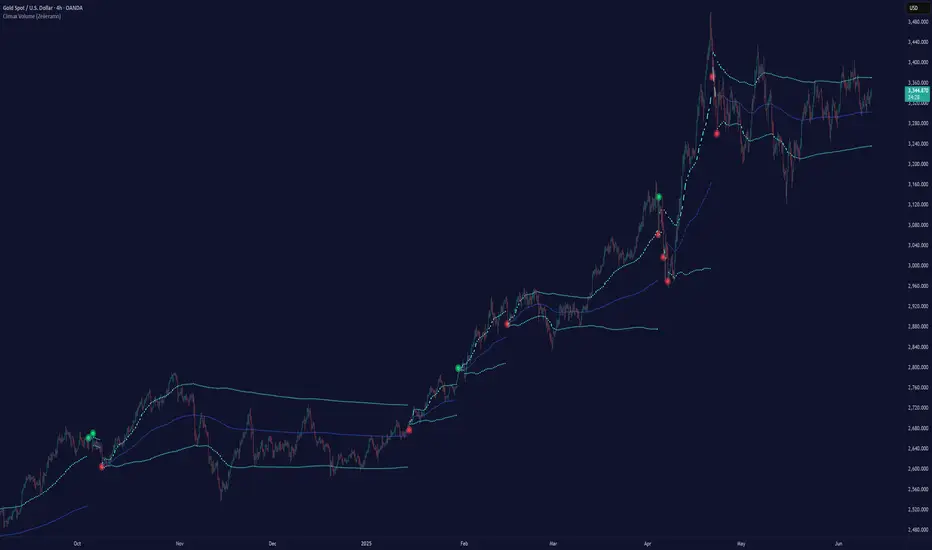
Climax Volume (Zeiierman)█ Overview
Climax Volume (Zeiierman) isolates extreme participation events to pinpoint when price action reaches exhaustion. These moments of volume climax often precede reversals, pauses, or key balance shifts, offering traders an early read on changing market dynamics. Instead of treating volume as a passive tally, it locates climax bars, abnormally large activity bursts, and anchors a Point of Control (PoC) that tracks where post-climax transactions concentrate. The result is a clear read on when participation is peaking, where value re-centers afterward, and how far price can reasonably deviate before reverting.
This tool is designed for multi-context use, such as intraday execution, swing confirmation, or structural bias analysis, offering a precise view of where volume matters, not just how much.
⚪ Why This One Is Unique
Unlike conventional volume-spike indicators, Climax Volume (Zeiierman) integrates adaptive extremum detection, a dynamic PoC core, and multi-layer deviation envelopes that evolve in real time with market context.
Internally, it fuses bid–ask volume delta modeling with re-normalized dispersion mapping to measure the directional imbalance driving each climax event. The system continuously evaluates delta asymmetry between buying and selling pressure to refine the detection of true participation extremes. This allows the engine to differentiate between constructive volume expansion (trend continuation) and exhaustive volume spikes (potential reversals).
█ Main Features
⚪ Climax Volume
The Climax Volume Engine isolates statistically significant bursts in participation that indicate potential turning points or exhaustion phases. It identifies climax bars—instances where volume reaches regime-level extremes relative to recent activity—and classifies them as bullish (green) or bearish (red) based on directional dominance. These events highlight where aggressive activity peaks and often mark the start of structural imbalance, providing early cues for reversal, absorption, or renewed continuation.
⚪ Point of Control (PoC)
Each climax event dynamically re-anchors a Point of Control (PoC)—the evolving price center of post-climax volume distribution. The PoC tracks where transaction density stabilizes after an extreme burst, forming the reference core of a control zone. From this anchor, the system projects upper and lower tolerance bands to define acceptable deviation ranges, contextualizing how far the price can travel before reverting or rebalancing.
█ How to Use
⚪ Trend Following
Use the Volume Point of Control (PoC) as a dynamic guide to assess directional bias. The PoC effectively acts as a moving equilibrium line, continuously updating to reflect where trading volume and market influence are concentrated.
When price holds above the PoC, it signals sustained bullish sentiment and active accumulation.
When the price remains below, it confirms bearish control and ongoing distribution.
⚪ Trend Continuation Retests
The slope of the PoC reflects the strength and persistence of market momentum. The steeper the PoC slope, the stronger the active momentum. A flat or neutral PoC typically signals consolidation or low conviction — conditions better avoided for trend trades.
In a bullish scenario , watch for the price to retest the PoC or the lower tolerance band after a pullback. A successful rejection of that zone often signals that buyers are defending control, providing a high-probability continuation entry.
In a bearish scenario , when the PoC slopes downward, wait for the price to retest it from below. If the market fails to reclaim that level, it indicates that sellers remain dominant, and downside momentum is likely to continue.
⚪ Reversals
Climax Points — the color-coded circles that appear during moments of extreme volume. These signals indicate that the market may soon pause, reverse, or rotate back toward the PoC equilibrium.
🟢 Bullish Climax Points emerge when heavy buying reaches unsustainable levels, often signaling a buyer exhaustion event or a possible local top formation.
🔴 Bearish Climax Points form during high-intensity selling bursts, warning of seller exhaustion and potential bottoming conditions.
⚪ Confirm Breakouts
High-volume breakouts confirmed by Climax Volume signals often mark the initiation of strong directional moves. When climax confirmation aligns with a structural break, it validates that the breakout is backed by genuine participation — not just thin volatility spikes — increasing the probability of follow-through and trend expansion.
Identify a key support or resistance zone manually or with your preferred structural tool.
Wait for a climax signal to coincide with a break beyond that level.
For bullish breakouts , a green climax point appearing as price pushes above resistance confirms that buyers are stepping in with conviction.
For bearish breakouts , a red climax point forming as price drops through support indicates that real selling pressure is driving the move.
█ How It Works
⚪ Climax Detection
Identifies participation surges within a dynamic volume–price field to isolate genuine activity extremes rather than simple bar-size anomalies.
Calculation: Utilizes adaptive extremum detection on a re-normalized volume–delta composite with regime-sensitive thresholds and variance filters to extract statistically valid climax events.
⚪ Point of Control (PoC)
Defines the evolving price centroid where post-climax transactions cluster, continuously adapting to shifting participation density.
Calculation: Employs a volume-weighted delta balance framework with incremental accumulation and curvature-preserving smoothing, ensuring stability while maintaining local reactivity to order-flow asymmetry.
⚪ Tolerance Bands
Outlines a probabilistic corridor around the PoC that distinguishes expected fluctuation from meaningful deviation.
Calculation: Implements variance-aware dispersion modeling with contextual weighting derived from real-time delta gradients, projecting symmetric envelopes scaled by adaptive multipliers.
-----------------
Disclaimer
The content provided in my scripts, indicators, ideas, algorithms, and systems is for educational and informational purposes only. It does not constitute financial advice, investment recommendations, or a solicitation to buy or sell any financial instruments. I will not accept liability for any loss or damage, including without limitation any loss of profit, which may arise directly or indirectly from the use of or reliance on such information.
All investments involve risk, and the past performance of a security, industry, sector, market, financial product, trading strategy, backtest, or individual's trading does not guarantee future results or returns. Investors are fully responsible for any investment decisions they make. Such decisions should be based solely on an evaluation of their financial circumstances, investment objectives, risk tolerance, and liquidity needs.
Script pago
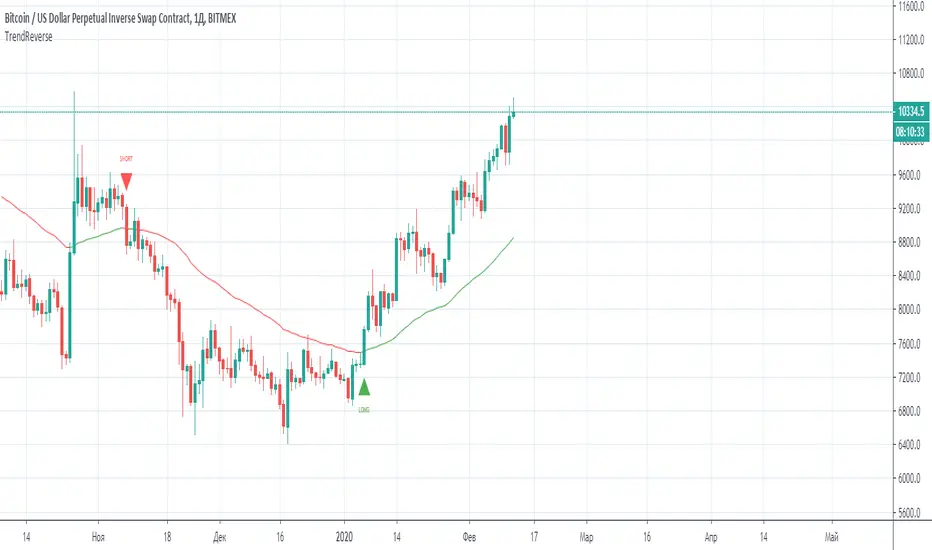
Trend Following or Mean RevertingThe strategy checks nature of the instruments. It Buys if the close is greater than yesterday's high, reverse the position if the close is lower than yesterday's low and repeat the process.
1. If it is trend following then the equity curve will be in uptrend
2. If it is mean reverting then the equity curve will be downtrend
Thanks to Rayner Teo.

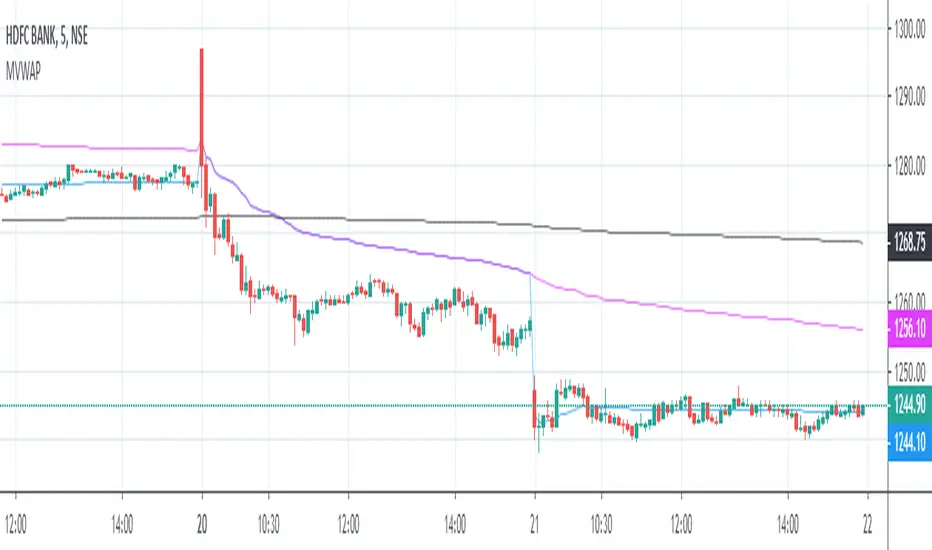
Multiple VWAPAn intraday indicator which plots the 3 different VWAP.
1. D-VWAP shows VWAP from the first candle of the day
2. W-VWAP shows VWAP from the first candle of the week
3. M-VWAP shows VWAP from the first candle of the month