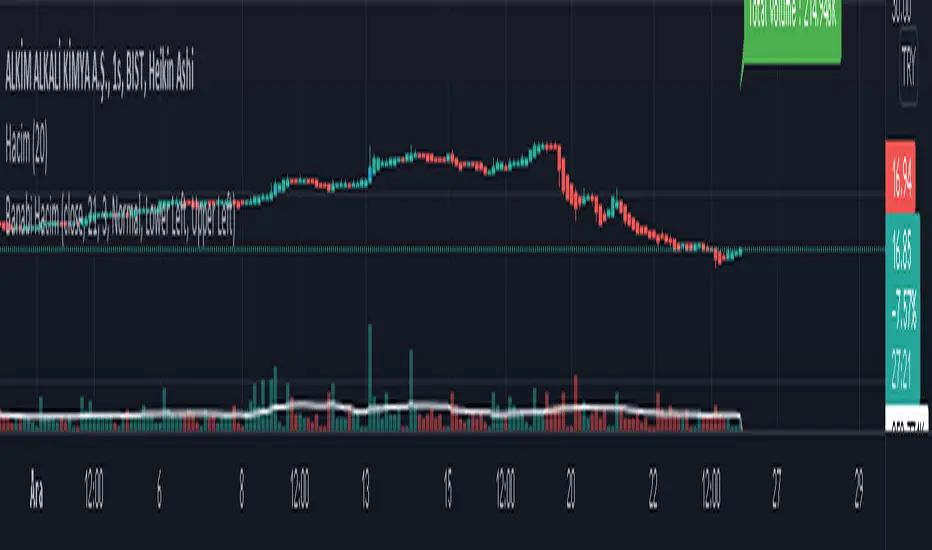
Banabi Hacim by HassonyaThe Banabi Hacim indicator shows you the movement of volume in the last bar in terms of percentage buying and selling directions. You can use it in any period you want. It is designed to help you and give you ideas for buying or selling. It will be your assistant in critical places where you are thinking of buying or selling.
Thanks for supports
TÜRKÇE AÇIKLAMA
Banabi Hacim indikatörü size son barda gerçekleşen işlem hacim hareketini yüzdesel olarak alış ve satış yönlü olarak gösterir. İstediğiniz periyotta kullanabilirsiniz. Alım yada satım yapmak için size yardımcı olmak ve fikir vermek için tasarlandı.
Destekleriniz için teşekkürler
Hayrını görün sevgiler
Indicador de Volume
Delta Volume Weighted - IntradayResets at the start of the day's session (9:50 am on the ASX).
Takes the first candle and checks if its a green candle (close > open), and adds the volume to a total (which starts at 0 at the start of the day).
Subtracts it if the candles in red.
Continues to do this along with all the candles.
The volume is also multiplied by the difference between open and close so that large candles with large volume have more weight and move the indicator more.

Cumulative Volume AverageHey traders!
I've received dozens of requests for this style of Cumulative Volume indicator over the past year since I released my RVOL By Time and standard RVOL indicators.
After studying Pine Script deeply and using a bit of old fashioned trial and error over the past few months, I finally got it to work!
This script adds up the cumulative volume throughout any given trading day (the blue & green volume bars) on any given intraday timeframe on any given market - and then it compares that cumulative volume value to the total volume of the previous day AND the average cumulative volume of the previous X days for whatever time of day the current bar is printing on.
By default it compares today's cumulative volume to yesterday's, but you can set the Lookback higher in the settings menu if desired.
It even takes into consideration random gaps in price action (unlike my RVOL By Time indicator) – so as far as I can tell, it’s as accurate as I can possibly make it.
However it does not work on extended hours for stocks so don’t use it if you have pre-market hours enabled. And there is an inbuilt limitation to how many bars a script can reference on TradingView, so on 5-minute timeframes and lower your Lookback period will be limited and may crash the script if you set it too high.
The PURPLE LINE is the total volume of the previous day.
The GRAY COLUMN is the average cumulative volume of the previous X days.
The COLORED COLUMN is the current cumulative volume for the current bar.
The BLACK LINE is the Previous Cumulative Volume Line which represents the average cumulative volume for the past X days. It only draws if today’s CV exceeds the average – this is useful for comparing exactly how far today’s cumulative volume exceeds the average, but it can be turned off in the Style menu if you don't want it there.
The ORANGE NUMBER is the ratio of today's CV compared to the average (CV ÷ Average CV).
If the current cumulative volume is less than the previous day's cumulative volume for that time of day, the bar is blue.
If the current cumulative volume is greater than the previous day's cumulative volume for that time of day, the bar is dark green.
If the current cumulative volume is greater than the previous day's total volume, the bar is bright green.
This script also comes with alert functionality.
You can set a Cumulative Volume Alert which will trigger an alert if the current bar's cumulative volume exceeds the average cumulative volume for that time of day.
You can also set a Total Cumulative Volume Alert which will trigger an alert only if the current bar's cumulative volume exceeds the total volume of the previous day.
And you can set a CV Ratio Alert which will trigger an alert if today's CV ÷ Average CV >= Specified Ratio.
Apart from that, the script is fairly self-explanatory so I hope you enjoy using it!
Check my signature for a link to the source code + all my other indicators.
Good luck with your trading, and feel free to drop any suggestions or bug reports and I'll do my best to help out :)
Kind regards,
Matthew

Market EmotionsThis is a simple and fun indicator I built out of boredom one night. It's great for a quick laugh, but other than that, it's useless. It simply displays emotes for various thresholds of change in price between the open and close of a candle. For example, unicorn candles are any candles that gain 25% or more from opening price to closing price.

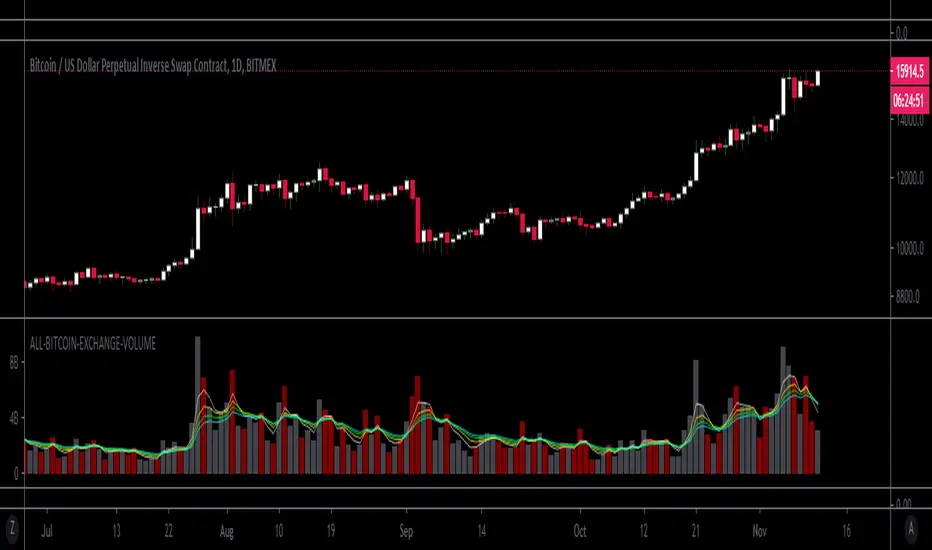
"ALL" BITCOIN EXCHANGE VOLUME + 4EMAsThis indicator includes 16 Spot and Futures BTC exchanges and a 4 EMA fan to signify increasing or decreasing volume trends.
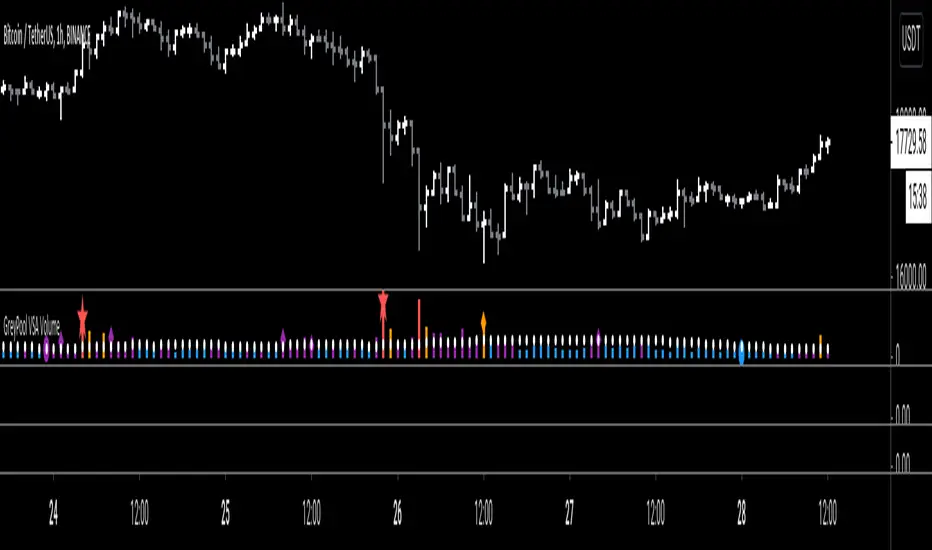
GreyPool VSA VolumeGreyPool VSA Volume Indicator
Color Key:
Blue = Below Average or Low Volume
Purple = Average Volume
Orange = High Volume
Red = Very High Volume
Symbol Key:
Circle = Test on Low Volume
Diamond = TrapUp or TrapDown Bar on High or Very High Volume
Star = Climactic Action Bar
Background Highlight Key:
Green Background = Last 3 bar were increasing high or very high volume including a climactic action DOWN bar or trap DOWN bar
Red Background = Last 3 bars were increasing high or very high volume including a climactic action UP bar or trap UP bar
Available Alerts:
When a Green or Red background appears
When a Climactic Action Up or Down bar appears
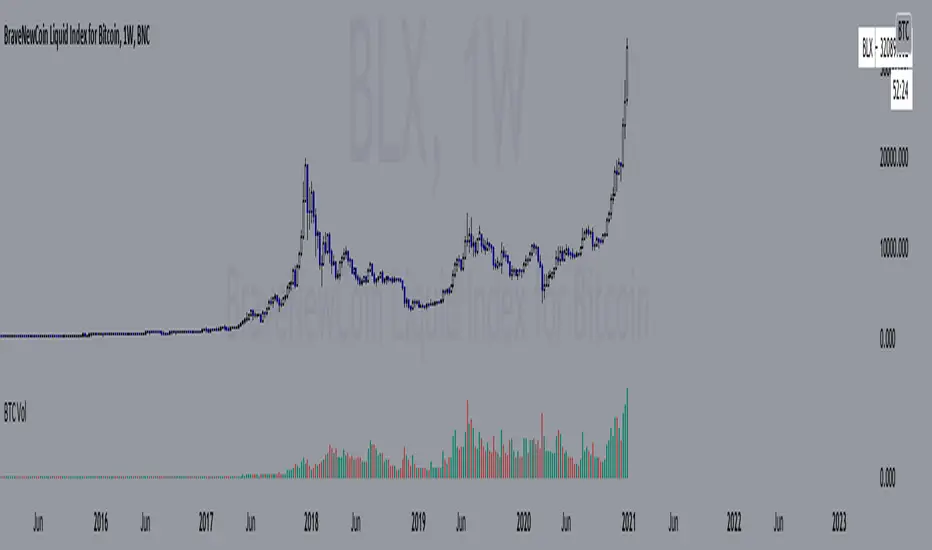
Aggregate BTC VolumeSimple script that shows the aggregate volume of BTC, taking volume data from top spot and derivative exchanges.
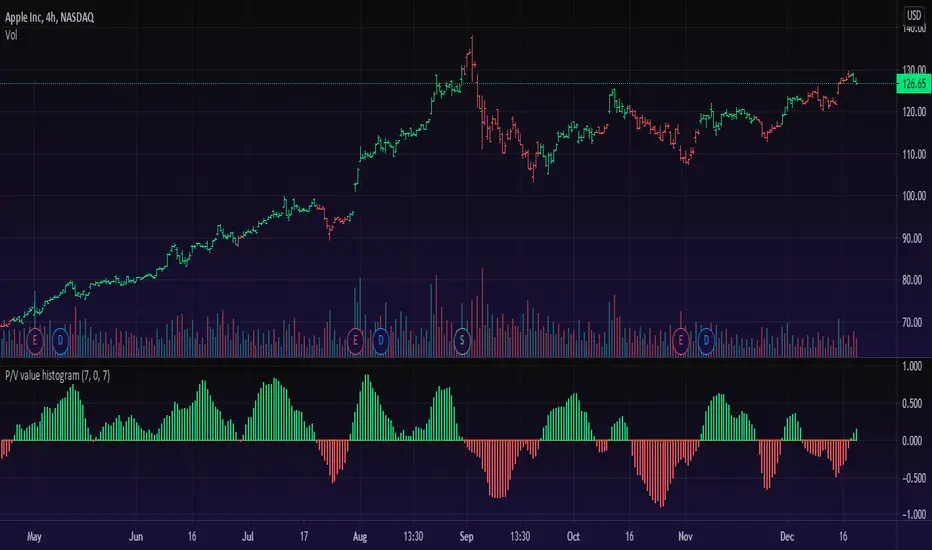
Price/Volume Value HistogramAn interesting implementation of mine to measure an asset changes based on asset price velocity and volume velocity. The indicator acts as asset value calculator. Long and Short.
==Points System Rules==
UPTRENDING
If Current Close is higher than previous Close and Current Volume is bigger than previous Volume: Adds Close Points and Volume Points
Otherwise check
If Current Close is higher than previous Close: Adds Only Close Points
DOWNTRENDING
If Current Close is lower than previous Close and Current Volume is bigger than previous Volume: Reduces Close Points and Volume Points
Otherwise check
If Current Close is lower than previous Close: Reduces Only Close Points
==Plotting==
Result of the values are summed up to a histogram.
Obviously on increasing prices and volume the histogram will be above zero line and on the Bullish side (green color), otherwise, on the Bearish side (red color).
You can't cheat the price movement, it's just what it is.
Optional to smooth it by EMA (set to true by default).
Like if you Like and Enjoy!
Follow for upcoming indicators.
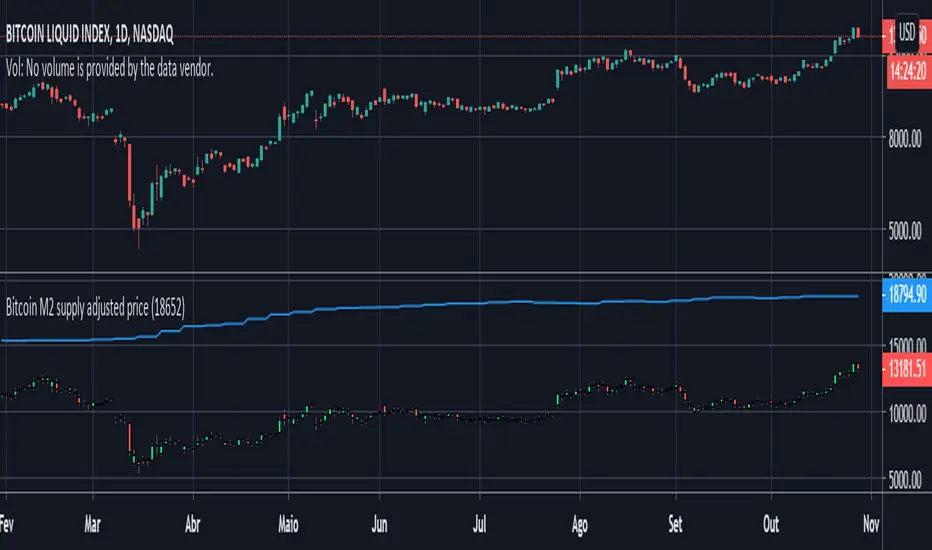
Bitcoin M2 supply adjusted priceThis script plots bitcoin candles adjusted by M2 supply (blue line), helping the trader to obtain insight of new support/resistance levels adjusted by M2 supply.
Note: As it was not possible to make the price adjust automatically by the last M2 value (pinescript limitation, I guess), the input parameter "M2Last" must be updated manually observing the last M2 value in blue curve.
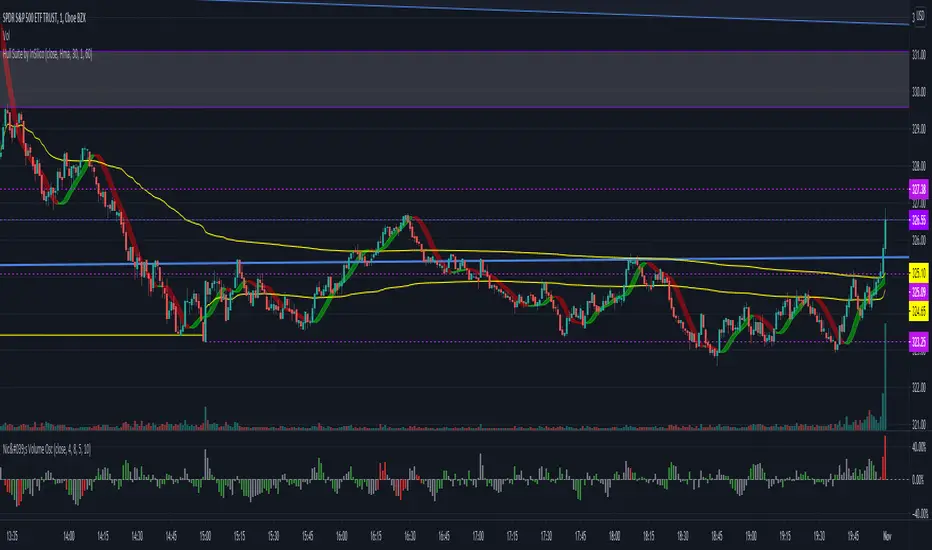
Volume Brakeout v1Volume Brakout indicator is used to help determine trend direction strictly based on Negative and Positive volume data.
How to Read:
- Moving Average crossovers are used to help determine a possible trend change or retracement.
- The area cloud on the bottom is calculated by the difference of the moving averages. This could be used to help determine the trending volume strength.
- Bright colored volume bars are large volume spikes calculated by the x factor in the options.
Other changes:
- Volume Depth is going open source with numerous of its indicators. This is only one of many!
- Volume is now displayed without being altered for calculations.

Custom VWAP With TPHello everyone its base on vwap indicator (Volume Weighted Average Price)
How to work its indicator?
➤ Long = if open bar above vwap
➤ Short = if open bar below vwap
Note: we are using internal once per bar close its mean indicator not repainted
Indicator Feature
➤ Long Side Signal With Alerts
➤ Short Side Signal With Alerts
➤ Long side Take profit Calculated By Open Bar You Can Also Change Calculate Percent input
➤ Short side Take profit Calculated By Open Bar You Can Also Change Calculate Percent input
➤ there are 4 Takes profit from Long side with Alerts
➤ there are 4 Takes profit from short side with Alerts
➤ Indicator signal Starting time by default Indian NSE market Open time
➤ Close Trade with time you can also alert closing time by default 15:15 GMT+5:30
Important: This Indicator we are using for Automation Trading if You Want This Indicator Access Please Contact me PM on Tradingview

MVolume‴ | Multi Volume Indicator‴Hello Traders!
This simple but yet efficient indicator view presents the Volume with the following benefits:
1. both buyer and seller volume are shown separately and above zero line, this way its possible to see which side is dominant;
2. both buyer and seller volume are shown separately, with buyers above the zero line and sellers bellow the zero line. The dominant side is shown in its darker color version;
3. 20 period Moving Average line is calculated separately and plotted for each side (buyer/seller);
4. 50% of the 20 period Moving Average line is calculated separately and plotted for each side (buyer/seller);
5. possibility to apply Directional OHLC values to enhance the buyer/seller movement interpretation.
p.s.: the chart presents two MVol indicators to let you see the different possible views.
To request access to this invite-only script, please DM me.
Cumulative Volume v3The script, for Pine Script version 3, shows how to accumulate volume values during a defined session/period.
The input is the period to use for accumulation. "D" is the default value, useful to view data for each session.
This is slower than version 4 because there is no "var" and you need to use a loop. Also, you can't use "sum( volume , cnt_new_day)" with a variable length argument instead of "for".

DePriExchange weighted price for cryptocurrencies
DECENTRALIZED PRICE CHART FOR DECENTRALIZED WORLD
See non-manipulated , globally price action that comes from whole liquidity!
The main idea behind this script is that...
The value of each trading pair finally determined globally and the price displayed in exchanges is its own and not global! differences between exchanges, reduced to near zero gradually by market makers and arbitrages, so..
Every min tick price changes Must be backed by liquidity to be part of the global fluctuations
more liquidity gives it more credibility
more credibility give it more weight
..Against opposing movements.
This script can collect price of crypto pairs from 12 exchanges that listed on TV and have effective volume.
In the first step, summarizes the volume of all exchanges and creates the total volume
In the next step, divide each exchange volume to total volume to obtain relative weight of each exchange.
In the final step, multiply each exchange price to weight of itself and summarizes these numbers .. now, we have Exchange weighted price!
The results on high liquidity pairs like BTCUSDT, ETHUSDT, is not much differ then simple chart but when you apply it on lower liquidity, lower time frames of altcoins, you realize its benefits and usefulness. Altcoins chart in composite and simple mode is very differ, I hope you enjoy from TRUE CHART.
With this, also you can..
Filter and smooth candlestick chart with SMA or EMA
Plot a line chart of pair at your desired frame separate from the main chart for monitor important price levels
Get realtime report of whole volume of pair on included exchanges
Get realtime report of each exchange weight and share
Note.1:
some of pairs queted on more than one like BTCUSD, BTCUSDT, BTCUSDC and etc. In this pairs we choose the one that usually has more volume on that exchange.
Note.2:
At this time, supported queted currencies are BTC, ETH, USD, USDT, BUSD, USDC, USDK.
Note.3:
This script is relatively heavy! This is not cuz of bad coding.
Each bar compution contains at least one plot and some of security calls, so 10 to 15 seconds is normal load time.
Note.4:
You can combine this with your price action base scripts and use balanced OHLCV. The necessary explanations about this are available in the code.
Note.5:
You must only include exchanges that support your ticker, Otherwise you will receive an error.
I hope it comes useful to you.

DAX VolumeDAX index (DEU30) hourly volume indicator, which is obtained by adding the sum of the underlying stocks volume.
The volume is displayed in millions of EUR.

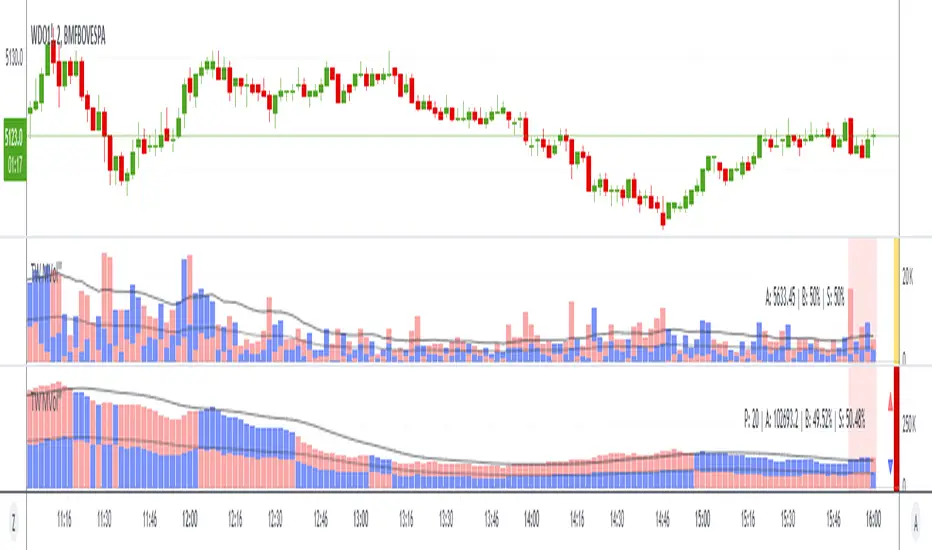
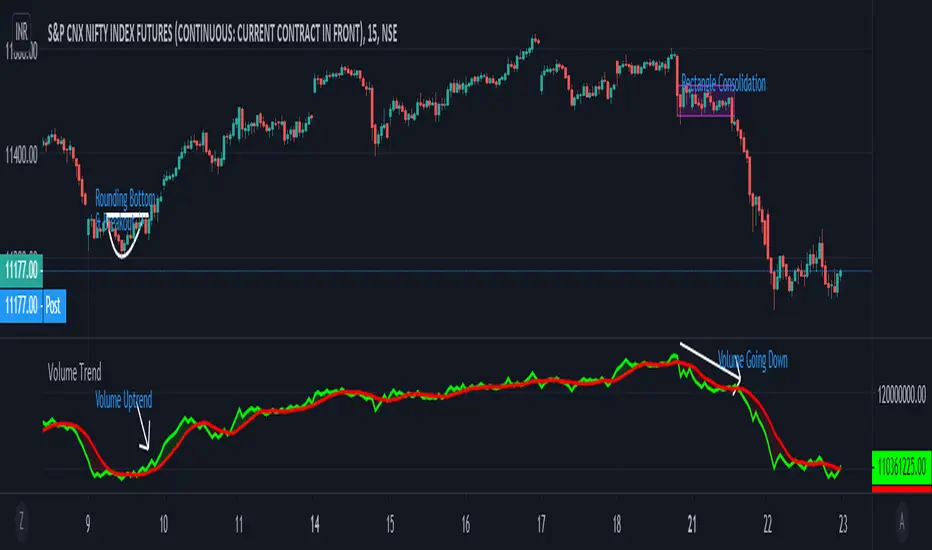
Sumon Pal Volume Osc
This is a volume oscillator calculated by the volume action on each bar price movement over a period of time.
When the short term volume(green line) is above the long term volume line(red)it indicates volume is coming and buying pressure may be observed.
Similarly when the short term volume is below the long term, volume is getting liquidated and selling pressure may be observed.
This indicator alone can't be used for buying or selling decision. This indicator can be used along with price action break out or break down level to get an idea whether volume is supporting the break out/down or not.
Disclaimer: Backtest this indicator with price action over a period of time and understand how it works before taking any trading decision. Trading in equity is always risky. Asses your risk profile and trade by managing proper risk.
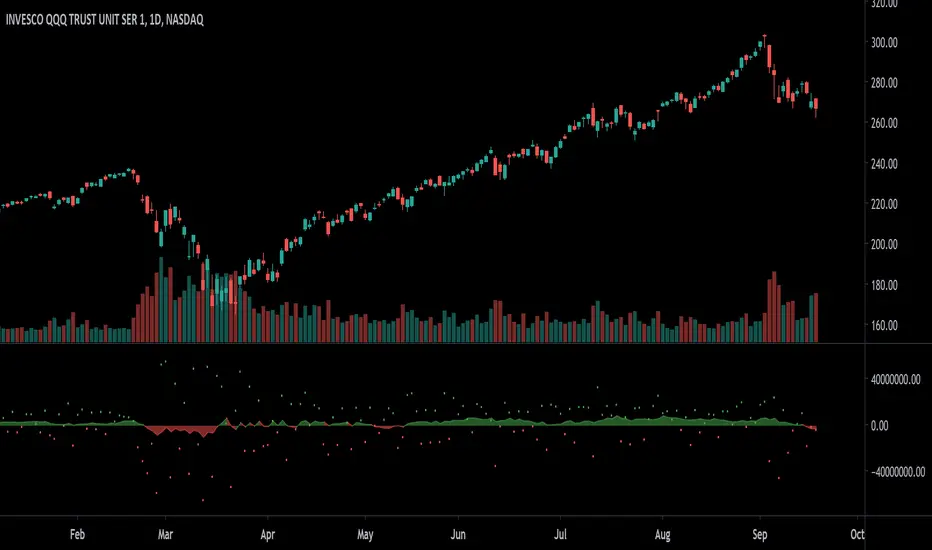
Closing RangeIndicator shows the closing range of each bar. Closing range is where the bar closes (high - close) relative to the length of the wick (high - low). A close at the top of the wick would be 100%, middle 50%, bottom 0%.
In addition, the indicator multiplies closing range by volume to weight toward high volume days.
A simple moving average is applied to visualize trend in volume-weighted closing range over time.
Options include changing the threshold of bullish closes. The default is 50%, but you can view a close above 40% as a bullish.
Simple moving average can be enabled/disabled as well as the length adjusted.
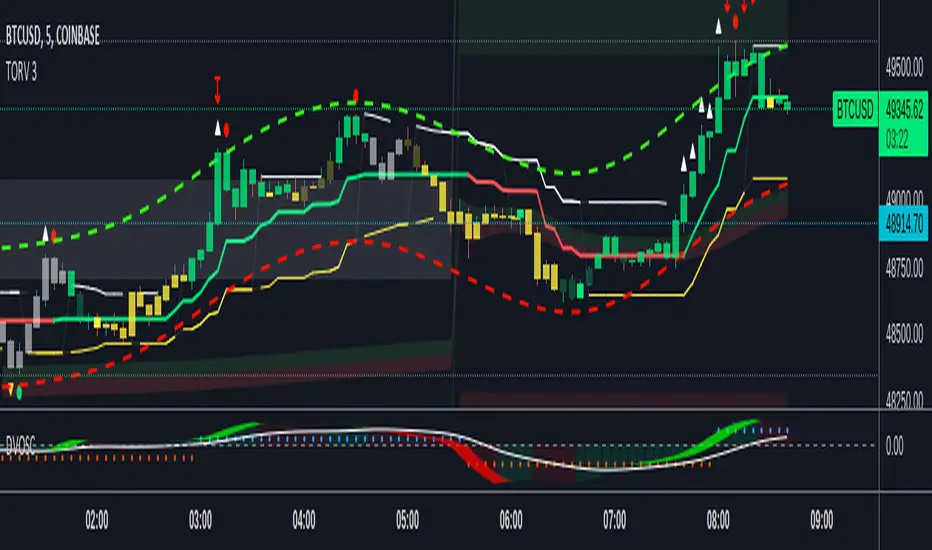
VWAP OscillatorToday I'm proposing a simple VWAP oscillator script to trade buy and sell waves more easily.
You trade this similar to how you trade Awesome Oscillator, so if you want an explanation just look up YT videos.
In addition to that, this will also show volume squeezes, please note that this is a makeshift way and not real volume squeeze phenomena of volume profile and tape. None the less, it is quite good at allowing you to ride out good trending waves and locate weak price action due to volume squeeze. You can turn off bar coloring from settings if you don't want this.
For ease of reading, I've also applied Allenstars Dynamic zones on this indicator so you can easily locate where the reading is entering in long and where it is in sell, this is compared to selected sample size. I've already selected the most common setting for that, so you don't really need to fiddle with it unless you find something better.
This indicator can be used to trade divergences as well, in fact, I feel it is better for that compared to RSI/MACD, the usual suspects.
Past performance is not assurance of future performance and this idea is published for only educational purposes, author taken no responsibility for your profit or loss.
Delta Volume v2.1 by kernel_phiOld Version:
The source code of this script is now open. Feel free to modify it.
*** Not real-time. The indicator will be calculated only after a bar is closed. ***

Slippage Calculator Hello everyone,
This is the first script I publish, also my English is not the best my apologies.
This simple study script is an attempt to estimate the slippage during a trade. By no means it is a precise calculation, it is just an approach that can be improved.
You are welcome to take this simple script and use it and change it at your convenience just ask your acknowledge.
My approach considers the total fluctuation the price gets as a consequence for the total volume on that specific bar.
The volume on each bar is given in BTC, thus you get that by using the formula.
vol = volume * vwap
The total variation in price is considered as twice the size of the bar plus the gap between to consecutive bars. that is the
total fluctuation of price on each bar = (2 * (high - low) + abs(open - close )) which is not totally true since inside each bar price can fluctuate a lot more.
The script considers you are trading your total equity (eq_BTC ) each time. The fraction of your equity of the volume bar is eq_BTC / vol
Then eq_BTC / vol is the portion or the total fluctuation in price that is due to your entry or exit from the market.
(2 * (high - low) + abs(open - close )) * eq_BTC / vol
is the average change in price due you enter o exit a position.
** the 2 factor accounts for the two directions in the market buying and selling. There is more behind this formula I can explain you in more detail if you like.
I haven't seen anywhere a formula like this one, so it is intended to be a first attempt to get a better approach.
Finally the output of the scripts is how many ticks the price might change due to your trade on each bar
round(slippage/syminfo.mintick)
The script is focused in crypto but it can be used as well on forex markets.
Take care,
@yvponce

Freedom of MovementFreedom of Movement Indicator
---------------------------------------------------------
In “Evidence-Based Support & Resistance” article, author Melvin Dickover introduces two new indicators to help traders note support and resistance areas by identifying supply and demand pools. Here you can find the support-resistance technical indicator called "Freedom of Movement".
The indicator takes into account price-volume behavior in order to detect points where movement of price is suddenly restricted, the possible supply and demand pools. These points are also marked by Defended Price Lines (DPLs).
DPLs are horizontal lines that run across the chart at levels defined by following conditions:
* Overlapping bars: If the indicator spike (i.e., indicator is above 2.0 or a custom value) corresponds to a price bar overlapping the previous one, the previous close can be used as the DPL value.
* Very large bars: If the indicator spike corresponds to a price bar of a large size, use its close price as the DPL value.
* Gapping bars: If the indicator spike corresponds to a price bar gapping from the previous bar, the DPL value will depend on the gap size. Small gaps can be ignored: the author suggests using the previous close as the DPL value. When the gap is big, the close of the latter bar is used instead.
* Clustering spikes: If the indicator spikes come in clusters, use the extreme close or open price of the bar corresponding to the last or next to last spike in cluster.
DPLs can be used as support and resistance levels. In order confirm and refine them, FoM (Freedom of Movement) is used along with the Relative Volume Indicator (RVI), which you can find here:
Clustering spikes provide the strongest DPLs while isolated spikes can be used to confirm and refine those provided by the RVI. Coincidence of spikes of the two indicator can be considered a sign of greater strength of the DPL.
More info:
S&C magazine, April 2014.

[WJ] - Corrected Seconds Volume** ONLY WORKS FOR SECONDS CHARTS **
After staring at a chart and scratching my head, I realized that the volumes were being incorrectly reported for lower time frames.
A chart that has no updated tick for 5 minutes will report the volume that occurred in the WHOLE 5 minutes - in one tick.
For a 5 second chart like above, we have now a chart that at first appearance is giving us numbers to believe that there is MUCH more liquidity than is real.
This can really confuse us, and other scripts that rely on volume information.
This script simply takes into consideration the time delay before the next tick. If it took 5 minutes to update a tick, the volume should be divided into whatever seconds we are currently using. I also changed the coloring code - if there is no length to the candle it will look at the candle before it to determine if it is a positive or negative movement.
It does make technical sense to have the volume that occurred over 5 minutes in one tick as it is the true volume. However, this script should not be viewed as the absolute value, but a consistent, usable number that will be more accurate with tools.
To give a quick example on why this is important:
In a 10 second chart, we are given an updated tick every minute. In 2 minutes we have 2 ticks that have 1K volume each.
Alternatively, we have a 10 second chart, and we are given an updated tick every 10 seconds. In 2 minutes we have 12 ticks that have 100 volume each.
With quick mental math we can determine that the second scenario is actually (albeit slightly) more busy. However, a script would not do that extra layer of math and would assume that the first scenario is bouncing off the walls with activity and the second is a graveyard.
It's exactly for this example that I have created this script, and I hope it helps someone else out.
