SOXL Trend Surge v3.0.2 – Profit-Only RunnerSOXL Trend Surge v3.0.2 – Profit-Only Runner
This is a trend-following strategy built for leveraged ETFs like SOXL, designed to ride high-momentum waves with minimal interference. Unlike most short-term scalping scripts, this model allows trades to develop over multiple days to even several months, capitalizing on the full power of extended directional moves — all without using a stop-loss.
🔍 How It Works
Entry Logic:
Price is above the 200 EMA (long-term trend confirmation)
Supertrend is bullish (momentum confirmation)
ATR is rising (volatility expansion)
Volume is above its 20-bar average (liquidity filter)
Price is outside a small buffer zone from the 200 EMA (to avoid whipsaws)
Trades are restricted to market hours only (9 AM to 2 PM EST)
Cooldown of 15 bars after each exit to prevent overtrading
Exit Strategy:
Takes partial profit at +2× ATR if held for at least 2 bars
Rides the remaining position with a trailing stop at 1.5× ATR
No hard stop-loss — giving space for volatile pullbacks
⚙️ Strategy Settings
Initial Capital: $500
Risk per Trade: 100% of equity (fully allocated per entry)
Commission: 0.1%
Slippage: 1 tick
Recalculate after order is filled
Fill orders on bar close
Timeframe Optimized For: 45-minute chart
These parameters simulate an aggressive, high-volatility trading model meant for forward-testing compounding potential under realistic trading costs.
✅ What Makes This Unique
No stop-loss = fewer premature exits
Partial profit-taking helps lock in early wins
Trailing logic gives room to ride large multi-week moves
Uses strict filters (volume, ATR, EMA bias) to enter only during high-probability windows
Ideal for leveraged ETF swing or position traders looking to hold longer than the typical intraday or 2–3 day strategies
⚠️ Important Note
This is a high-risk, high-reward strategy meant for educational and testing purposes. Without a stop-loss, trades can experience deep drawdowns that may take weeks or even months to recover. Always test thoroughly and adjust position sizing to suit your risk tolerance. Past results do not guarantee future returns. Backtest range: May 8, 2020 – May 23, 2025
Swingtrading

True Momentum IndexTrue Momentum Index (TMI) — Precision Trading by Trading_Tomm
The True Momentum Index (TMI) is a cutting-edge technical indicator developed for traders who demand accuracy, clarity, and consistency across all market conditions. Designed by Trading_Tomm , this indicator provides a reliable method to identify high-probability entry and exit points by analyzing real-time momentum shifts and volatility levels.
Key Benefits:
1. Multi-Timeframe Versatility: Whether you're scalping on a 1-minute chart or investing on the weekly, TMI adapts seamlessly to your strategy.
2. Enhanced Risk Management: By highlighting optimal trade zones, TMI helps improve your reward-to-risk ratio and reduce exposure to false signals.
3. Clear Trend Detection: Instantly distinguish between trending, ranging, or consolidating markets.
4. Breakout Confirmation: Spot true breakout opportunities with confidence, supported by Bollinger Band overlays.
5. Universal Applicability: Works effectively with stocks, forex, cryptocurrency, commodities, and indices.
TMI’s intuitive visual presentation and precision signals make it an essential tool for both new and experienced traders. Whether you're trading volatile crypto markets or steady equities, the True Momentum Index gives you the edge to trade with discipline, clarity, and confidence.
Start using the True Momentum Index and take your trading strategy to the next level -maximize potential, minimize uncertainty.

Liquidity ZonesWhat It Does:
Liquidity Zones identifies key areas where institutional traders target stop orders. The indicator automatically detects significant price swings and maps the upper and lower wick zones where liquidity pools form. These zones represent high-probability areas where price is likely to return to collect stop orders before continuing its next move.
How To Use:
Identify Key Zones:
-Red zones highlight Buy Side Liquidity (resistance areas)
-Green zones highlight Sell Side Liquidity (support areas)
Trading Opportunities:
-Enter trades when price respects these zones
-Watch for zone breaks and re-tests for continuation signals
-Use alerts to notify you when price enters a zone or when new zones form
Optimization Tips:
-Adjust lookback periods based on volatility (higher for calmer markets)
-Enable auto-threshold for adaptive sensitivity to market conditions (default setting)
-Most effective on timeframes 4H and above
The indicator tracks when zones are broken and automatically removes them when price returns, providing a clean, uncluttered view of the most relevant liquidity areas on your chart.

UNITED TRADING COMMUNITY WaterMarkWATER MARK indicator. Will allow you to improve the order of the entries you need on the chart.
1. Name and date for the traded instrument
2. Watermarks to protect your charts (in the center and around the perimeter of the chart)
3. The new "notes" option will allow you to keep focus on the factors that are important to you on the chart.
Very flexible settings for any notes, labels, watermarks on the chart that are important to you.
Индикатор WATER MARK . Даст возможность вам улучшить порядок нужных вам записей на графике.
1. Название и дата для торгуемого инструмента
2. Водные знаки для защиты ваших графиков ( в центре и по периметру графика)
3. Новая опция "заметки" позволит вам держать фокус на важных для вас факторах на графике.
Очень гибкая настройка , любых значимых для вас заметок , лейблов , вотермарк на графике.

Multi-Indicator Swing [TIAMATCRYPTO]v6# Strategy Description:
## Multi-Indicator Swing
This strategy is designed for swing trading across various markets by combining multiple technical indicators to identify high-probability trading opportunities. The system focuses on trend strength confirmation and volume analysis to generate precise entry and exit signals.
### Core Components:
- **Supertrend Indicator**: Acts as the primary trend direction filter with optimized settings (Factor: 3.0, ATR Period: 10) to balance responsiveness and reliability.
- **ADX (Average Directional Index)**: Confirms the strength of the prevailing trend, filtering out sideways or choppy market conditions where the strategy avoids taking positions.
- **Liquidity Delta**: A volume-based indicator that analyzes buying and selling pressure imbalances to validate trend direction and potential reversals.
- **PSAR (Optional)**: Can be enabled to add additional confirmation for trend changes, turned off by default to reduce signal filtering.
### Key Features:
- **Flexible Direction Trading**: Choose between long-only, short-only, or bidirectional trading to adapt to market conditions or account restrictions.
- **Conservative Risk Management**: Implements fixed percentage-based stop losses (default 2%) and take profits (default 4%) for a positive risk-reward ratio.
- **Realistic Backtesting Parameters**: Includes commission (0.1%) and slippage (2 points) to reflect real-world trading conditions.
- **Visual Signals**: Clear buy/sell arrows with customizable sizes for easy identification on the chart.
- **Information Panel**: Dynamic display showing active indicators and current risk settings.
### Best Used On:
Daily timeframes for cryptocurrencies, forex, or stock indices. The strategy performs optimally on assets with clear trending behavior and sufficient volatility.
### Default Settings:
Optimized for conservative position sizing (5% of equity per trade) with an initial capital of $10,000. The backtesting period (2021-2023) provides a statistically significant sample of varied market conditions.

SwingTrade VWAP Strategy[TiamatCrypto]V1.1This Pine Script® code creates a trading strategy called "SwingTrade VWAP Strategy V1.1." This strategy incorporates various trading tools, such as VWAP (Volume Weighted Average Price), ADX (Average Directional Index), and volume signals. Below is an explanation of the components and logic within the script:
### Overview of Features
- **VWAP:** A volume-weighted moving average that assesses price trends relative to the VWAP level.
- **ADX:** A trend strength indicator that helps confirm the strength of bullish or bearish trends.
- **Volume Analysis:** Leverages volume data to gauge momentum and identify volume-weighted buy/sell conditions.
- **Dynamic Entry/Exit Signals:** Combines the above indicators to produce actionable buy/sell or exit signals.
- **Customizable Inputs:** Inputs for tuning parameters like VWAP period, ADX thresholds, and volume sensitivity.
---
### **Code Breakdown**
#### **Input Parameters**
The script begins by defining several user-configurable variables under groups. These include indicators' on/off switches (`showVWAP`, `enableADX`, `enableVolume`) and input parameters for VWAP, ADX thresholds, and volume sensitivity:
- **VWAP Period and Threshold:** Controls sensitivity for VWAP signal generation.
- **ADX Settings:** Allows users to configure the ADX period and strength threshold.
- **Volume Ratio:** Detects bullish/bearish conditions based on relative volume patterns.
---
#### **VWAP Calculation**
The script calculates VWAP using the formula:
\
Where `P` is the typical price (`(high + low + close)/3`) and `V` is the volume.
- It resets cumulative values (`sumPV` and `sumV`) at the start of each day.
- Delta percentage (`deltaPercent`) is calculated as the percentage difference between the close price and the VWAP.
---
#### **Indicators and Signals**
1. **VWAP Trend Signals:**
- Identifies bullish/bearish conditions based on price movement (`aboveVWAP`, `belowVWAP`) and whether the price is crossing the VWAP level (`crossingUp`, `crossingDown`).
- Also detects rising/falling delta changes based on the VWAP threshold.
2. **ADX Calculation:**
- Calculates the directional movement (`PlusDM`, `MinusDM`) and smoothed values for `PlusDI`, `MinusDI`, and `ADX`.
- Confirms strong bullish/bearish trends when ADX crosses the defined threshold.
3. **Volume-Based Signals:**
- Evaluates the ratio of bullish volume (when `close > VWAP`) to bearish volume (when `close < VWAP`) over a specified lookback period.
---
#### **Trade Signals**
The buy and sell signals are determined by combining conditions from the VWAP, ADX, and volume signals:
- **Buy Signal:** Triggered when price upward crossover VWAP, delta rises above the threshold, ADX indicates a strong bullish trend, and volume confirms bullish momentum.
- **Sell Signal:** Triggered under inverse conditions.
- Additionally, exit conditions (`exitLong` and `exitShort`) are based on VWAP crossovers combined with the reversal of delta values.
---
#### **Plotting and Display**
The strategy plots VWAP on the chart and adds signal markers for:
- **Buy/Long Entry:** Green triangle below bars.
- **Sell/Short Entry:** Red triangle above bars.
- **Exit Signals:** Lime or orange "X" shapes for exits from long/short positions.
- Additionally, optional text labels are displayed to indicate the type of signal.
---
#### **Trading Logic**
The script's trading logic executes as follows:
- **Entries:**
- Executes long trades when the `buySignal` condition is true.
- Executes short trades when the `sellSignal` condition is true.
- **Exits:**
- Closes long positions upon `exitLong` conditions.
- Closes short positions upon `exitShort` conditions.
- The strategy calculates profits and visualizes the trade entry, exit, and running profit within the chart.
---
#### **Alerts**
Alerts are set up to notify traders via custom signals for buy and sell trades.
---
### **Use Case**
This script is suitable for day traders, swing traders, or algorithmic traders who rely on confluence signals from VWAP, ADX, and volume momentum. Its modular structure (e.g., the ability to enable/disable specific indicators) makes it highly customizable for various trading styles and financial instruments.
#### **Customizability**
- Adjust VWAP, ADX, and volume sensitivity levels to fit unique market conditions or asset classes.
- Turn off specific criteria to focus only on VWAP or ADX signals if desired.
#### **Caution**
As with all trading strategies, this script should be used for backtesting and analysis before live implementation. It's essential to validate its performance on historical data while considering factors like slippage and transaction costs.

Apex Edge - MTF Confluence PanelApex Edge – MTF Confluence Panel
Description:
The Apex Edge – MTF Confluence Panel is a powerful multi-timeframe analysis tool built to streamline trade decision-making by aggregating key confluences across three user-defined timeframes. The panel visually presents the state of five core market signals—Trend, Momentum, Sweep, Structure, and Trap—alongside a unified Score column that summarizes directional bias with clarity.
Traders can customize the number of bullish/bearish conditions required to trigger a score signal, allowing the tool to be tailored for both conservative and aggressive trading styles. This script is designed for those who value a clean, structured, and objective approach to identifying market alignment—whether scalping or swing trading.
How it Works:
Across each of the three selected timeframes, the panel evaluates:
Trend: Based on a user-configurable Hull Moving Average (HMA), the script compares price relative to trend to determine bullish, bearish, or neutral bias.
Momentum: Uses OBV (On-Balance Volume) with volume spike detection to identify bursts of strong buying or selling pressure.
Sweep: Detects potential liquidity grabs by identifying price rejections beyond prior swing highs/lows. A break below a previous low with reversal signals bullish intent (and vice versa for bearish).
Structure: Uses dynamic pivot-based logic to identify market structure breaks (BOS) beyond recent confirmed swing levels.
Trap: Flags potential false moves by measuring RSI overbought/oversold signal clusters combined with minimal price movement—highlighting exhaustion or deceptive breaks.
Score: A weighted consensus of the above components. The number of required confluences to trigger a score (default: 3) can be set by the user via input, offering flexibility in signal sensitivity.
Why It’s Useful for Traders:
Quick Decision-Making: The color-coded panel provides instant visual feedback on whether confluences align across timeframes—ideal for fast-paced environments like scalping or high-volatility news sessions.
Multi-Timeframe Confidence: Helps eliminate guesswork by confirming whether higher and lower timeframe conditions support your trade idea.
Customizability: Adjustable confluence threshold means traders can fine-tune how sensitive the system is—more signals for faster entries, stricter confluence for higher conviction trades.
Built-In Alerts: Automated alerts for score alignment, trap detection, and liquidity sweeps allow traders to stay informed even when away from the screen.
Strategic Edge: Supports directional bias confirmation and trade filtering with logic designed to mimic professional decision-making workflows.
Features:
Clean, real-time confluence table across three user-selected timeframes
Configurable score sensitivity via “Minimum Confluences for Score” input
Cell-based colour coding for at-a-glance trade direction
Built-in alerts for score alignment, traps, and sweep triggers
Note - This Indicator works great in sync with Apex Edge - Session Sweep Pro
Useful levels for TP = previous session high/low boxes or fib levels.
⚠️ Disclaimer:
This script is for informational and educational purposes only and should not be considered financial advice. Always perform your own due diligence and practice proper risk management when trading.

Suvorov Pro SFP+Indicator: Logic-based Swing Failure Pattern (SFP)
What is the logic of my indicator based on and what makes it unique:
1. The indicator can calculate extreme candles that close with huge shadows and a small body and it works on any timeframe.
2. The indicator analyzes the volumes on which the desired bar was closed. This function is customizable. That is, you can build a search for signals according to your trading strategy, based on the number of volumes. What does this mean - you select the number of previous bars where the indicator calculates the average value and based on these numbers, you can set up: how many times the desired candle should be larger than the previous average volume.
3. Since SFP is based on the removal of important liquidity, the search for such situations occurs from swing structures (swing high/low). When these parameters are found on the chart (on history), the indicator draws the situation and shows where important liquidity was removed and why the trading situation appeared right now.
4. The indicator gives recommendations on possible takes and stops.
The structure of takes has a built-in logic for searching for previous swings to remove liquidity, as well as searching for imbalances to cover them (50 and 100%).
5. For TP (Take Profit): there are 3 TPthat can be adjusted to your trading strategy (Risk/Profit). For example: you always trade from 2 to 1 on the 1st Take, 3 to 1 on the second, 5 to 1 on the third: you can set all this in the indicator and all your targets will be detected by the indicator, taking into account the logic of searching for important ranges. If, for example, in your 3 to 1 range there are no important zones for TP, then the indicator writes that NaN (not found).
6. The indicator works on any timeframe.
7. The indicator has a built-in RSI logic, which comes as an additional function to the indicator. If this function is enabled, then trading situations are detected only when there is a divergence (from the swing point to the extreme bar that has formed).

Parsifal.Swing.TrendScoreThe Parsifal.Swing.TrendScore indicator is a module within the Parsifal Swing Suite, which includes a set of swing indicators such as:
• Parsifal Swing TrendScore
• Parsifal Swing Composite
• Parsifal Swing RSI
• Parsifal Swing Flow
Each module serves as an indicator facilitating judgment of the current swing state in the underlying market.
________________________________________
Background
Market movements typically follow a time-varying trend channel within which prices oscillate. These oscillations—or swings—within the trend are inherently tradable.
They can be approached:
• One-sidedly, aligning with the trend (generally safer), or
• Two-sidedly, aiming to profit from mean reversions as well.
Note: Mean reversions in strong trends often manifest as sideways consolidations, making one-sided trades more stable.
________________________________________
The Parsifal Swing Suite
The modules aim to provide additional insights into the swing state within a trend and offer various trigger points to assist with entry decisions.
All modules in the suite act as weak oscillators, meaning they fluctuate within a range but are not bounded like true oscillators (e.g., RSI, which is constrained between 0% and 100%).
________________________________________
The Parsifal.Swing.TrendScore – Specifics
The Parsifal.Swing.TrendScore module combines short-term trend data with information about the current swing state, derived from raw price data and classical technical indicators. It provides an indication of how well the short-term trend aligns with the prevailing swing, based on recent market behavior.
________________________________________
How Swing.TrendScore Works
The Swing.TrendScore calculates a swing score by collecting data within a bin (i.e., a single candle or time bucket) that signals an upside or downside swing. These signals are then aggregated together with insights from classical swing indicators.
Additionally, it calculates a short-term trend score using core technical signals, including:
• The Z-score of the price's distance from various EMAs
• The slope of EMAs
• Other trend-strength signals from additional technical indicators
These two components—the swing score and the trend score—are then combined to form the Swing.TrendScore indicator, which evaluates the short-term trend in context with swing behavior.
________________________________________
How to Interpret Swing.TrendScore
The trend component enhances Swing.TrendScore’s ability to provide stronger signals when the short-term trend and swing state align.
It can also override the swing score; for example, even if a mean reversion appears to be forming, a dominant short-term trend may still control the market behavior.
This makes Swing.TrendScore particularly valuable for:
• Short-term trend-following strategies
• Medium-term swing trading
Unlike typical swing indicators, Swing.TrendScore is designed to respond more to medium-term swings rather than short-lived fluctuations.
________________________________________
Behavior and Chart Representation
The Swing.TrendScore indicator fluctuates within a range, as most of its components are range-bound (though Z-score components may technically extend beyond).
• Historically high or low values may suggest overbought or oversold conditions
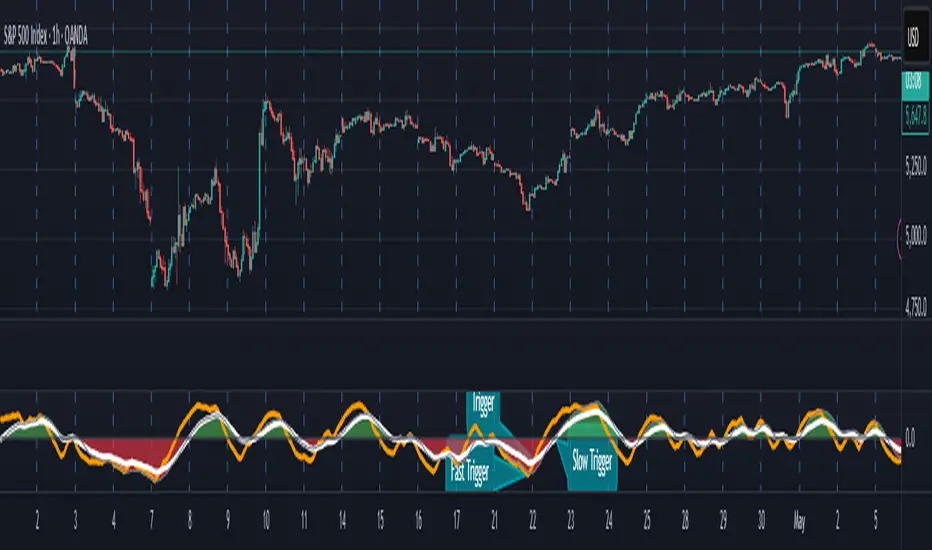
• The chart displays:
o A fast curve (orange)
o A slow curve (white)
o A shaded background representing the market state
• Extreme values followed by curve reversals may signal a developing mean reversion
________________________________________
TrendScore Background Value
The Background Value reflects the combined state of the short-term trend and swing:
• > 0 (shaded green) → Bullish mode: swing and short-term trend both upward
• < 0 (shaded red) → Bearish mode: swing and short-term trend both downward
• The absolute value represents the confidence level in the market mode
Notably, the Background Value can remain positive during short downswings if the short-term trend remains bullish—and vice versa.
________________________________________
How to Use the Parsifal.Swing.TrendScore
Several change points can act as entry triggers or aids:
• Fast Trigger: change in slope of the fast signal curve
• Trigger: fast line crosses slow line or the slope of the slow signal changes
• Slow Trigger: change in sign of the Background Value
Examples of these trigger points are illustrated in the accompanying chart.
Additionally, market highs and lows aligning with the swing indicator values may serve as pivot points in the evolving price process.
________________________________________
As always, this indicator should be used in conjunction with other tools and market context in live trading.
While it provides valuable insight and potential entry points, it does not predict future price action.
Instead, it reflects recent tendencies and should be used judiciously.
________________________________________
Extensions
The aggregation of information—whether derived from bins or technical indicators—is currently performed via simple averaging. However, this can be modified using alternative weighting schemes, based on:
• Historical performance
• Relevance of the data
• Specific market conditions
Smoothing periods used in calculations are also modifiable. In general, the EMAs applied for smoothing can be extended to reflect expectations based on relevance-weighted probability measures.
Since EMAs inherently give more weight to recent data, this allows for adaptive smoothing.
Additionally, EMAs may be further extended to incorporate negative weights, akin to wavelet transform techniques.

Parsifal.Swing.CompositeThe Parsifal.Swing.Composite indicator is a module within the Parsifal Swing Suite, which includes a set of swing indicators such as:
• Parsifal Swing TrendScore
• Parsifal Swing Composite
• Parsifal Swing RSI
• Parsifal Swing Flow
Each module serves as an indicator facilitating judgment of the current swing state in the underlying market.
________________________________________
Background
Market movements typically follow a time-varying trend channel within which prices oscillate. These oscillations—or swings—within the trend are inherently tradable.
They can be approached:
• One-sidedly, aligning with the trend (generally safer), or
• Two-sidedly, aiming to profit from mean reversions as well.
Note: Mean reversions in strong trends often manifest as sideways consolidations, making one-sided trades more stable.
________________________________________
The Parsifal Swing Suite
The modules aim to provide additional insights into the swing state within a trend and offer various trigger points to assist with entry decisions.
All modules in the suite act as weak oscillators, meaning they fluctuate within a range but are not bounded like true oscillators (e.g., RSI, which is constrained between 0% and 100%).
________________________________________
The Parsifal.Swing.Composite – Specifics
This module consolidates multiple insights into price swing behavior, synthesizing them into an indicator reflecting the current swing state.
It employs layered bagging and smoothing operations based on standard price inputs (OHLC) and classical technical indicators. The module integrates several slightly different sub-modules.
Process overview:
1. Per candle/bin, sub-modules collect directional signals (up/down), with each signal casting a vote.
2. These votes are aggregated via majority counting (bagging) into a single bin vote.
3. Bin votes are then smoothed, typically with short-term EMAs, to create a sub-module vote.
4. These sub-module votes are aggregated and smoothed again to generate the final module vote.
The final vote is a score indicating the module’s assessment of the current swing state. While it fluctuates in a range, it's not a true oscillator, as most inputs are normalized via Z-scores (value divided by standard deviation over a period).
• Historically high or low values correspond to high or low quantiles, suggesting potential overbought or oversold conditions.
• The chart displays a fast (orange) and slow (white) curve against a solid background state.
• Extreme values followed by curve reversals may signal upcoming mean-reversions.
Background Value:
• Value > 0: shaded green → bullish mode
• Value < 0: shaded red → bearish mode
• The absolute value indicates confidence in the mode.
________________________________________
How to Use the Parsifal.Swing.Composite
Several change points in the indicator serve as potential entry triggers:
• Fast Trigger: change in slope of the fast curve
• Trigger: fast line crossing the slow line or change in the slow curve’s slope
• Slow Trigger: change in sign of the background value
These are illustrated in the introductory chart.
Additionally, market highs and lows aligned with swing values may act as pivot points, support, or resistance levels for evolving price processes.
________________________________________
As always, supplement this indicator with other tools and market information. While it provides valuable insights and potential entry points, it does not predict future prices. It reflects recent tendencies and should be used judiciously.
________________________________________
Extensions
All modules in the Parsifal Swing Suite are simple yet adaptable, whether used individually or in combination.
Customization options:
• Weights in EMAs for smoothing are adjustable
• Bin vote aggregation (currently via sum-of-experts) can be modified
• Alternative weighting schemes can be tested
Advanced options:
• Bagging weights may be historical, informational, or relevance-based
• Selection algorithms (e.g., ID3, C4.5, CAT) could replace the current bagging approach
• EMAs may be generalized into expectations relative to relevance-based probability
• Negative weights (akin to wavelet transforms) can be incorporated
PEAD strategy█ OVERVIEW
This strategy trades the classic post-earnings announcement drift (PEAD).
It goes long only when the market gaps up after a positive EPS surprise.
█ LOGIC
1 — Earnings filter — EPS surprise > epsSprThresh %
2 — Gap filter — first regular 5-minute bar gaps ≥ gapThresh % above yesterday’s close
3 — Timing — only the first qualifying gap within one trading day of the earnings bar
4 — Momentum filter — last perfDays trading-day performance is positive
5 — Risk management
• Fixed stop-loss: stopPct % below entry
• Trailing exit: price < Daily EMA( emaLen )
█ INPUTS
• Gap up threshold (%) — 1 (gap size for entry)
• EPS surprise threshold (%) — 5 (min positive surprise)
• Past price performance — 20 (look-back bars for trend check)
• Fixed stop-loss (%) — 8 (hard stop distance)
• Daily EMA length — 30 (trailing exit length)
Note — Back-tests fill on the second 5-minute bar (Pine limitation).
Live trading: enable calc_on_every_tick=true for first-tick entries.
────────────────────────────────────────────
█ 概要(日本語)
本ストラテジーは決算後の PEAD を狙い、
EPS サプライズがプラス かつ 寄付きギャップアップ が発生した銘柄をスイングで買い持ちします。
█ ロジック
1 — 決算フィルター — EPS サプライズ > epsSprThresh %
2 — ギャップフィルター — レギュラー時間最初の 5 分足が前日終値+ gapThresh %以上
3 — タイミング — 決算当日または翌営業日の最初のギャップのみエントリー
4 — モメンタムフィルター — 過去 perfDays 営業日の騰落率がプラス
5 — リスク管理
• 固定ストップ:エントリー − stopPct %
• 利確:終値が日足 EMA( emaLen ) を下抜け
█ 入力パラメータ
• Gap up threshold (%) — 1 (ギャップ条件)
• EPS surprise threshold (%) — 5 (EPS サプライズ最小値)
• Past price performance — 20 (パフォーマンス判定日数)
• Fixed stop-loss (%) — 8 (固定ストップ幅)
• Daily EMA length — 30 (利確用 EMA 期間)
注意 — Pine の仕様上、バックテストでは寄付き 5 分足の次バーで約定します。
実運用で寄付き成行に合わせたい場合は calc_on_every_tick=true を有効にしてください。
────
ご意見や質問があればお気軽にコメントください。
Happy trading!

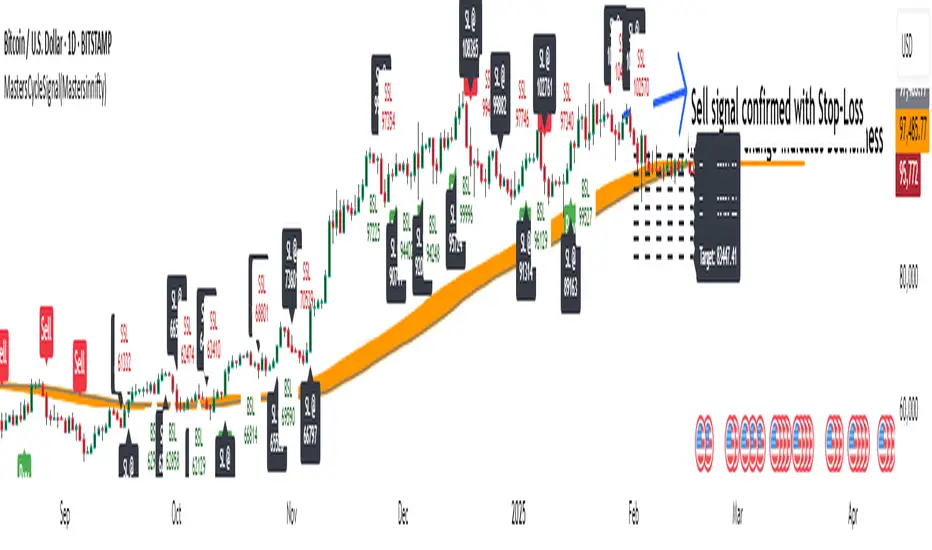
MastersCycleSignal(Mastersinnifty)Overview
MastersCycleSignal is a high-precision market timing and projection indicator for trend-following and swing traders.
It combines an adaptive cycle detection algorithm, forward-looking sine wave projections, dynamic momentum confirmation, and Gann Square of 9-based geometric targets into a complete structured trading framework.
The script continuously analyzes price oscillations to detect dominant cycles, projects expected price behavior with future-facing sine approximations, and generates buy/sell signals once confirmed by adaptive momentum filtering.
Upon confirmation, it calculates mathematically consistent Gann-based target levels and risk-managed stop-loss suggestions.
Users also benefit from auto-extending targets as price action unfolds — helping traders anticipate rather than react to market shifts.
---
Uniqueness
MastersCycleSignal stands apart through a unique fusion of techniques:
- Dynamic Cycle Detection
- Detects dominant cycles using a cosine correlation maximization method between detrended price (close minus SMA) and theoretical cosine curves, dynamically recalibrated across a sliding window.
- Sine Wave Future Projection
- Smooths and projects future price paths by approximating a forward sine wave based on the real-time detected dominant cycle.
- Adaptive Momentum Filtering
- Volatility is scaled by divergence between normalized returns and a 5-period EMA, further adjusted by an RSI(2) factor.
- This makes buy/sell signal confirmation robust against noise and false breakouts.
- Gann-Based Target Computation
- Uses a square-root transformation of price, incremented by selectable Gann Square of 9 degrees, for calculating progressive and dynamically expanding price targets.
- Auto-Extending Targets
- As price achieves a projected target, the system automatically draws subsequent new targets based on the prior target differential — providing continuous guidance in trending conditions.
---
Usefulness
MastersCycleSignal is built to help traders:
- Identify early trend reversals through cycle shifts.
- Forecast probable price paths in advance.
- Plan systematic target and stop-loss zones with geometric accuracy.
- Reduce guesswork in trend-following and swing trading.
- Maintain structured discipline across intraday, swing, and positional strategies.
It works seamlessly across stocks, indices, forex, commodities, and crypto markets — on any timeframe.
---
How to Use
- Attach the indicator to your desired chart.
- When a Buy Signal or Sell Signal appears (green or red markers):
- Use the attached stop-loss labels to manage risk.
- Monitor the automatically plotted target lines for partial exits or full profits.
- The orange projected sine wave illustrates the expected future market path.
- Customization Options:
- Cycle Detection Length — adjust to fine-tune cycle sensitivity.
- Projection Length — modify the forward distance of sine wave forecast.
- Gann Square of 9 Degrees — personalize target increments.
- Toggle Signals and Target visibility as needed.
---
Disclaimer
- MastersCycleSignal uses no future data or lookahead bias.
- All projections are based on geometric extrapolations from historical price action — not guaranteed predictions.
- Trading involves risks, and historical cycle behavior may differ in future conditions.
Swing High/Low Scalper(Mastersinnifty)Overview
The Swing High/Low Scalper is designed for traders seeking structured entries and disciplined stop-loss planning during momentum shifts. It combines smoothed Force Index readings with swing high/low analysis to identify moments where both momentum and structural price levels align.
When a new directional bias is confirmed, the indicator plots clear entry signals and dynamically calculates the nearest logical stop-loss level based on recent swing points.
---
Core Logic
- Force Index Bias Detection
- The Force Index (price × volume change) is smoothed with an EMA to determine sustained bullish or bearish momentum.
- Signal Memory and Noise Reduction
- The indicator remembers the last signal (buy/sell) and only triggers a new signal when the bias changes, helping avoid redundant entries in sideways or noisy conditions.
- Swing-based Stop-Loss Calculation
- Upon signal confirmation, the script automatically plots a stop-loss label near the most recent swing low (for buys) or swing high (for sells).
- If conditions are extreme, fallback safety checks are used to validate the stop-loss placement.
---
Key Features
- Dynamic, structure-based stop-loss plots at every trade signal.
- Visual background bias:
- Green tint = Bullish bias
- Red tint = Bearish bias
- Minimalist and clean chart visualization for easy interpretation.
- Designed for scalability across timeframes (from 1-minutes to daily charts).
---
Why It’s Unique
- Unlike simple momentum oscillators or swing indicators, this tool integrates a state-tracking mechanism.
- A signal is only generated when a true shift in directional force occurs and swing structure supports the move, seeking to catch only meaningful changes rather than every minor fluctuation.
- This dual-filter approach emphasizes quality over quantity, aiming for disciplined entries with risk levels derived from actual price behavior, not arbitrary formulas.
---
How to Use
- Apply the Script to your desired chart and timeframe.
- Look for Signals:
- Green Up Arrow = Buy Signal
- Red Down Arrow = Sell Signal
- Observe Stop-Loss Labels
- Use the plotted SL labels for setting exit points based on recent swing structure.
- Monitor Background Bias:
- Green or Red background hints at prevailing directional momentum.
---
Important Disclaimer
This tool is intended to assist technical analysis and trade planning.
It does not provide financial advice or guarantee any future performance.
Always use additional risk management practices when trading.

SynchroTrend Oscillator (STO) [PhenLabs]📊 SynchroTrend Oscillator
Version: PineScript™ v5
📌 Description
The SynchroTrend Oscillator (STO) is a multi-timeframe synchronization tool that combines trend information from three distinct timeframes into a single, easy-to-interpret oscillator ranging from -100 to +100.
This indicator solves the common problem of having to analyze multiple timeframe charts separately by consolidating trend direction and strength across different time horizons. The STO helps traders identify when markets are truly synchronized across timeframes, potentially indicating stronger trend conditions and higher probability trading opportunities.
Using either Moving Average crossovers or RSI analysis as the trend definition metric, the STO provides a comprehensive view of market structure that adapts to various trading strategies and market conditions.
🚀 Points of Innovation
Triple-timeframe synchronization in a single view eliminates chart switching
Dual trend detection methods (MA vs Price or RSI) for flexibility across different markets
Dynamic color intensity that automatically increases with signal strength
Scaled oscillator format (-100 to +100) for intuitive trend strength interpretation
Customizable signal thresholds to match your risk tolerance and trading style
Visual alerts when markets reach full synchronization states
🔧 Core Components
Trend Scoring System: Calculates a binary score (+1, -1, or 0) for each timeframe based on selected metrics, providing clear trend direction
Multi-Timeframe Synchronization: Combines and scales trend scores from all three timeframes into a single oscillator
Dynamic Visualization: Adjusts color transparency based on signal strength, creating an intuitive visual guide
Threshold System: Provides customizable levels for identifying potentially significant trading opportunities
🔥 Key Features
Triple Timeframe Analysis: Synchronizes three user-defined timeframes (default: 60min, 15min, 5min) into one view
Dual Trend Detection Methods: Choose between Moving Average vs Price or RSI-based trend determination
Adjustable Signal Smoothing: Apply EMA, SMA, or no smoothing to the oscillator output for your preferred signal responsiveness
Dynamic Color Intensity: Colors become more vibrant as signal strength increases, helping identify strongest setups
Customizable Thresholds: Set your own buy/sell threshold levels to match your trading strategy
Comprehensive Alerts: Six different alert conditions for crossing thresholds, zero line, and full synchronization states
🎨 Visualization
Oscillator Line: The main line showing the synchronized trend value from -100 to +100
Dynamic Fill: Area between oscillator and zero line changes transparency based on signal strength
Threshold Lines: Optional dotted lines indicating buy/sell thresholds for visual reference
Color Coding: Green for bullish synchronization, red for bearish synchronization
📖 Usage Guidelines
Timeframe Settings
Timeframe 1: Default: 60 (1 hour) - Primary higher timeframe for trend definition
Timeframe 2: Default: 15 (15 minutes) - Intermediate timeframe for trend definition
Timeframe 3: Default: 5 (5 minutes) - Lower timeframe for trend definition
Trend Calculation Settings
Trend Definition Metric: Default: “MA vs Price” - Method used to determine trend on each timeframe
MA Type: Default: EMA - Moving Average type when using MA vs Price method
MA Length: Default: 21 - Moving Average period when using MA vs Price method
RSI Length: Default: 14 - RSI period when using RSI method
RSI Source: Default: close - Price data source for RSI calculation
Oscillator Settings
Smoothing Type: Default: SMA - Applies smoothing to the final oscillator
Smoothing Length: Default: 5 - Period for the smoothing function
Visual & Threshold Settings
Up/Down Colors: Customize colors for bullish and bearish signals
Transparency Range: Control how transparency changes with signal strength
Line Width: Adjust oscillator line thickness
Buy/Sell Thresholds: Set levels for potential entry/exit signals
✅ Best Use Cases
Trend confirmation across multiple timeframes
Finding high-probability entry points when all timeframes align
Early detection of potential trend reversals
Filtering trade signals from other indicators
Market structure analysis
Identifying potential divergences between timeframes
⚠️ Limitations
Like all indicators, can produce false signals during choppy or ranging markets
Works best in trending market conditions
Should not be used in isolation for trading decisions
Past performance is not indicative of future results
May require different settings for different markets or instruments
💡 What Makes This Unique
Combines three timeframes in a single visualization without requiring multiple chart windows
Dynamic transparency feature that automatically emphasizes stronger signals
Flexible trend definition methods suitable for different market conditions
Visual system that makes multi-timeframe analysis intuitive and accessible
🔬 How It Works
1. Trend Evaluation:
For each timeframe, the indicator calculates a trend score (+1, -1, or 0) using either:
MA vs Price: Comparing close price to a moving average
RSI: Determining if RSI is above or below 50
2. Score Aggregation:
The three trend scores are combined and then scaled to a range of -100 to +100
A value of +100 indicates all timeframes show bullish conditions
A value of -100 indicates all timeframes show bearish conditions
Values in between indicate varying degrees of alignment
3. Signal Processing:
The raw oscillator value can be smoothed using EMA, SMA, or left unsmoothed
The final value determines line color, fill color, and transparency settings
Threshold levels are applied to identify potential trading opportunities
💡 Note:
The SynchroTrend Oscillator is most effective when used as part of a comprehensive trading strategy that includes proper risk management techniques. For best results, consider using the oscillator in conjunction with support/resistance levels, price action analysis, and other complementary indicators that align with your trading style.

AccumulationPro Money Flow StrategyAccumulationPro Money Flow Strategy identifies stock trading opportunities by analyzing money flow and potential long-only opportunities following periods of increased money inflow. It employs proprietary responsive indicators and oscillators to gauge the strength and momentum of the inflow relative to previous periods, detecting money inflow, buying/selling pressure, and potential continuation/reversals, while using trailing stop exits to maximize gains while minimizing losses, with careful consideration of risk management and position sizing.
Setup Instructions:
1. Configuring the Strategy Properties:
Click the "Settings" icon (the gear symbol) next to the strategy name.
Navigate to the "Properties" tab within the Settings window.
Initial Capital: This value sets the starting equity for the strategy backtesting. Keep in mind that you will need to specify your current account size in the "Inputs" settings for position sizing.
Base Currency: Leave this setting at its "Default" value.
Order Size: This setting, which determines the capital used for each trade during backtesting, is automatically calculated and updated by the script. You should leave it set to "1 Contract" and the script will calculate the appropriate number of contracts based on your risk per trade, account size, and stop-loss placement.
Pyramiding: Set this setting at 1 order to prevent the strategy from adding to existing positions.
Commission: Enter your broker's commission fee per trade as a percentage, some brokers might offer commission free trading. Verify Price for limit orders: Keep this value as 0 ticks.
Slippage: This value depends on the instrument you are trading, If you are trading liquid stocks on a 1D chart slippage might be neglected. You can Keep this value as 1 ticks if you want to be conservative.
Margin for long positions/short positions: Set both of these to 100% since this strategy does not employ leverage or margin trading.
Recalculate:
Select the "After order is filled" option.
Select the "On every tick" option.
Fill Orders: Keep “Using bar magnifier” unselected.
Select "On bar close". Select "Using standard OHLC"
2. Configuring the Strategy Inputs:
Click the "Inputs" tab in the Settings window.
From/Thru (Date Range): To effectively backtest the strategy, define a substantial period that includes various bullish and bearish cycles. This ensures the testing window captures a range of market conditions and provides an adequate number of trades. It is usually favorable to use a minimum of 8 years for backtesting. Ensure the "Show Date Range" box is checked.
Account Size: This is your actual current Account Size used in the position sizing table calculations.
Risk on Capital %: This setting allows you to specify the percentage of your capital you are willing to risk on each trade. A common value is 0.5%.
3. Configuring Strategy Style:
Select the "Style" tab.
Select the checkbox for “Stop Loss” and “Stop Loss Final” to display the black/red Average True Range Stop Loss step-lines
Make sure the checkboxes for "Upper Channel", "Middle Line", and "Lower Channel" are selected.
Select the "Plots Background" checkboxes for "Color 0" and "Color 1" so that the potential entry and exit zones become color-coded.
Having the checkbox for "Tables" selected allows you to see position sizing and other useful information within the chart.
Have the checkboxes for "Trades on chart" and "Signal Labels" selected for viewing entry and exit point labels and positions.
Uncheck* the "Quantity" checkbox.
Precision: select “Default”.
Check “Labels on price scale”
Check “Values in status line”
Strategy Application Guidelines:
Entry Conditions:
The strategy identifies long entry opportunities based on substantial money inflow, as detected by our proprietary indicators and oscillators. This assessment considers the strength and momentum of the inflow relative to previous periods, in conjunction with strong price momentum (indicated by our modified, less-lagging MACD) and/or a potential price reversal (indicated by our modified, less-noisy Stochastic). Additional confirmation criteria related to price action are also incorporated. Potential entry and exit zones are visually represented by bands on the chart.
A blue upward-pointing arrow, accompanied by the label 'Long' and green band fills, signifies a long entry opportunity. Conversely, a magenta downward-pointing arrow, labeled 'Close entry(s) order Long' with yellow band fills, indicates a potential exit.
Take Profit:
The strategy employs trailing stops, rather than fixed take-profit levels, to maximize gains while minimizing losses. Trailing stops adjust the stop-loss level as the stock price moves in a favorable direction. The strategy utilizes two types of trailing stop mechanisms: one based on the Average True Range (ATR), and another based on price action, which attempts to identify shifts in price momentum.
Stop Loss:
The strategy uses an Average True Range (ATR)-based stop-loss, represented by two lines on the chart. The black line indicates the primary ATR-based stop-loss level, set upon trade entry. The red line represents a secondary ATR stop-loss buffer, used in the position sizing calculation to account for potential slippage or price gaps.
To potentially reduce the risk of stop-hunting, discretionary traders might consider using a market sell order within the final 30 to 60 minutes of the main session, instead of automated stop-loss orders.
Order Types:
Market Orders are intended for use with this strategy, specifically when the candle and signal on the chart stabilize within the final 30 to 60 minutes of the main trading session.
Position Sizing:
A key aspect of this strategy is that its position size is calculated and displayed in a table on the chart. The position size is calculated based on stop-loss placement, including the stop-loss buffer, and the capital at risk per trade which is commonly set around 0.5% Risk on Capital per Trade.
Backtesting:
The backtesting results presented below the chart are for informational purposes only and are not intended to predict future performance. Instead, they serve as a tool for identifying instruments with which the strategy has historically performed well.
It's important to note that the backtester utilizes a tiny portion of the capital for each trade while our strategy relies on a diversified portfolio of multiple stocks or instruments being traded at once.
Important Considerations:
Volume data is crucial; the strategy will not load or function correctly without it. Ensure that your charts include volume data, preferably from a centralized exchange.
Our system is designed for trading a portfolio. Therefore, if you intend to use our system, you should employ appropriate position sizing, without leverage or margin, and seek out a variety of long opportunities, rather than opening a single trade with an excessively large position size.
If you are trading without automated signals, always allow the chart to stabilize. Refrain from taking action until the final 1 hour to 30 minutes before the end of the main trading session to minimize the risk of acting on false signals.
To align with the strategy's design, it's generally preferable to enter a trade during the same session that the signal appears, rather than waiting for a later session.
Disclaimer:
Trading in financial markets involves a substantial degree of risk. You should be aware of the potential for significant financial losses. It is imperative that you trade responsibly and avoid overtrading, as this can amplify losses. Remember that market conditions can change rapidly, and past performance is not indicative of future results. You could lose some or all of your initial investment. It is strongly recommended that you fully understand the risks involved in trading and seek independent financial advice from a qualified professional before using this strategy.

RSI-MACD Momentum Fusion Indicator(RMFI)📈 RSI-MACD Momentum Fusion Indicator (RMFI)
The RMFI combines the strengths of two RSI variants with a dynamically adaptive MACD module into a powerful momentum oscillator ranging from 0 to 100. The goal is to unify converging momentum information from different perspectives into a clear, weighted overall signal.
🔧 Core Features
RSI 1: Classic Wilder RSI, sensitive to short-term momentum.
RSI 2: Modified RSI based on normalized price movement ranges (Range Momentum).
MACD (3 Modes):
Standardized (min/max-based)
Fully adaptive (Z-score normalization)
50% adaptive (hybrid weighting of both approaches)
Dynamic MACD mode selection (optional): Automatic switching of MACD normalization based on volatility levels (ATR-based).
Signal Line: Smoothed average of all components to visualize momentum trends and crossovers.
🎯 Visualization
Clear separation of overbought (>70) and oversold (<30) zones with color highlighting.
Different colors based on the dynamic MACD mode – visually indicates how strongly the market adapts to volatility.
⚙️ Recommended Use
Ideal for trend following, divergence confirmation (with external divergence logic), and momentum reversals.
Particularly effective in volatile markets, as the MACD component adaptively responds to instability.
© champtrades
ScalpSwing Pro SetupScript Overview
This script is a multi-tool setup designed for both scalping (1m–5m) and swing trading (1H–4H–Daily). It combines the power of trend-following , momentum , and mean-reversion tools:
What’s Included in the Script
1. EMA Indicators (20, 50, 200)
- EMA 20 (blue) : Short-term trend
- EMA 50 (orange) : Medium-term trend
- EMA 200 (red) : Long-term trend
- Use:
- EMA 20 crossing above 50 → bullish trend
- EMA 20 crossing below 50 → bearish trend
- Price above 200 EMA = uptrend bias
2. VWAP (Volume Weighted Average Price)
- Shows the average price weighted by volume
- Best used in intraday (1m to 15m timeframes)
- Use:
- Price bouncing from VWAP = reversion trade
- Price far from VWAP = likely pullback incoming
3. RSI (14) + Key Levels
- Shows momentum and overbought/oversold zones
- Levels:
- 70 = Overbought (potential sell)
- 30 = Oversold (potential buy)
- 50 = Trend confirmation
- Use:
- RSI 30–50 in uptrend = dip buying zone
- RSI 70–50 in downtrend = pullback selling zone
4. MACD Crossovers
- Standard MACD with histogram & cross alerts
- Shows trend momentum shifts
- Green triangle = Bullish MACD crossover
- Red triangle = Bearish MACD crossover
- Use:
- Confirm swing trades with MACD crossover
- Combine with RSI divergence
5. Buy & Sell Signal Logic
BUY SIGNAL triggers when:
- EMA 20 crosses above EMA 50
- RSI is between 50 and 70 (momentum bullish, not overbought)
SELL SIGNAL triggers when:
- EMA 20 crosses below EMA 50
- RSI is between 30 and 50 (bearish momentum, not oversold)
These signals appear as:
- BUY : Green label below the candle
- SELL : Red label above the candle
How to Trade with It
For Scalping (1m–5m) :
- Focus on EMA crosses near VWAP
- Confirm with RSI between 50–70 (buy) or 50–30 (sell)
- Use MACD triangle as added confluence
For Swing (1H–4H–Daily) :
- Look for EMA 20–50 cross + price above EMA 200
- Confirm trend with MACD and RSI
- Trade breakout or pullback depending on structure

Candlestick Pattern Indicator – Doji, Harami, More [algo_aakash]This Candlestick Pattern Indicator is designed to help traders identify key price action patterns like Bullish Engulfing, Bearish Engulfing, Doji, Hammer, Morning Star, Evening Star, and many more directly on your TradingView chart. With customizable options to display both bullish and bearish patterns , this indicator provides real-time visual markers and labels, helping you make informed trading decisions.
Key features of the indicator include:
Detects popular candlestick patterns such as Bullish Engulfing, Bearish Engulfing, Hammer, Morning Star, Tweezer Tops, and more.
Customizable settings for displaying pattern shapes, labels, and opacity, tailored to your trading preferences.
Option to plot signals only after a candle closes, ensuring accuracy.
Alerts for immediate notification of detected patterns.
Visual markers on the chart, including arrows and labels, for quick recognition of potential trade setups.
This indicator is ideal for traders who rely on candlestick patterns for technical analysis and want an automated tool to highlight these setups for easier decision-making.
Whether you're a beginner or an experienced trader, this tool will help you spot important patterns in real-time without cluttering your chart.

Swing Structure + Session Sweeps“Scalper-Friendly Trend & Sweep Detector”
Swing Structure + Session Sweeps with TEMA Cloud
This powerful all-in-one tool is designed for intraday traders, swing traders, and scalpers who want to spot high-probability reversals, trend continuations, and liquidity sweeps with confluence.
🔹 Core Features
Multi-layered TEMA Cloud (9, 20, 34, 50) for clear trend structure
Dynamic Bull/Bear labels when the trend flips
Centerline for TEMA 20 to visualize core trend direction
Session-based liquidity sweep detection (Asia, London, NY)
Volume and absorption dots to catch hidden pressure
Swing high/low detection (external and internal)
Visual VWAP, daily highs/lows, and customizable session zones
Optional alerts for volume spikes, absorption, and reversal sweeps
📈 Use it to:
Confirm directional bias
Anticipate pullbacks and breakouts
Identify volume-backed reversals
Align trades with session strength and swing confluence
⚙️ Built for scalpers, intraday opportunists, and precision chartists alike.

FunkyQuokka's $ Volume💡 Why $ Volume Matters
Share volume alone is a half-truth — 1M shares traded at $5 isn’t the same as 1M shares at $500. That’s where dollar volume steps in, offering a far more accurate view of institutional interest, breakout validity, liquidity zones and overall trader conviction.
📈 Features:
Clean histogram of dollar volume (close × volume)
Orange line showing customizable average $ volume
K/M/B formatting for axis scale (no huge ugly numbers)
Minimal design to blend into a multi-pane layout
⚙️ Inputs:
Tweakable average length – defaults to 20
By FunkyQuokka 🦘

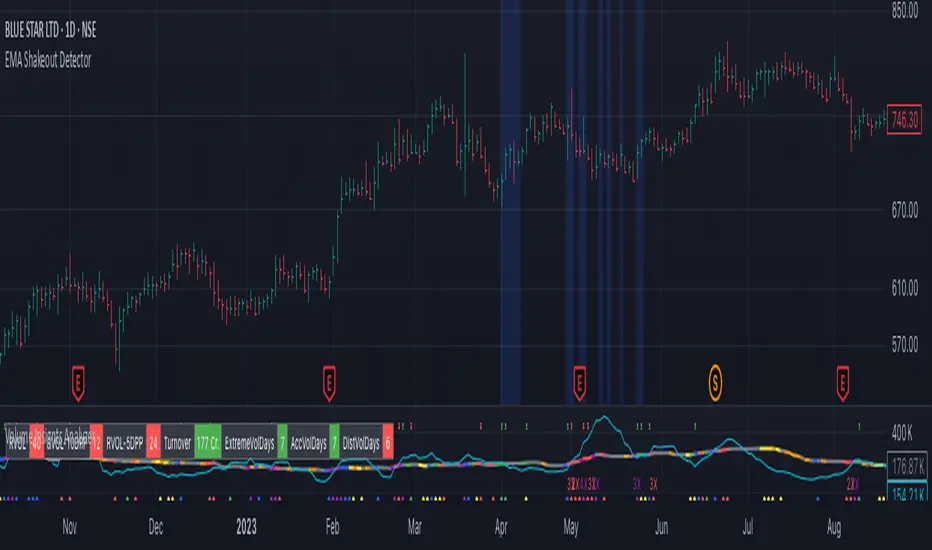
EMA Shakeout DetectorEMA Shakeout & Reclaim Zones
Description:
This Pine Script helps traders quickly identify potential shakeout entries based on price action and volume dynamics. Shakeouts often signal strong accumulation, where institutions drive the stock below a key moving average before reclaiming it, creating an opportunity for traders to enter at favorable prices.
How It Works:
1. Volume Surge Filtering:
a. Computes the 51-day Simple Moving Average (SMA) of volume.
b. Identifies days where volume surged 2x above the 51-day average.
c. Filters stocks that had at least two such high-volume days in the last 21 trading days (configurable).
2. Stock Selection Criteria:
a. The stock must be within 25% of its 52-week high.
b. It should have rallied at least 30% from its 52-week low.
Shakeout Conditions:
1. The stock must be trading above the 51-day EMA before the shakeout.
2. A sudden price drop of more than 10% occurs, pushing the stock below the 51-day EMA.
3. A key index (e.g., Nifty 50, S&P 500) must be trading above its 10-day EMA, ensuring overall market strength.
Visualization:
Shakeout zones are highlighted in blue, making it easier to spot potential accumulation areas and study price & volume action in more detail.
This script is ideal for traders looking to identify institutional shakeouts and gain an edge by recognizing high-probability reversal setups.
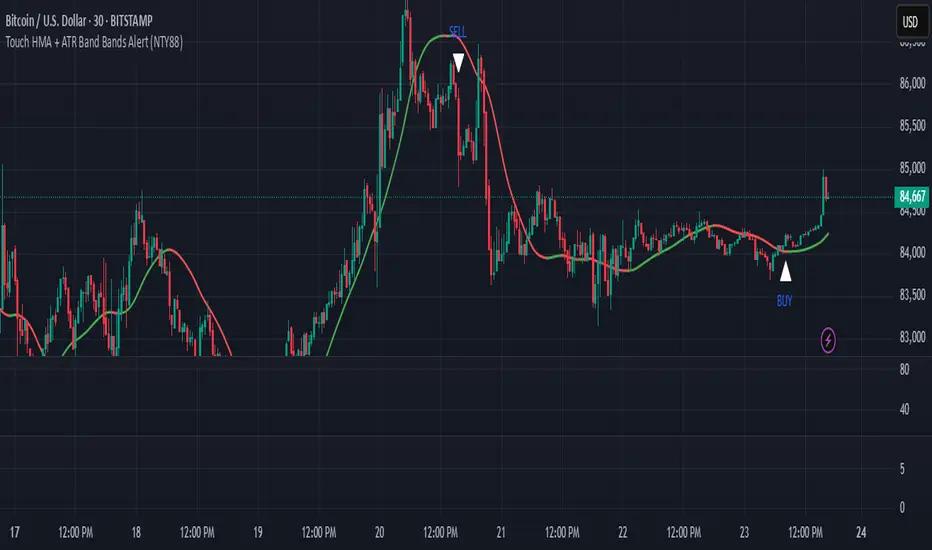
Touch HMA + ATR Band Bands Alert (NTY88)🔔 Precision Alerts | No Repainting | ATR-Based Touch Detection | HMA Trend Coloring
This script is a clean and powerful tool designed to help you catch precise market reversals using ATR Band touches combined with trend-following logic.
📌 How It Works
A custom Hull Moving Average (HMA) is used to track the trend.
Two dynamic ATR-based bands are drawn above and below the HMA.
A signal is generated when the closing price touches the upper or lower ATR band within a small tolerance zone.
✅ Key Features
🔁 Alternating Signals: Only one Buy → then one Sell → then Buy again. No signal spam.
🟢🔴 Color-Changing HMA Line: Green = HMA rising | Red = HMA falling
📏 Price Tolerance Input: Define how close the candle must be to the ATR band to trigger a signal.
🔔 Real-Time Alerts: Easily set alerts for Buy and Sell signals — works in live markets.
🚫 No Repainting: All signals are confirmed at candle close and will not change afterward.
🎯 When to Use
Great for trend reversals, scalping zones, or identifying potential exhaustion points.
Works well on any timeframe or market (crypto, stocks, forex).
💬 Pro Tip:
Combine this with RSI, Volume, or ADX filters to build a complete confluence system.
📈 Built for traders who love clean logic, precision entries, and visual clarity.
Highest High Line with Multi-Timeframe Supertrend and RSIOverview:
This powerful indicator combines three essential elements for traders:
Highest High Line – Tracks the highest price over a customizable lookback period across different timeframes.
Multi-Timeframe Supertrend – Displays Supertrend values and trend directions for multiple timeframes simultaneously.
Relative Strength Index (RSI) – Shows RSI values across different timeframes for momentum analysis.
Features:
✅ Customizable Highest High Line:
Selectable timeframes: Daily, Weekly, Monthly, Quarterly, Yearly
Adjustable lookback period
✅ Multi-Timeframe Supertrend:
Supports 1min, 5min, 10min, 15min, 30min, 1H, Daily, Weekly, Monthly, Quarterly, Yearly
ATR-based calculation with configurable ATR period and multiplier
Identifies bullish (green) & bearish (red) trends
✅ Multi-Timeframe RSI:
Calculates RSI for the same timeframes as Supertrend
Overbought (≥70) and Oversold (≤30) signals with color coding
✅ Comprehensive Table Display:
A clean, structured table in the bottom-right corner
Displays Supertrend direction, value, and RSI for all timeframes
Helps traders quickly assess trend and momentum alignment
How to Use:
Use the Highest High Line to identify key resistance zones.
Confirm trend direction with Multi-Timeframe Supertrend.
Check RSI values to avoid overbought/oversold conditions before entering trades.
Align multiple timeframes for stronger confirmation of trend shifts.
Ideal For:
✅ Scalpers (lower timeframes: 1m–30m)
✅ Swing Traders (higher timeframes: 1H–D)
✅ Position Traders (Weekly, Monthly, Quarterly)
💡 Tip: Look for Supertrend & RSI confluence across multiple timeframes for higher probability setups.
