[astropark] Trend Is Your Friend V1 [alarms]Dear Followers,
today another awesome Swing and Scalping Trading Strategy indicator, runnable on a bot , which works great on High Timeframes (1D is suggested) but also on lower ones (just write me in order to help you find correct settings) and even better on 1m Renko chart!
If you are a scalper, you will love suggested entries for fast profit. You can run it on 1h timeframe (below is not suggested, there is "no-trend" below 1h!) if you are used to scalp trading and close each trade whenever you feel happy (a proper trailing stop strategy is suggested anyway).
This strategy let's you edit following settings:
enable/disable signals on chart
enable/disable showing trend cloud
enable/disable bar coloring based on trend
enable/disable background coloring based on trend
enable a special option to enhance trend cloud on FOREX/Stocks charts (optional)
edit trend period length (you have to increase it if you go on lower timeframes, like 1h)
This strategy only trigger 1 buy or 1 sell. In order to get notified when a signal is triggered, you need to use the "alarms" version of this indicator.
Strategy results are calculated on the timeframe from August 2017 to now, so on almost 2 years and half, using 10000$ as initial capital and working at 1x leverage (so no leverage at all! If you like to use leverage, be sure to use a safe option, like 3x or 5x at most in order to have liquidation price very far).
This is not the "Holy Grail", so use a proper risk management strategy.
This script will let you set all notifications you may need in order to be alerted on each triggered signals.
The one for backtesting purpose can be found by searching for the astropark's "trend is your friend" and then choosing the indicator with "strategy" suffix in the name, or you can find here below
This is a premium indicator , so send me a private message in order to get access to this script.
Swingtrading

[astropark] Trend Is Your Friend V1 [strategy]Dear Followers,
today another awesome Swing and Scalping Trading Strategy indicator, runnable on a bot , which works great on High Timeframes (1D is suggested) but also on lower ones (just write me in order to help you find correct settings) and even better on 1m Renko chart!
If you are a scalper, you will love suggested entries for fast profit. You can run it on 1h timeframe (below is not suggested, there is "no-trend" below 1h!) if you are used to scalp trading and close each trade whenever you feel happy (a proper trailing stop strategy is suggested anyway).
This strategy let's you edit following settings:
enable/disable signals on chart
enable/disable showing trend cloud
enable/disable bar coloring based on trend
enable/disable background coloring based on trend
enable a special option to enhance trend cloud on FOREX/Stocks charts (optional)
edit trend period length (you have to increase it if you go on lower timeframes, like 1h)
This strategy only trigger 1 buy or 1 sell. In order to get notified when a signal is triggered, you need to use the "alarms" version of this indicator.
Strategy results are calculated on the timeframe from August 2017 to now, so on almost 2 years and half, using 10000$ as initial capital and working at 1x leverage (so no leverage at all! If you like to use leverage, be sure to use a safe option, like 3x or 5x at most in order to have liquidation price very far).
This is not the "Holy Grail", so use a proper risk management strategy.
This script will let you backtest how the indicator will perform on any chart you may test. Of course results will be very different depending on the chart and timeframe you will open. I tested a lot of charts and always you can find a combination that keep this strategy in profit on swing trading style (and this means that if you can have a daily look at the chart you can always manage to maximize your profit on each trade!)
The alarms version of this indicator, which will let you set all notifications you may need in order to be alerted on each triggered signals, can be found by searching for the astropark's "trend is your friend" and then choosing the indicator with "alarms" suffix in the name.
This is a premium indicator , so send me a private message in order to get access to this script.

[astropark] Ichimoku Cloud Strategy [alarms]Dear Followers,
today a Great Swing Trading Strategy , runnable on a bot , which works great on High Timeframes (1D is suggested!) but also even better on 1m Renko chart.
If you are a scalper, you will love suggested entries for fast profit. You can run it on 1h timeframe (below is not suggested) if you are used to scalp trading and close each trade whenever you feel happy (a proper trailing stop strategy is suggested anyway).
This strategy is based on the Ichimoku Cloud Indicator and let's you set a lot of settings:
works on all timeframes (but 1D and above is suggested on normal candlesticks chart)
you can run this indicator on 1m Renko chart (be sure to enable the "USING RENKO CHART? ENABLE THIS OPTION" setting)
you can use 4 kind of Ichimoku Cloud (Custom, Slow, Standard and Fast - keep only one enabled)
you can make the Ichimoku Cloud show or not
you can enable showing the possibile re-entries
you can enable an heiking ashi analysis
you can enable a trailing stop strategy ("Auto Trailing Stop Loss" and "Close Trade When Price Breaks Above the Ichimoku Cloud" are two options very much suggested to keep enabled, especially on bot trading)
you can create your own trailing stop stategy and take profit strategy
you can enable a simple take profit strategy based on RSI Overbought and Oversold levels
This strategy only trigger 1 buy or 1 sell, but if you missed the possibility to open your long or short position don't get mad, but just enable the "show re-entry signals" option, so yout will be able to enter again (be sure to always use a proper money management ).
By the way, you can set any alarms you like in order to get notified when any kind of signal is triggered (you need to use the "alarms" version for this).
Strategy results are calculated on the timeframe from May 2017 to now, so on 2 years and half, using 10000$ as initial capital and working at 1x leverage (so no leverage at all! If you like to use leverage, be sure tp use a safe option, like 3x or 5x at most in order to have liquidation price very far).
This is not the "Holy Grail", so use a proper risk management strategy.
This script will let you set all notifications you may need in order to be alerted on each triggered signals (there is also an "ALL-IN-ONE" option for free tradingview users.
The backtesting version of this indicator, which will let you backtest how the indicator will perform on any chart you may test, can be found by searching for "Ichimoku Cloud Strategy" and then choosing the astropark indicator with "red and green arrows" at the end of the name. You can find it here below too:
This is a premium indicator , so send me a private message in order to get access to this script.

[astropark] Ichimoku Cloud StrategyDear Followers,
today a Great Swing Trading Strategy , runnable on a bot , which works great on High Timeframes (1D is suggested!) but also even better on 1m Renko chart.
If you are a scalper, you will love suggested entries for fast profit. You can run it on 1h timeframe (below is not suggested) if you are used to scalp trading and close each trade whenever you feel happy (a proper trailing stop strategy is suggested anyway).
This strategy is based on the Ichimoku Cloud Indicator and let's you set a lot of settings:
works on all timeframes (but 1D and above is suggested on normal candlesticks chart)
you can run this indicator on 1m Renko chart (be sure to enable the "USING RENKO CHART? ENABLE THIS OPTION" setting)
you can use 4 kind of Ichimoku Cloud (Custom, Slow, Standard and Fast - keep only one enabled)
you can make the Ichimoku Cloud show or not
you can enable showing the possibile re-entries
you can enable an heiking ashi analysis
you can enable a trailing stop strategy ("Auto Trailing Stop Loss" and "Close Trade When Price Breaks Above the Ichimoku Cloud" are two options very much suggested to keep enabled, especially on bot trading)
you can create your own trailing stop stategy and take profit strategy
you can enable a simple take profit strategy based on RSI Overbought and Oversold levels
This strategy only trigger 1 buy or 1 sell, but if you missed the possibility to open your long or short position don't get mad, but just enable the "show re-entry signals" option, so yout will be able to enter again (be sure to always use a proper money management ).
By the way, you can set any alarms you like in order to get notified when any kind of signal is triggered (you need to use the "alarms" version for this).
Strategy results are calculated on the timeframe from January 2016 to now, so on 3 years, using 10000$ as initial capital, doing only 6 trades (great swings!) and working at 1x leverage (so no leverage at all! perfect spot trading style!). If you like to use leverage, be sure tp use a safe option, like 3x or 5x at most in order to have liquidation price very far).
This is not the "Holy Grail", so use a proper risk management strategy.
This script will let you backtest how the indicator will perform on any chart you may test. Of course results will be very different depending on the chart you will open. I tested a lot of charts and always you can find a combination that keep this strategy in profit on swing trading style (and this means that if you can have a daily look at the chart you can always manage to maximize your profit on each trade!
The alarms version of this indicator, which will let you set all notifications you may need in order to be alerted on each triggered signals, can be found by searching for "astropark Ichimoku Cloud Strategy" and then choosing the "astropark" indicator with "alarms" suffix in the name.
This is a premium indicator , so send me a private message in order to get access to this script.

Donchain BreakoutIt is a long only strategy.
1. Buy when price breaks out of the upper band.
2. Exit has two options. Option 1 allows you to exit using lower band. Option 2 allows you to exit using basis line.
3. Slippage and commissions are not considered in the return calculation.

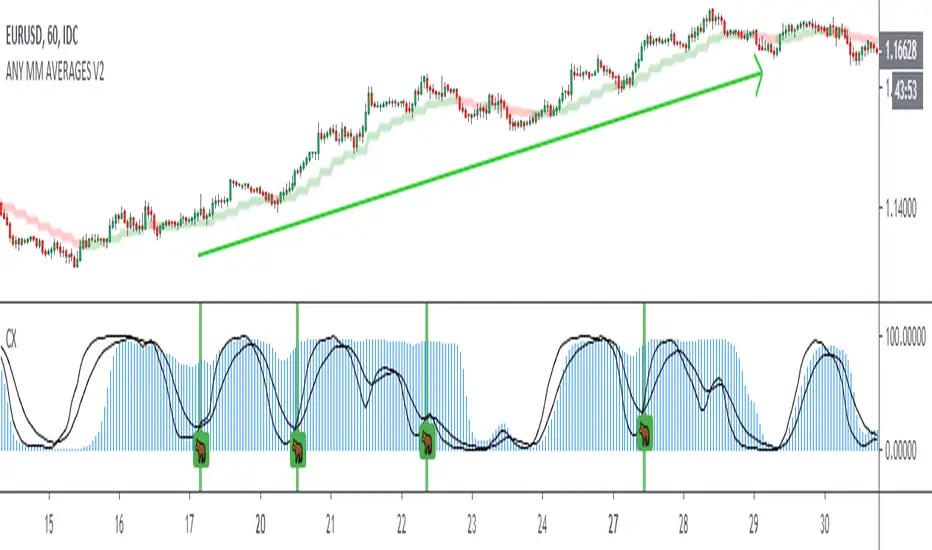
Crack XThis indicator looks for cracks (de-correlation of 2 indicators), what you have to do is simple, first look at the trend in a higher frame, there are many indicators for this, then look for cracks as wide as possible (you can configure the size in the configuration) and that they are not close to important supports / resistances. This indicator can be very useful for Swing, Coverages, to increase existing positions.The confirmation of the crack occurs when the black lines cross + bar closure.
- Added Alerts
Land & SeaI have placed what is needed to know about the indicator at the start of the script. I also placed some hints on the chart.

All Instrument Swing Trader with Pyramids, DCA and Leverage
Introduction
This is my most advanced Pine 4 script so far. It combines my range trader algorithms with my trend following pyramids all on a single interval. This script includes my beta tested DCA feature along with simulated leverage and buying power calculations. It has a twin study with several alerts. The features in this script allow you to experiment with different risk strategies and evaluate the approximate impact on your account capital. The script is flexible enough to run on instruments from different markets and at various bar intervals. This strategy can be run in three different modes: long, short and bidirectional. The bidirectional mode has two split modes (Ping Pong and BiDir). It also generates a summary report label with information not available in the TradingView Performance report such as Rate Of Return Standard Deviation and other Sharpe Ratio input values. Notable features include the following:
- Swing Trading Paradigm
- Uni or Bidirectional trading modes
- Calculation presets for Crypto, Stocks and Forex
- Conditional Minimum Profit
- Hard stop loss field
- Two types of DCA (Positive and Negative)
- Discretionary Pyramid levels with threshold adjustment and limiter
- Consecutive loss counter with preset and label
- Reentry loss limiter and trade entry caution fields
- Simulated Leverage and margin call warning label (approximation only)
- Buying power report labels (approximation only)
- Rate Of Return report with input values for Sharpe Ratio, Sortino and others
- Summary report label with real-time status indicators
- Trend follow bias modes (Its still range trading)
- Six anti-chop settings
- Single interval strategy to reduce repaint occurrence
This is a swing trading strategy so the behavior of this script is to buy on weakness and sell on strength. As such trade orders are placed in a counter direction to price pressure. What you will see on the chart is a short position on peaks and a long position on valleys. Just to be clear, the range as well as trends are merely illusions as the chart only receives prices. However, this script attempts to calculate pivot points from the price stream. Rising pivots are shorts and falling pivots are longs. I refer to pivots as a vertex in this script which adds structural components to the chart formation (point, sides and a base). When trading in “Ping Pong” mode long and short positions are intermingled continuously as long as there exists a detectable vertex. Unfortunately, this can work against your backtest profitability on long duration trends where prices continue in a single direction without pullback. I have designed various features in the script to compensate for this event. A well configured script should perform in a range bound market and minimize losses in a trend. For a range trader the trend is most certainly not your friend. I also have a trend following version of this script for those not interested in trading the range.
This script makes use of the TradingView pyramid feature accessible from the properties tab. Additional trades can be placed in the draw-down space increasing the position size and thereby increasing the profit or loss when the position finally closes. Each individual add on trade increases its order size as a multiple of its pyramid level. This makes it easy to comply with NFA FIFO Rule 2-43(b) if the trades are executed here in America. The inputs dialog box contains various settings to adjust where the add on trades show up, under what circumstances and how frequent if at all. Please be advised that pyramiding is an advanced feature and can wipe out your account capital if your not careful. You can use the “Performance Bond Leverage” feature to stress test your account capital with varying pyramid levels during the backtest. Use modest settings with realistic capital until you discover what you think you can handle. See the“Performance Bond Leverage” description for more information.
In addition to pyramiding this script employs DCA which enables users to experiment with loss recovery techniques. This is another advanced feature which can increase the order size on new trades in response to stopped out or winning streak trades. The script keeps track of debt incurred from losing trades. When the debt is recovered the order size returns to the base amount specified in the TV properties tab. The inputs for this feature include a limiter to prevent your account from depleting capital during runaway markets. The main difference between DCA and pyramids is that this implementation of DCA applies to new trades while pyramids affect open positions. DCA is a popular feature in crypto trading but can leave you with large “bags” if your not careful. In other markets, especially margin trading, you’ll need a well funded account and much experience.
To be sure pyramiding and dollar cost averaging is as close to gambling as you can get in respectable trading exchanges. However, if you are looking to compete in a Forex contest or want to add excitement to your trading life style those features could find a place in your strategies. Although your backtest may show spectacular gains don’t expect your live trading account to do the same. Every backtest has some measure to data mining bias. Please remember that.
This script is equipped with a consecutive loss counter. A limit field is provided in the report section of the input dialog box. This is a whole number value that, when specified, will generate a label on the chart when consecutive losses exceed the threshold. Every stop hit beyond this limit will be reported on a version 4 label above the bar where the stop is hit. Use the location of the labels along with the summary report tally to improve the adaptability of system. Don’t simply fit the chart. A good trading system should adapt to ever changing market conditions. On the study version the consecutive loss limit can be used to halt live trading on the broker side (managed manually).
This script can simulate leverage applied to your account capital. Basically, you want to know if the account capital you specified in the properties tab is sufficient to trade this script with the order size, pyramid and DCA parameters needed. TradingView does not halt trading when the account capital is depleted nor do you receive notification of such an event. Input the leverage you intend to trade with and simulate the stress on your account capital. When the check box labeled “Report Margin Call” is enabled a marker will plot on the chart at the location where the threshold was breached. Additionally, the Summary Report will indicated such a breach has occurred during the backtest. Please note that the margin calculation uses a performance bond contract model which is the same type of leverage applied to Forex accounts. This is not the same leverage as stock margin accounts since shares are not actually borrowed. It is also not applicable to futures contracts since we do not calculate maintenance margin. Also note that the account margin and buying power are calculated using the U.S. Dollar as a funding currency. Margin rules across the globe vary considerably so use this feature as an approximation. The “Report Margin Call” plot only appears on negative buying power which is well beyond the NFA enforced margin closeout price. Vary the order size and account capital and activate the buying power plot to get as close as you can to the desired margin call threshold. Also keep in mind that rollover fees, commissions, spreads, etc affect the margin call in actual live trading. This feature does not include any of those costs.
Inputs
The script input dialog box is divided into five sections. The last section, Section 5, contains all of the script reporting options. Notable reporting options are the inputs which provide support for calculating actual Sharpe Ratios and other risk / performance metrics. The TradingView performance report does not produce a scalable Sharpe Ratio which is unfortunate considering the limited data supplied to the backtest. Three report fields made available in this section are intended to enable users to measure the performance of this script using various industry standard risk metrics. In particular, The Sharpe Ratio, Sortino Ratio, Alpha Calculation, Beta Calculation, R-Squared and Monthly Standard Deviation. The following fields are dedicated to this effort:
– ROR Sample Period - Integer number which specifies the rate of return period. This number is a component of the Sharpe Ratio and determines the number of sample periods divisible in the chart data. The number specified here is the length of the period measured in bar intervals. Since the quantity of TradingView historical data is limited this number should reflect the scalar value applied to your Sharpe calculation. When the checkbox “Report Period ROR” is enabled red boxes plot on the dates corresponding to the ROR sample period. The red boxes display information useful in calculating various risk and performance models. Ongoing buying power is included in the period report which is especially useful in assessing the DCA stress on account capital. Important: When the “ROR Sample Period” is specified the script computes the ROR mean value and displays the result in the summary report label on the live end of the chart. Use this number to calculate the historical standard deviation of period returns.
– Return Mean Value - This is the ROR mean value which is displayed in the summary report field “ROR Mean”. Enter the value shown in the summary report here in order to calculate the standard deviation of returns. Once calculated the result is displayed in the summary report field “Standard Dev”. Please note that ROR and standard deviation are calculated on the quote currency of the chart and not the account currency. If you intend to calculate risk metrics based on other denominated returns use the period calculations in a spreadsheet. Important: Do not change the account denomination on the properties tab simply to force a dollar calculation. It will alter the backtest itself since the minimum profit, stop-loss and other variables are always measured in the quote currency of the chart.
– Report Period ROR - This checkbox is used to display the ROR period report which plots a red label above the bars corresponding to the ROR sample period. The sample period is defined by the value entered into the “ROR Sample Period” field. This checkbox only determines if the period labels plot on the chart. It does not enable or disable the ROR calculation itself. Please see input description“ROR Sample Period” for a detailed description of this feature.
Design
This script uses twelve indicators on a single time frame. The original trading algorithms are a port from a much larger program on another trading platform. I’ve converted some of the statistical functions to use standard indicators available on TradingView. The setups make heavy use of the Hull Moving Average in conjunction with EMAs that form the Bill Williams Alligator as described in his book “New Trading Dimensions” Chapter 3. Lag between the Hull and the EMAs form the basis of the entry and exit points. The vertices are calculated using one of five featured indicators. Each indicator is actually a composite of calculations which produce a distinct mean. This mathematical distinction enables the script to be useful on various instruments which belong to entirely different markets. In other words, at least one of these indicators should be able generate pivots on an arbitrarily selected instrument. Try each one to find the best fit.
The entire script is around 2200 lines of Pine code which pushes the limits of what can be created on this platform given the TradingView maximums for: local scopes, run-time duration and compile time. This script incorporates code from both my range trader and trend following published programs. Both have been in development for nearly two years and have been in beta test for the last several months. During the beta test of the range trading script it was discovered that by widening the stop and delaying the entry, add on trading opportunities appeared on the chart. I determined that by sacrificing a few minor features code space could be made available for pyramiding capability in the range trader. The module has been through several refactoring passes and makes extensive use of ternary statements. As such, It takes a full three minutes to compile after adding it to a chart. Please wait for the hovering dots to disappear before attempting to bring up the input dialog box. For the most part the same configuration settings for the range script can be applied to this script.
Inputs to the script use cone centric measurements in effort to avoid exposing adjustments to the various internal indicators. The goal was to keep the inputs relevant to the actual trade entry and exit locations as opposed to a series of MA input values and the like. As a result the strategy exposes over 70 inputs grouped into long or short sections. Inputs are available for the usual minimum profit and stop-loss as well as safeguards, trade frequency, pyramids, DCA, modes, presets, reports and lots of calibrations. The inputs are numerous, I know. Unfortunately, at this time, TradingView does not offer any other method to get data in the script. The usual initialization files such as cnf, cfg, ini, json and xml files are currently unsupported.
I have several example configuration settings that I use for my own trading. They include cryptocurrencies and forex instruments on various time frames.
Indicator Repainting and Anomalies
Indicator repainting is an industry wide problem which mainly occurs when you mix backtest data with real-time data. It doesn't matter which platform you use some form of this condition will manifest itself on your chart over time. The critical aspect being whether live trades on your broker’s account continue to match your TradingView study.
Based on my experience with Pine, most of the problems stem from TradingView’s implementation of multiple interval access. Whereas most platforms provide a separate bar series for each interval requested, the Pine language interleaves higher time frames with the primary chart interval. The problem is exacerbated by allowing a look-ahead parameter to the Security function. The goal of my repaint prevention is simply to ensure that my signal trading bias remains consistent between the strategy, study and broker. That being said this is what I’ve done address this issue in this script:
1. This script uses only 1 time frame. The chart interval.
2. Every entry and exit condition is evaluated on closed bars only.
3. No security functions are called to avoid a look-ahead possibility.
4. Every contributing factor specified in the TradingView wiki regarding this issue has been addressed.
5. Entry and exit setups are not reliant on crossover conditions.
6. I’ve run a 10 minute chart live for a week and compared it to the same chart periodically reloaded. The two charts were highly correlated with no instances of completely opposite real-time signals. I do have to say that there were differences in the location of some trades between the backtest and the study. But, I think mostly those differences are attributable to trading off closed bars in the study and the use of strategy functions in the backtest.
The study does indeed bring up the TV warning dialog. The only reason for this is because the script uses an EMA indicator which according to TradingView is due to “peculiarities of the algorithm”. I use the EMA for the Bill Williams Alligator so there is no way to remove it.
One issue that comes up when comparing the strategy with the study is that the strategy trades show on the chart one bar later than the study. This problem is due to the fact that “strategy.entry()” and “strategy_exit()” do not execute on the same bar called. The study, on the other hand, has no such limitation since there are no position routines.
Please be aware that the data source matters. Cryptocurrency has no central tick repository so each exchange supplies TradingView its feed. Even though it is the same symbol the quality of the data and subsequently the bars that are supplied to the chart varies with the exchange. This script will absolutely produce different results on different data feeds of the same symbol. Be sure to backtest this script on the same data you intend to receive alerts for. Any example settings I share with you will always have the exchange name used to generate the test results.
Usage
The following steps provide a very brief set of instructions that will get you started but will most certainly not produce the best backtest. A trading system that you are willing to risk your hard earned capital will require a well crafted configuration that involves time, expertise and clearly defined goals. As previously mentioned, I have several example configs that I use for my own trading that I can share with you. To get hands on experience in setting up your own symbol from scratch please follow the steps below.
The input dialog box contains over 70 inputs separated into five sections. Each section is identified as such with a makeshift separator input. There are three main areas that must to be configured: long side, short side and settings that apply to both. The rest of the inputs apply to pyramids, DCA, reporting and calibrations. The following steps address these three main areas only. You will need to get your backtest in the black before moving on to the more advanced features.
Step 1. Setup the Base currency and order size in the properties tab.
Step 2. Select the calculation presets in the Instrument Type field.
Step 3. Select “No Trade” in the Trading Mode field.
Step 4. Select the Histogram indicator from Section 2. You will be experimenting with different ones so it doesn’t matter which one you try first.
Step 5. Turn on Show Markers in Section 2.
Step 6. Go to the chart and checkout where the markers show up. Blue is up and red is down. Long trades show up along the red markers and short trades on the blue.
Step 7. Make adjustments to “Base To Vertex” and “Vertex To Base” net change and roc in Section 3. Use these fields to move the markers to where you want trades to be.
Step 8. Try a different indicator from Section 2 and repeat Step 7 until you find the best match for this instrument on this interval. This step is complete when the Vertex settings and indicator combination produce the most favorable results.
Step 9. Go to Section 3 and enable “Apply Red Base To Base Margin”.
Step 10. Go to Section 4 and enable “Apply Blue Base To Base Margin”.
Step 11. Go to Section 2 and adjust “Minimum Base To Base Blue” and “Minimum Base To Base Red”. Observe the chart and note where the markers move relative to each other. Markers further apart will produce less trades but will reduce cutoffs in “Ping Pong” mode.
Step 12. Return to Section 3 and 4 and turn off “Base To Base Margin” which was enabled in steps 9 and 10.
Step 13. Turn off Show Markers in Section 2.
Step 14. Put in your Minimum Profit and Stop Loss in the first section. This is in pips or currency basis points (chart right side scale). Percentage is not currently supported. This is a fixed value minimum profit and stop loss. Also note that the profit is taken as a conditional exit on a market order not a fixed limit. The actual profit taken will almost always be greater than the amount specified (due to the exit condition). The stop loss, on the other hand, is indeed a hard number which is executed by the TradingView broker simulator when the threshold is breached. On the study version, the stop is executed at the close of the bar.
Step 15. Return to step 3 and select a Trading Mode (Long, Short, BiDir, Ping Pong). If you are planning to trade bidirectionally its best to configure long first then short. Combine them with “BiDir” or “Ping Pong” after setting up both sides of the trade individually. The difference between “BiDir” and “Ping Pong” is that “Ping Pong” uses position reversal and can cut off opposing trades less than the specified minimum profit. As a result “Ping Pong” mode produces the greatest number of trades.
Step 16. Take a look at the chart. Trades should be showing along the markers plotted earlier.
Step 17. Make adjustments to the Vertex fields in Section 2 until the TradingView performance report is showing a profit. This includes the “Minimum Base To Base” fields. If a profit cannot be achieved move on to Step 18. Other adjustments may make a crucial difference.
Step 18. Improve the backtest profitability by adjusting the “Entry Net Change” and “Entry ROC” in Section 3 and 4.
Step 19. Enable the “Mandatory Snap” checkbox in Section 3 and 4 and adjust the “Snap Candle Delta” and “Snap Fractal Delta” in Section 2. This should reduce some chop producing unprofitable reversals.
Step 20. Increase the distance between opposing trades by adding an “Interleave Delta” in Sections 3 and 4. This is a floating point value which starts at 0.01 and typically does not exceed 2.0.
Step 21. Increase the distance between opposing trades even further by adding a “Decay Minimum Span” in Sections 3 and 4. This is an absolute value specified in the symbol’s quote currency (right side scale of the chart). This value is similar to the minimum profit and stop loss fields in Section 1.
Step 22. Improve the backtest profitability by adjusting the “Sparse Delta” in Section 3 and 4.
Step 23. Improve the backtest profitability by adjusting the “Chase Delta” in Section 3 and 4.
Step 24. Improve the backtest profitability by adjusting the “Adherence Delta” in Section 3 and 4. This field requires the “Adhere to Rising Trend” checkbox to be enabled.
Step 25. Try each checkbox in Section 3 and 4. See if it improves the backtest profitability. The “Caution Lackluster” checkbox only works when “Caution Mode” is enabled.
Step 26. Enable the reporting conditions in Section 5. Look for long runs of consecutive losses or high debt sequences. These are indications that your trading system cannot withstand sudden changes in market sentiment.
Step 27. Examine the chart and see that trades are being placed in accordance with your desired trading goals. This is an important step. If your desired model requires multiple trades per day then you should be seeing hundreds of trades on the chart. Alternatively, you may be looking to trade fewer steep peaks and deep valleys in which case you should see trades at major turning points. Don’t simply settle for what the backtest serves you. Work your configuration until the system aligns with your desired model. Try changing indicators and even intervals if you cannot reach your simulation goals. Generally speaking, the histogram and Candle indicators produce the most trades. The Macro indicator captures the tallest peaks and valleys.
Step 28. Apply the backtest settings to the study version and perform forward testing.
This script is open for beta testing. After successful beta test it will become a commercial application available by subscription only. I’ve invested quite a lot of time and effort into making this the best possible signal generator for all of the instruments I intend to trade. I certainly welcome any suggestions for improvements. Thank you all in advance.
One final note. I'm not a fan of having the Performance Overview (blue wedge) automatically show up at the end of the publish page since it could be misleading. On the EUR/USD backtest showing here I used a minimum profit of 65 pips, a stop of 120 pips, the candle indicator and a 5 pyramid max value. Also Mark Pyramid Levels (blue triangles) are enabled along with a 720 ROR Sample Period (red labels).

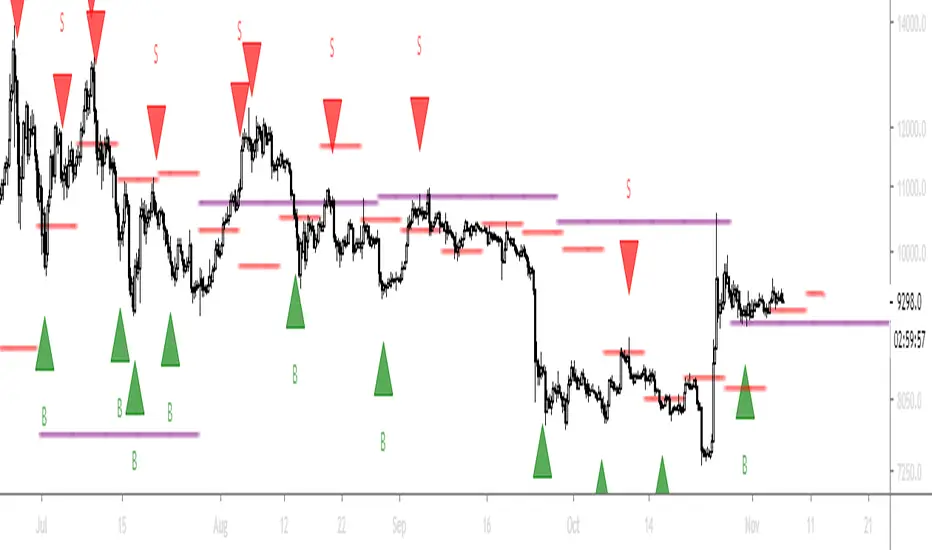
[astropark] Support Resistance Trendlines Swing PointDear Followers,
I'm very happy to publish this new tool, which will help you easily find
basic trend momentum (red if a bearish momentum is found, green viceversa)
Support Levels (where you can place your buy orders or short targets)
Resistance Levels (where you can place your sell orders or long targets)
Trendlines , known as diagonal supports and resistances (if price breaks a green one, then it's time to buy/long! otherwise if price breaks a red one, then it's time to sell/short)
Donchian Channel , which will memorize for you latest highs and lows, which may get retested for example
Swing Point , very useful point where to open a position while price holding above or below it
This script:
works on all timeframes
lets you edit each support-resistance cloud settings
lets you activate a third support-resistance cloud if you like
lets you choose if enable only one or disable all of them or whatever combination...
lets you choose to enable or disable trendlines, basic trend, donchian channel, swing point, etc... So very customizable user experience!
This is a premium indicator , so send me a private message in order to get access to this script.

(13) Twists Swing/Day VS-478TWISTS adds a simple, but very effective twist to utilizing a multiple moving average crossover systems, enabling the effective and profitable trading of any stock, crypto or commodity. This enables trend, swing and day traders to dramatically improve their results over a similar, short-term simple, smoothed, exponential or weighted moving average crossover system.
Four distinct Laguerre filters are applied to the price, one fast, one medium one long and one very long. The default Laguerre settings are: Short = 0; Medium = 0.33, Long = 0.55 XLong = 0.77. The correlation between the length of time and the Laguerre output is adjustable in the format > inputs pane for this indicator and are referred to as gamma. The first three lengths produce two major bands or ribbons. During up trends the top band is filled with green and during down trends this top band will be filled with red. Obviously these bands or ribbons are twisting or flipping positions when the direction of the price trends change. Trading indicator dots are produced during both phases. Green dots for uptrends and red dots during down trends. During consolidation phases it is possible that there will be no dots produced because of the rule set applied to these Entry/hold and Exit/short indicator dots.
TWISTS is a triple moving average trading system using an advanced smoothing filter developed by John Ehlers. You can read about this dramatic advancement in moving averages in the following article: Time Warp -- Without Space Travel. You can find the link to this article on our site.
Access this Genie indicator for your Tradingview account, through our web site. (Links Below) This will provide you with additional educational information and reference articles, videos, input and setting options and trading strategies this indicator excels in.

(1) Genie Cycles VS-200The Genie Cycles indicator contains two primary components. The first generates the primary turning-point Entry/Exit signals based on a hybrid algorithms that utilize multiple moving filters and oscillators, all working in concert. The second is our version of Hurst Cycles allowing the trader to view the harmonic convergence of short and long cycles.
The turning-point signals are generated by two Center of Gravity Oscillators (COG) originally developed by John Ehlers and published in Technical Analysis of Stocks and Commodities in its May 2002 issue.
COG produces a moving filter that heavily weights the most extreme and most current values in the stream of data within the window of the indicator. COG excels at determining and indicating where, within a parabolic path, tipping or turning points have occurred. Two COG indicators, each one set to a different length and different inputs are incorporated. The output of these two COG filters are them put through another Ehler’s filter, the Pass Band; July 2016 issue of TAOSAC. A pass band filter has the unique ability of removing the higher and lower frequencies from the signal, leaving behind only the core signal. Here we are taking a longer COG period of (10) days, utilizing the candles body size as it’s input and then subtracting a short period of (7) days utilizing only the close of the day. The result is an emphasis on the extreme values, i.e., the maximum apex and the minimum vertex of each parabolic swing. Finally, the Arnaud Legoux Moving Average (ALMA) is utilized as smoothing a filter to slightly shift the weighting from the COG Pass band filter, in a selective and adjustable manor to more current bars, not the most current bar. This is desirable because COG dramatically emphasizes the most current candle or bar as well as large candles and strong deviations from within the moving average.
This provides the trader with excellent responsiveness within a very smooth output signal with very few artifacts or whipsaws, producing highly reliable trading signals that indicate optimal entry and exit points with a high level of accuracy and very little lag.
The primary principals of Hurst cycles are price moves in waves that exhibit cyclic attributes based on their time scales. Genie Cycles incorporates Hurst cycles theories, but utilizes only two nested Laguerre moving filters. Laguerre moving filters have significantly less lag than traditional moving averages. These moving filters take as there inputs the highest high and the lowest lows for the two adjustable periods. The point of the indicator is to determine when a short-term swing cycle harmonizes or aligns with a long-term cycle, i.e., determining when the tops and bottoms of these cycles align.
The resulting nested channels produce natural bounding boxes. This dramatically highlights likely support and resistance levels as they often occur at prior highs or lows that this indicator is drawing. Convergence of the different cycle lengths can indicate strong trends that make excellent trading opportunities. Decoupling of the cycles indicates the end of the trend.

SWING DELTAThis will show the price change between the high/low of each candlestick as an oscillator with configurable options to show Long/Short or both.

[astropark] Crypto Swing Trading [alarms]Dear Followers,
today a Swing Trading Strategy , runnable on a bot , which works great from 30m timeframe and above. Best suggested timeframes are 1h and 4h.
If you are a scalper, you will love suggested entries for fast profit. You can run it from 1 minute timeframe if you are used to scalp trading and close each trade whenever you fell happy (a proper trailing stop strategy is suggested anyway).
This indicator can trigger till 5 or 20 buy or sell signals in a row before reverting (it changes greatly depending on timeframe you use), so use a proper money management .
This script will let you set alarms whenever a Buy or a Sell signal is drawn on chart. This way you can set all notifications you may need in order to be alerted on each triggered signal.
The backtesting-strategy version of this script can be found here below or by searching for "Crypto Swing Trading" and then choosing the "strategy" version.
Strategy results are calculated on the timeframe from January 2018 to now, so on about 2 years, using 10000$ as initial capital and working at 3x leverage (very safe leverage!).
This is not the "Holy Grail", so use a proper risk management strategy.
This is a premium indicator , so send me a private message in order to get access to this script.

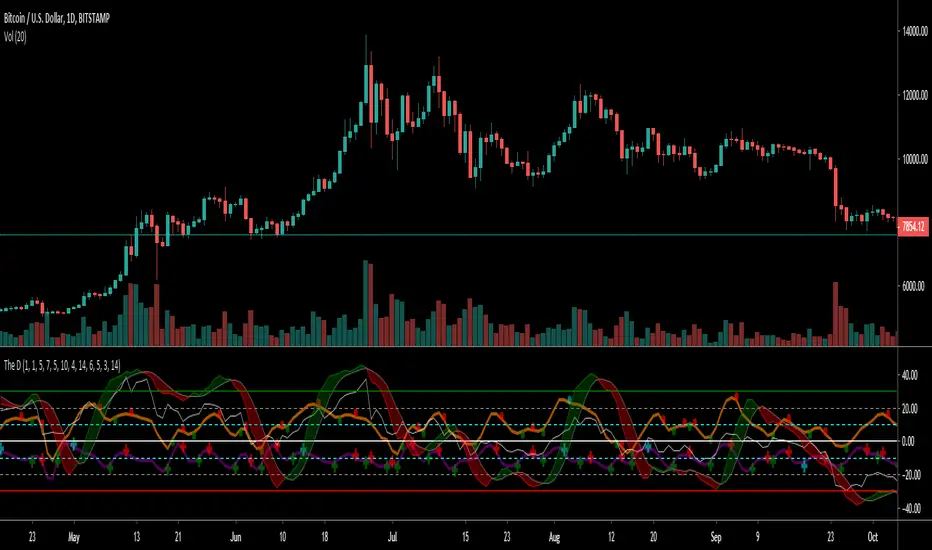
The DiamondThe Diamond is a collection of 3 custom oscillators and the RSI. It tries to visualizing how the momentum is increasing and decreasing and gives some buy and sell signals.
Every Line explained:
Orange line: The SMI(Swing Momentum Indicator) it is alternating oscillator between the value -10 and 40 and has its baseline at 10. It showing accumulation and increase of momentum and is used as a trend confirmation
Purple line: The BTD(Buy the Dip) is a modified Version of the SMI. It should be used in Bull or Bearflags to time entries. Also the Horizontal lines can be used as Support or Resistance
Green/Red Band: This one is a custom made stochastic. In its calculation it smoothing Tops/Lows to reduce noise. Also the look is better.
White line: Just a 14-lenght RSI. I use it together with the SMI and BTD to get confirmation
The Indicator is doing best in the crypto market. High market cap Coins/USDT Pairs do better than low market cap and btc pairs. Also it should be only used on timeframes greater than 4h. 6h and daily preferred. On higher time frames you need to adjust the values of the BTD and SMI.
Bearish divergence on both Indicators in a down trending market do give a good short entry.
Bullish divergence on the daily gives good swing entries in a downtrend
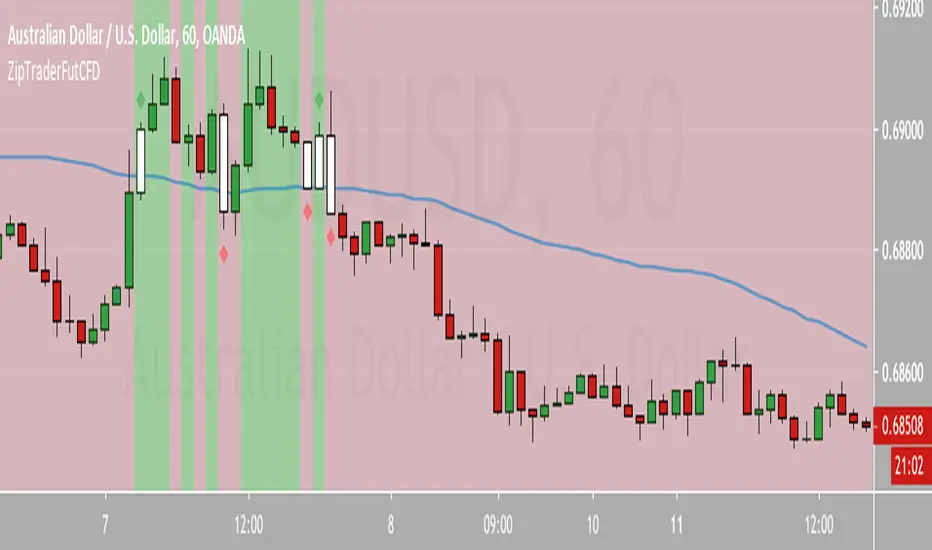
ZipTraderFuturesCFDThis is a script to be used for swing trading futures and CFD indices using the 1 Hour time frame. The script trades momentum with Trends and is a continuity strategy designed to capture intermediate moves out of indices and commodities
Main Trend Alert v1.1*** New Version of Main Trend Alert ***
This is an indicator that shows the main trend of and chart (crypto, forex, stock and etc). Good for day trading.
- HOW TO USE: When you are on lower timeframe, set the "Main Timeframe" to a higher timeframe from settings.
For example: Set "Main Timeframe = 1 Hour" when you are trading on 5 minute chart.
* Never trade just based on alerts of this script. Always use it with a system you like. Keep in mind that his script doesn't determine the stop loss and exit point.
* NO REPAINTS *
Good Luck,

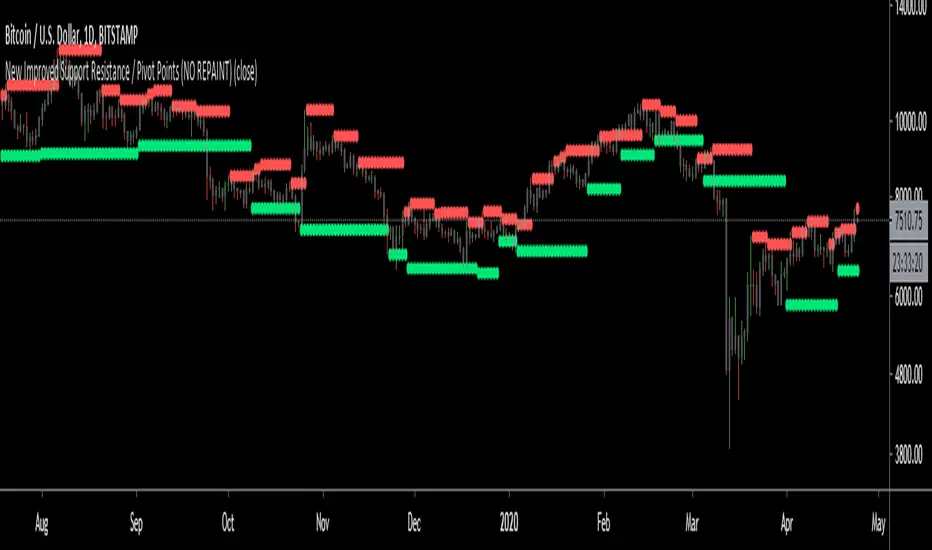
New Improved Support Resistance / Pivot Points (NO REPAINT)This indicator plots local pivot points / support resistance levels in real time (No Repaint). I created this indicator based on my own research and testing (i.e. it is not just a a Pinescript adaptation of some other indicator available online).
The Problem with Similar Indicators Which Are Currently Available On TradingView:
Inaccurate placement of swing/pivot/SR points (making your screen cluttered with meaningless levels).
Repainting (meaning the historical values change as new data becomes available; this is misleading and not very useful when trading in real time).
Have a long delay before confirming/plotting the new pivot points (20/20 hindsight...).
Require you to specify a lookback period and simply looks for the highest or lowest value over that time frame (which isn't very useful since it disregards all of the swings in between).
Do not show all of the historical swing levels, only the most recent ones.
My Solution:
Accurately places swing/pivot/SR points on local highs and lows once a short term trend is over (allowing you to easily identify reversal points).
Does not repaint (the historic values shown are exactly what would have been seen upon the close of the given candles in live trading; this means you can use this indicator for live trading).
Has minimal lag. New swing lows/highs are typically identified by this indicator on the candle which immediately following the swing point (this allows for better entries/exits rather than waiting for the price to run too far in the wrong direction before confirmation).
No lookback period required. The indicator will automatically identify new swings regardless how long the run lasts.
Allows you to adjust for more/less sensitivity.
P.S.: Future developments will be using these levels to create an automatic plot of fibonacci retracement levels.
SWING TRADER V4 swing trading script (on test)
Long = buy signal
Short = sell signal
simple buy/sell script confirmed on bar close
Use ema's for the stoploss once price goes above or below these ema's
alerts available

Full Range Trading Study with Alerts and DCA
Introduction
This is the study version of my range trading strategy. It is designed to be a “drop in” replacement for its twin strategy. I have replicated the analysis logic and entry and exit procedures to produce a nearly identical result set to the strategy. Other than the properties tab, the inputs dialog is exactly the same. Backtest the strategy to determine the best inputs to trade. Then apply the same inputs to this study to forward test. Alerts are available for trade entry, take profit close and stop-loss exit. Please see the strategy version for a complete description of the trading behavior of this script.
In brief, this script is intended to benefit from a range bound market. The trading behavior is to buy on weakness and sell on strength. As such trade orders are placed in a counter direction to price pressure. What you will see on the chart is a short position on peaks and a long position on valleys. This is accomplished by calculating pivot points from the price stream. Rising pivots are shorts and falling pivots are longs. I refer to pivots as a vertex in the inputs dialog box. The cone based measurement adds a peak, sides and a base to the calculation elements. This allows the inputs to focus on adjusting the location of trades and not just trend lines. The pivot points can be plotted on the backtest. You can use the vertex input values to move the pivots where you want trades to be. This script can be traded in four different modes: Long, Short, BiDir, and Ping Pong. When trading in “Ping Pong” mode long and short positions are intermingled continuously as long as there exists a detectable vertex. I also have a trend following version of this script for those not interested in trading the range.
This script employs a DCA feature which enables users to experiment with loss recovery techniques in the backtest. Here in the study the summary report displays the “Debt Sequence” number which can be used to manually increase the order size on subsequent trades at the broker. The script keeps track of debt incurred from losing trades. When the debt is recovered the “Debt Sequence” resets to zero so orders can return to the base size. Be sure to set the limiter to prevent your account from depleting capital during runaway markets.
Consecutive loss limit can be set to report a breach of the threshold value. Every stop hit beyond this limit will be reported on a version 4 label above the bar where the stop is hit. Use the consecutive loss limit to manually halt live trading on the broker side.
Design
This script uses twelve indicators on a single time frame and is approximately 1800 lines of Pine 4 code. The original trading algorithms are a port from a much larger program on another trading platform. I’ve converted some of the statistical functions to use standard indicators available on TradingView. The setups make heavy use of the Hull Moving Average in conjunction with EMAs that form the Bill Williams Alligator as described in his book “New Trading Dimensions” Chapter 3. Lag between the Hull and the EMAs form the basis of the entry and exit points. The vertices are calculated using one of five featured indicators: Volume, Histogram, Fractal, Candle and Macro. The backtest is used to determine the best fit for your desired trading instrument. The incorporation of five distinct pivot point calculations broadens the scope of the markets where this tool can be beneficial.
Example configurations for various instruments along with a detailed PDF user manual is available.
Indicator Repainting
Please see the strategy script for a more detailed description of the repaint problem. The goal of my repaint prevention in the study script is simply to ensure that my signal trading bias remains consistent between the strategy, study and broker. This script employs the following conventions in effort to avoid indicator repainting:
1. This script uses only 1 time frame. The chart interval.
2. Every entry and exit condition is evaluated on closed bars only.
3. Entry and exit plots are not triggered off trend line crossovers.
4. No security functions are called to avoid a look-ahead possibility.
5. Every contributing factor specified in the TradingView wiki regarding this issue has been addressed. Except the use of the exponential moving average which is essential to my strategy.
6. I’ve run a 10 minute chart live for a week and compared it to the same chart periodically reloaded. The two charts were highly correlated with no instances of completely opposite real-time signals
This script does indeed bring up the TradingView warning dialog. The only reason for this is due to “peculiarities of the algorithm” regarding the EMA as stated in the wiki article.
The Bottom Line. Does this script repaint. Yes, it will repaint about as much as every other trading platform which combines backtest data with real time prices in a live trading scenario.
Usage
Please be aware that the purpose of the study script is to perform forward testing of the configuration established in the backtest process. Therefore, the usage here in the study begins with the backtest configuration parameters. The following steps provide instructions to get this study script connected to the TradingView alert notification system. For a detailed description of how to create a range trading system using this script please see the strategy version.
Step 1. Create a chart with the trading instrument and interval used in the backtest.
Step 2. Find this script in the “Invite Only” section of the Indicators Dialog and apply it to the current chart.
Step 3. Copy the values from the backtest input dialog to the study.
Step 4. Open the TradingView Alert window.
Step 5. In the “Condition” drop down field find and select the name of the script.
Step 6. A new drop down field will appear with the alerts available in the script. This script exposes the following six signals:
Long Entry Signal
Long Profit Signal
Long Stop-loss Signal
Short Entry Signal
Short Profit Signal
Short Stop-loss Signal
Select the signal for which you want notification.
Step 7. In the “Options” field select the frequency of the alert. Typically, "Once Per Bar" or "Once Per Bar Close" will be sufficient.
Step 8. Set the expiration date and time.
Step 9. Select the action of the alert. Currently TradingView offers six different actions:
Notify on App
Show Popup
Send Email
Webhook URL
Play Sound
Send Email to SMS
Step 10. Create a message to to transmitted with the alert. The script provides a default message which can be overridden with any custom description. The price, time and other reserved chart elements can be included in the message
Step 11. Click the “Create” button to generate this single alert.
Step 12. Repeat steps 1 through 11 for every signal you wish to receive.
This script is open for beta testing. After successful beta test it will become a commercial application available by subscription only. I’ve invested quite a lot of time and effort into making this the best possible signal generator for all of the instruments I intend to trade. I certainly welcome any suggestions for improvements. Thank you all in advance.

Full Range Trading Strategy with DCA - Crypto, Forex, Stocks
Introduction
This is a Pine 4 range trading strategy. It has a twin study with several alerts. The design intent is to produce a commercial grade signal generator that can be adapted to any symbol and interval. Ideally, the script is reliable enough to be the basis of an automated trading system web-hooked to a server with API access to crypto, forex and stock brokerages. The strategy can be run in three different modes: long, short and bidirectional.
As a range trading strategy, the behavior of the script is to buy on weakness and sell on strength. As such trade orders are placed in a counter direction to price pressure. What you will see on the chart is a short position on peaks and a long position on valleys. Just to be clear, the range as well as trends are merely illusions as the chart only receives prices. However, this script attempts to calculate pivot points from the price stream. Rising pivots are shorts and falling pivots are longs. I refer to pivots as a vertex in this script which adds structural components to the chart formation. When trading in “Ping Pong” mode long and short positions are intermingled continuously as long as there exists a detectable vertex. Unfortunately, this can work against your backtest profitability on long duration trends where prices continue in a single direction without pullback. I have designed various features in the script to compensate for this event. A well configured script should perform in a range bound market and minimize losses in a trend. I also have a trend following version of this script for those not interested in trading the range. Please be aware these are two types of traders. You should know who you are.
This script employs a DCA feature which enables users to experiment with loss recovery techniques. This is an advanced feature which can increase the order size on new trades in response to stopped out or winning streak trades. The script keeps track of debt incurred from losing trades. When the debt is recovered the order size returns to the base amount specified in the TV properties tab. The inputs for this feature include a limiter to prevent your account from depleting capital during runaway markets. This implementation of DCA does not use pyramid levels. Only the order size on subsequent new trades are affected. Pyramids on the other hand increase the size of open positions. If you are interested in seeing pyramids in action please see the trend version of this script which features both DCA and pyramids. While DCA is a popular feature in crypto trading, it can make you a “bag” holder if your not careful. In other markets, especially margin trading, you’ll need a well funded account and much trading experience to manage this feature safely.
Consecutive loss limit can be set to report a breach of the threshold value. Every stop hit beyond this limit will be reported on a version 4 label above the bar where the stop is hit. Use the location of the labels along with the summary report tally to improve the adaptability of system. Don’t simply fit the chart. A good trading system should adapt to ever changing market conditions. On the study version the consecutive loss limit can be used to halt live trading on the broker side (managed manually).
Design
This script uses twelve indicators on a single time frame. The original trading algorithms are a port from a much larger program on another trading platform. I’ve converted some of the statistical functions to use standard indicators available on TradingView. The setups make heavy use of the Hull Moving Average in conjunction with EMAs that form the Bill Williams Alligator as described in his book “New Trading Dimensions” Chapter 3. Lag between the Hull and the EMAs form the basis of the entry and exit points. The vertices are calculated using one of five featured indicators. Each indicator is actually a composite of calculations which produce a distinct mean. This mathematical distinction enables the script to be useful on various instruments which belong to entirely different markets. In other words, at least one of these indicators should be able generate pivots on an arbitrarily selected instrument. Try each one to find the best fit.
The entire script is around 1800 lines of Pine code which is the maximum incidental size given the TradingView limits: local scopes, run-time duration and compile time. I’ve been working on this script for nearly two years and have tested it on various instruments stocks, forex and crypto. It performs well on higher liquidity markets that have at least a year of historical data. Although the script can be implemented on any interval, it has been optimized for small time frames down to 5 minutes. The 10 minute BTC/USD produces around 500 trades in 2 ½ months. The 1 hour BTC/USD produces around 1300 trades in 1 ½ years. Originally, this script contained both range trading and trend following logic but had to be broken into separate scripts due to the aforementioned limitations.
Inputs to the script use cone centric measurements in effort to avoid exposing adjustments to the various internal indicators. The goal was to keep the inputs relevant to the actual trade entry and exit locations as opposed to a series of MA input values and the like. As a result the strategy exposes over 50 inputs grouped into long or short sections. Inputs are available for the usual minimum profit and stop-loss as well as safeguards, trade frequency, DCA, modes, presets, reports and lots of calibrations. The inputs are numerous, I’m aware. Unfortunately, at this time, TradingView does not offer any other method to get data in the script. The usual initialization files such as cnf, cfg, ini, json and xml files are currently unsupported.
Example configurations for various instruments along with a detailed PDF user manual is available.
Indicator Repainting And Anomalies
Indicator repainting is an industry wide problem which mainly occurs when you mix backtest data with real-time data. It doesn't matter which platform you use some form of this condition will manifest itself on your chart over time. The critical aspect being whether live trades on your broker’s account continue to match your TradingView study.
Tackling this repainting issue has been a major project goal of this script. Based on my experience with Pine, most of the problems stem from TradingView’s implementation of multiple interval access. Whereas most platform provide a separate bar series for each interval requested, the Pine language interleaves higher time frames with the primary chart interval. The problem is exacerbated by allowing a look-ahead parameter to the Security function. The goal of my repaint prevention is simply to ensure that my signal trading bias remains consistent between the strategy, study and broker. That being said this is what I’ve done address this issue in this script:
1. This script uses only 1 time frame. The chart interval.
2. Every entry and exit condition is evaluated on closed bars only.
3. No security functions are called to avoid a look-ahead possibility.
4. Every contributing factor specified in the TradingView wiki regarding this issue has been addressed.
5. I’ve run a 10 minute chart live for a week and compared it to the same chart periodically reloaded. The two charts were highly correlated with no instances of completely opposite real-time signals.
The study does indeed bring up the TV warning dialog. The only reason for this is because the script uses an EMA indicator which according to TradingView is due to “peculiarities of the algorithm”.
One issue that comes up when comparing the strategy with the study is that the strategy trades show on the chart one bar later than the study. This problem is due to the fact that “strategy.entry()” and “strategy_exit()” do not execute on the same bar called. The study, on the other hand, has no such limitation since there are no position routines.
Please be aware that the data source matters. Cryptocurrency has no central tick repository so each exchange supplies TradingView its feed. Even though it is the same symbol the quality of the data and subsequently the bars that are supplied to the chart varies with the exchange. This script will absolutely produce different results on different data feeds of the same symbol. Be sure to backtest this script on the same data you intend to receive alerts for. Any example settings I share with you will always have the exchange name used to generate the test results.
Usage
The following steps provide a very brief set of instructions that will get you started but will most certainly not produce the best backtest. A trading system that you are willing to risk your hard earned capital will require a well crafted configuration that involves time, expertise and clearly defined goals. As previously mentioned, I have several example configs that I use for my own trading that I can share with you along with a PDF which describes each input in detail. To get hands on experience in setting up your own symbol from scratch please follow the steps below.
The input dialog box contains over 50 inputs separated into five sections. Each section is identified as such with a makeshift separator input. There are three main areas that must to be configured: long side, short side and settings that apply to both. The rest of the inputs apply to DCA, reporting and calibrations. The following steps address these three main areas only. You will need to get your backtest in the black before moving on to the more advanced features.
Step 1. Setup the Base currency and order size in the properties tab.
Step 2. Select the calculation presets in the Instrument Type field.
Step 3. Select “No Trade” in the Trading Mode field.
Step 4. Select the Histogram indicator from Section 2. You will be experimenting with different ones so it doesn’t matter which one you try first.
Step 5. Turn on Show Markers in Section 2.
Step 6. Go to the chart and checkout where the markers show up. Blue is up and red is down. Long trades show up along the red markers and short trades on the blue.
Step 7. Make adjustments to “Base To Vertex” and “Vertex To Base” net change and roc in Section 3. Use these fields to move the markers to where you want trades to be.
Step 8. Try a different indicator from Section 2 and repeat Step 7 until you find the best match for this instrument on this interval. This step is complete when the Vertex settings and indicator combination produce the most favorable results.
Step 9. Go to Section 3 and enable “Apply Red Base To Base Margin”.
Step 10. Go to Section 4 and enable “Apply Blue Base To Base Margin”.
Step 11. Go to Section 2 and adjust “Minimum Base To Base Blue” and “Minimum Base To Base Red”. Observe the chart and note where the markers move relative to each other. Markers further apart will produce less trades but will reduce cutoffs in “Ping Pong” mode.
Step 12. Return to Section 3 and 4 and turn off “Base To Base Margin” which was enabled in steps 9 and 10.
Step 13. Turn off Show Markers in Section 2.
Step 14. Put in your Minimum Profit and Stop Loss in the first section. This is in pips or currency basis points (chart right side scale). Percentage is not currently supported. This is a fixed value minimum profit and stop loss. Also note that the profit is taken as a conditional exit on a market order not a fixed limit. The actual profit taken will almost always be greater than the amount specified. The stop loss, on the other hand, is indeed a hard number which is executed by the TradingView broker simulator when the threshold is breached. On the study version, the stop is executed at the close of the bar.
Step 15. Return to step 3 and select a Trading Mode (Long, Short, BiDir, Ping Pong). If you are planning to trade bidirectionally its best to configure long first then short. Combine them with “BiDir” or “Ping Pong” after setting up both sides of the trade individually. The difference between “BiDir” and “Ping Pong” is that “Ping Pong” uses position reversal and can cut off opposing trades less than the specified minimum profit. As a result “Ping Pong” mode produces the greatest number of trades.
Step 16. Take a look at the chart. Trades should be showing along the markers plotted earlier.
Step 17. Make adjustments to the Vertex fields in Section 2 until the TradingView performance report is showing a profit. This includes the “Minimum Base To Base” fields. If a profit cannot be achieved move on to Step 18.
Step 18. Improve the backtest profitability by adjusting the “Long Entry Net Change” and “Long Entry ROC” in Section 3.
Step 19. Improve the backtest profitability by adjusting the “Short Entry Net Change” and “Short Entry ROC” in Section 4.
Step 20. Improve the backtest profitability by adjusting the “Sparse Long Delta” in Section 3.
Step 21. Improve the backtest profitability by adjusting the “Chase Long Delta” in Section 3.
Step 22. Improve the backtest profitability by adjusting the “Long Adherence Delta” in Section 3. This field requires the “Adhere to Rising Trend” checkbox to be enabled.
Step 23. Try each checkbox in Section 3 and see if it improves the backtest profitability. The “Caution Lackluster Longs” checkbox only works when “Long Caution Mode” is enabled.
Step 24. Improve the backtest profitability by adjusting the “Sparse Short Delta” in Section 4.
Step 25. Improve the backtest profitability by adjusting the “Chase Short Delta” in Section 4.
Step 26. Improve the backtest profitability by adjusting the “Short Adherence Delta” in Section 4. This field requires the “Adhere to Falling Trend” checkbox to be enabled.
Step 27. Try each checkbox in Section 4 and see if it improves the backtest profitability. The “Caution Lackluster Shorts” checkbox only works when “Short Caution Mode” is enabled.
Step 28. Enable the reporting conditions in Section 5. Look for long runs of consecutive losses or high debt sequences. These are indications that your trading system cannot withstand sudden changes in market sentiment.
Step 29. Examine the chart and see that trades are being placed in accordance with your desired trading goals. This is an important step. If your desired model requires multiple trades per day then you should be seeing hundreds of trades on the chart. Alternatively, you may be looking to trade fewer steep peaks and deep valleys in which case you should see trades at major turning points. Don’t simply settle for what the backtest serves you. Work your configuration until the system aligns with your desired model. Try changing indicators and even intervals if you cannot reach your simulation goals. Generally speaking, the histogram and Candle indicators produce the most trades. The Macro indicator captures the tallest peaks and valleys.
Step 30. Apply the backtest settings to the study version and perform forward testing.
This script is open for beta testing. After successful beta test it will become a commercial application available by subscription only. I’ve invested quite a lot of time and effort into making this the best possible signal generator for all of the instruments I intend to trade. I certainly welcome any suggestions for improvements. Thank you all in advance.

6Hours swingalgo by BiO-618Hey, I want to share you this algo I remade for a bullish market.
*It uses about 11 indicators, 3 of them made by me to avoid BUYs on the start of a big dump.
*It was added ghost pivots for weekly and monthly values, really useful!
Let me know any suggestion, I will keep working to improve it
FiboStaircase by Solah AzmanThe band represents the range between local highest and local lowest and the layers are proportional to Fibonacci ratio. Suitable for 5 minutes charts.

CFT Auto Pivot Trend LinesThis script draws real time trend lines from swing highs and lows which will automatically draw your trend lines for you.
Extremely useful for catching a trend confirmation and triangle break outs.
This is best used with the CFT Auto Support & Resistance Indicator and CFT Buy Sell Signals for additional confirmations.
If you need any help just message me.
