Futures SignalThis is a Futures Signal Indictor works using support & resistance and market trend, it is designed for all type of markets (crypto, forex, stock etc.) and works on all commonly used timeframes (preferably on 5 Min, 15 Min Candles).
How it works Futures Signal Indictor :
Core logic behind this indicator is to finding the Support and Resistance , we find the Lower High (LH) and Higher Low (HL) to find the from where the price reversed (bounced back) and also we use a custom logic for figuring out the peak price in the last few candles. Based on the multiple previous Support and Resistance (HH, HL, LL LH) we calculate a price level, this price level is used a major a factor for entering the trade. Once we have the price level we check if the current price crosses that price level, if it crossed then we consider that as a long/short entry (based on whether it crosses resistance or support line that we calculated). Once we have pre long/short signals we further filter it based on the market trend to prevent too early/late signals. Along with this if we don't see a clear trend we do the filtering by checking how many support or resistance level the price has bounced off.
Stop Loss and Take Profit: We have also added printing SL and TP levels on the chart to make the it easier for everyone to find the SL/TP values. Script calculates the SL value by checking the previous support level for LONG trade and previous resistance level for SHORT trades. Take profit are calculated in 0.5 ratio as of now.
Swingtrading

EMA Dashboard ChartStoryEMA Dashboard indicator is used for finding corrective during real time as well as where is taking support. It shows multiple timeframe along with multiple ema. From 5 mints charts to monthly chart and from 20 sma to 200 ema . So one can easily capture the price on different timeframe at single dashboard.

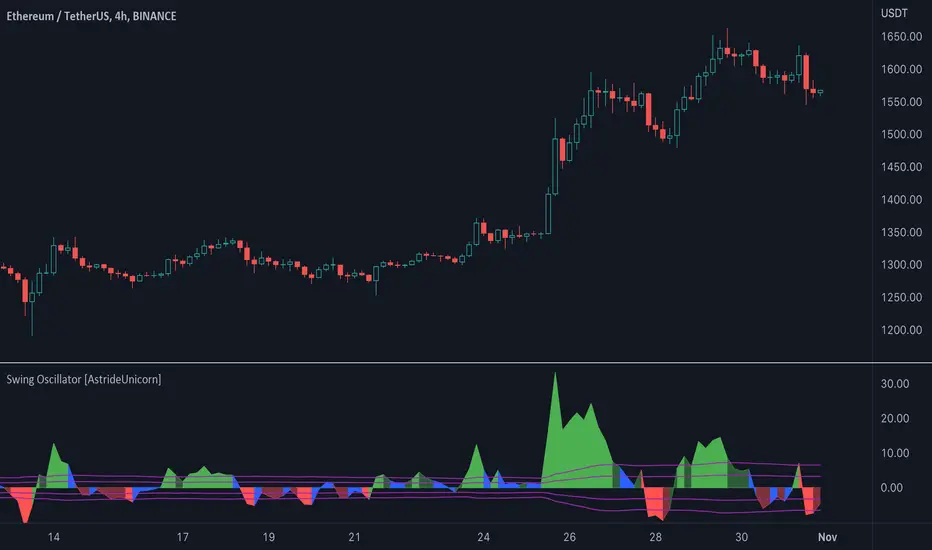
Swing Oscillator [AstrideUnicorn]The Swing Oscillator is an indicator that can help you catch small price movements, called swings. Swings are minor trends that occur when price moves between the highs and lows of a trend or range. Because of the short-term nature of swings, a new movement should be identified as soon as possible.
The indicator is based on our original formula, which averages the length of candlestick bodies and compares the result to several thresholds. This allows the algorithm to determine the direction and strength of the price movement.
HOW TO USE
When the indicator is above the zero level and colored green, it means that the price is in an upward swing. When the indicator is below the zero level and colored red, the price is in a downward swing. When the indicator is blue, the price swing is slowing down or the market is moving sideways. The amplitude of the oscillator shows the price volatility.
Mastering Market Structure"Market structure first, always" - Mr. Anderson aka TrueCrypto28 right before he went on to master Kung-Fu
Understanding and identifying market structure is essential for successful and consistent profitability. No system is perfect, but trading in the direction of the prevailing market structure can reduce the likelihood of being caught severely offsides and can yield trades with tighter invalidations and greater risk-to-reward potential.
This script will automatically identify and plot the following:
Market Structure
Pivot highs and lows using the lookback left and right lengths are analyzed to identify major swing highs and lows to identify the current trading range.
Bullish structure is characterized by a series of higher highs and higher lows.
Bearish Structure is characterized by lower highs and lower lows.
Structure breaks when a bar closes outside the current trading range. Major swing highs and lows will update following these breaks to continue following the current price action
Current market structure bias, bullish or bearish, can be displayed in a table in the location of your choosing.
Structure is fractal, so seeing low time frame structure shift against the high time frame structure can identify the beginning of a pullback. When it realigns with the high timeframe structure, it can identify the beginning of the high time frame trend continuation. You can choose to analyze structure on any timeframe with this script and even add multiple copies of it to your chart each analyzing different a timeframes to easily find high quality trade opportunities.
Fibonacci Levels of the current trading range
These are included to help identify areas of interest for trade execution and profit levels.
We want to buy at a discount and sell at a premium. The "Wholesale Zone" can be considered below the 50% retracement level in bullish structure, or above it in a bearish structure.
When in a bullish structure, "discount" buy opportunities can be found below the 50% retracement level with the expectation of trend continuation.
In a bearish structure, more ideal "premium' sell opportunities can be found above the 50% retracement with the expectation of trend continuation.
Optimal trade entry (OTE) zone, between the 61.8% and 78.6% retracement can offer a great risk-to-reward ratio for execution of a new position in trending environments.
When trading sideways in a range, opening new buy positions near the bottom of the range or new sell positions from the top of the range are preferred. Midrange 50% level commonly sees some reaction and can be used as a primary target with further targets either being the opposite end of the range or lower support levels (see order block section).
Order Blocks
New Bullish and bearish order blocks are created and plotted with every respective market structure break. They identify the price level from which the most recent leg of price action that yielded the structure break began.
In strong trending environments, these levels should continue to support or resist price. They are great areas to look to enter new positions.
Order blocks can also be used as targets for your trades to avoid giving back unrealized profits as price tends to react off of these levels.
To keep your chart clean and the order blocks relevant, an order block will be automatically deleted if price trades through and closes beyond it. Otherwise, printed order blocks will remain on your chart until either it's origin bar is out of TradingView's maximum bar history allowance or their maximum box count allowance.
Pairing these with fibonacci levels, retracements into order blocks that are in the Wholesale Zone or even the OTE zone offer higher probability trades with more favorable risk-to-reward potential.
Swing Failure
Swing failure patterns (SFPs) arise when a candle takes out a swing high or low, but fails to close beyond it.
Again, pairing these with other features of this script like range boundaries, wholesale zones, OTE zones, and order blocks can help traders identify the best times to actually execute their trade as SFPs are commonly seen at points of inflection in price action.
Moving Averages
Up to 4 moving averages from the current time frame are available. MA type and lengths can be adjusted to your preference.
Up to 4 MTF MAs. By Default this is an EMA 200 as it is commonly used for trend identification and support/resistance.
These are included for confluence of trend direction and strength.
They can also act as dynamic support and resistance and so can be useful for trade execution if price bounces or rejects off of them or targets as price may do so when it reaches them.
Additionally, alerts have been coded for the following scenarios:
MS Break alerts will trigger on bar close when a break in market structure has been confirmed.
SFP alerts will trigger on bar close when the swing failure pattern has been confirmed.
Entering OB alerts will trigger as soon as price touches the closest order block.
Entering Wholesale Zone alerts will trigger as soon as price cross the 50% retracement level. This can be used as an early alert to identify assets that have undergone a significant pullback before potential continuation in the direction of the main trend.
Entering OTE Zone alerts will trigger as soon as price crosses into the Optimal Trade Entry zone between the 61.8% and 78.6% retracement.
This script is unique in the way that it tracks market structure, automatically updates as price action continues to develop, presents high quality areas of interest, and SFPs for trend reversal and continuation. Traders will no longer need to constantly monitor their charts or exhaustively update their alerts to find good trade opportunities. This script takes care of all of it automatically. Collectively, all of the included features can be used to build a complete trading system.

[Sniper] SuperTrend + SSL Hybrid + QQE MODHi. I’m DuDu95.
**********************************************************************************
This is the script for the series called "Sniper".
*** What is "Sniper" Series? ***
"Sniper" series is the project that I’m going to start.
In "Sniper" Series, I’m going to "snipe and shoot" the youtuber’s strategy: to find out whether the youtuber’s video about strategy is "true or false".
Specifically, I’m going to do the things below.
1. Implement "Youtuber’s strategy" into pinescript code.
2. Then I will "backtest" and prove whether "the strategy really works" in the specific ticker (e.g. BTCUSDT) for the specific timeframe (e.g. 5m).
3. Based on the backtest result, I will rate and judge whether the youtube video is "true" or "false", and then rate the validity, reliability, robustness, of the strategy. (like a lie detector)
*** What is the purpose of this series? ***
1. To notify whether the strategy really works for the people who watched the youtube video.
2. To find and build my own scalping / day trading strategy that really works.
**********************************************************************************
*** Strategy Description ***
This strategy is from " QQE MOD + supertrend + ssl hybrid" by korean youtuber "코인투데이".
"코인투데이" claimed that this strategy will make you a lot of money in any crypto ticker in 15 minute timeframe.
### Entry Logic
1. Long Entry Logic
- Super Trend Short -> Long
- close > SSL Hybrid baseline upper k
- QQE MOD should be blue
2. Short Entry Logic
- Super Trend Long -> Short
- close < SSL Hybrid baseline lower k
- QQE MOD should be red
### Exit Logic
1. Long Exit Logic
- Super Trend Long -> Short
2. Short Entry Logic
- Super Trend Short -> Long
### StopLoss
1. Can Choose Stop Loss Type: Percent, ATR, Previous Low / High.
2. Can Chosse inputs of each Stop Loss Type.
### Take Profit
1. Can set Risk Reward Ratio for Take Profit.
- To simplify backtest, I erased all other options except RR Ratio.
- You can add Take Profit Logic by adding options in the code.
2. Can set Take Profit Quantity.
### Risk Manangement
1. Can choose whether to use Risk Manangement Logic.
- This controls the Quantity of the Entry.
- e.g. If you want to take 3% risk per trade and stop loss price is 6% below the long entry price,
then 50% of your equity will be used for trade.
2. Can choose How much risk you would take per trade.
### Plot
1. Added Labels to check the data of entry / exit positions.
2. Changed and Added color different from the original one. (green: #02732A, red: #D92332, yellow: #F2E313)
3. SuperTrend and SSL Hybrid Baseline is by default drawn on the chart.
4. If you check EMA filter, EMA would be drawn on the chart.
5. Should add QQE MOD indicator manually if you want to see QQE MOD.
**********************************************************************************
*** Rating: True or False?
### Rating:
→ 3.5 / 5 (0 = Trash, 1 = Bad, 2 = Not Good, 3 = Good, 4 = Great, 5 = Excellent)
### True or False?
→ True but not a 'perfect true'.
→ It did made a small profit on 15 minute timeframe. But it made a profit so it's true.
→ It worked well in longer timeframe. I think super trend works well so I will work on this further.
### Better Option?
→ Use this for Day trading or Swing Trading, not for Scalping. (Bigger Timeframe)
→ Although the result was not good at 15 minute timeframe, it was quite profitable in 1h, 2h, 4h, 8h, 1d timeframe.
→ Crypto like BTC, ETH was ok.
→ The result was better when I use EMA filter.
### Robust?
→ Yes. Although result was super bad in 5m timeframe, backtest result was "consistently" profitable on longer timeframe (when timeframe was bigger than 15m, it was profitable).
→ Also, MDD was good under risk management option on.
**********************************************************************************
*** Conclusion?
→ I recommend you not to use this on short timeframe as the youtuber first mentioned.
→ In my opinion, I can use on longer timeframe like 2h or bigger with EMA filter, stoploss and risk management.

EMA + Williams Fractal Pullback [Trading Nerd]EMA Pullback Strategy with Williams Fractal Indicator
Backtesting script that searches for trends (long and short) and a following pullback into the EMAs. It enters on the first Williams Fractal in the desired direction. I found the Strategy on YouTube as a "M1 Scalping Strategy for Bitcoin".
Including fees the strategy is not profitalbe in lower timeframes (at least if not optimized). But it seems to work on higher timeframes as a swing traiding strategy.
Strategy Conditions
Longs:
EMA 1 > EMA 2 and EMA 2 > EMA 3
Number of need to be above the EMA 1
Then a Pullback into the EMAs is required
Enter on the first bullish Williams Fractal
Signal is canceled if the price closes below the EMA 3
Shorts:
EMA 1 < EMA 2 and EMA 2 < EMA 3
Number of need to be below the EMA 1
Then a Pullback into the EMAs is required
Enter on the first bearish Williams Fractal
Singal is canceled if the price closes above the EMA 3
Take Profit
A Risk Reward Take Profit is possible. If you want to use only a trailing Stop Loss, you can set the Take Profit to 'None'
Stop Loss
The default Stop Loss is EMA. If the Pullback has not reached the EMA 2, the Stop Loss is set to the EMA 2. If the Pullback has reached the EMA 2, the Stop Loss is set to the EMA 3.
Other Stop Loss types are available: ATR, HH/LL
Trailing Stop Loss
Available trailing Stop Loss types: ATR, HH/LL. Best practice is to also set the Stop Loss type to the same value.
The Stop Loss is updated if the value from the latest closed candle is greater/less than the previous value for a long/short trade.
Additional
Time Filter: Only opens trade in the defined Session. Open trades are still being closed outside of the Session.
Start Date/End Date: Limits the backtest for the defined Date Range
Trading Days: Only open Trades on the checked Days
Risk % per Trade: If enabled the Strategy uses X% of the capital (defined in Settings -> Properties -> Initial Capital)
Use Compound Interest: If enabled Capital is recalculated for every trade (initial capital + net Profit)
IMPORTANT: For low Timeframes and Markets with tight SL (like Forex) it requires a lower Margin Percent than default. Go to Settings->Properties and lower the required Long/Short Margin. Otherwise Trades might not be considered because of too less capital/marign. Margins can e.g. set to: 2% (Forex), 10% (Stocks), 20% (Crypto).

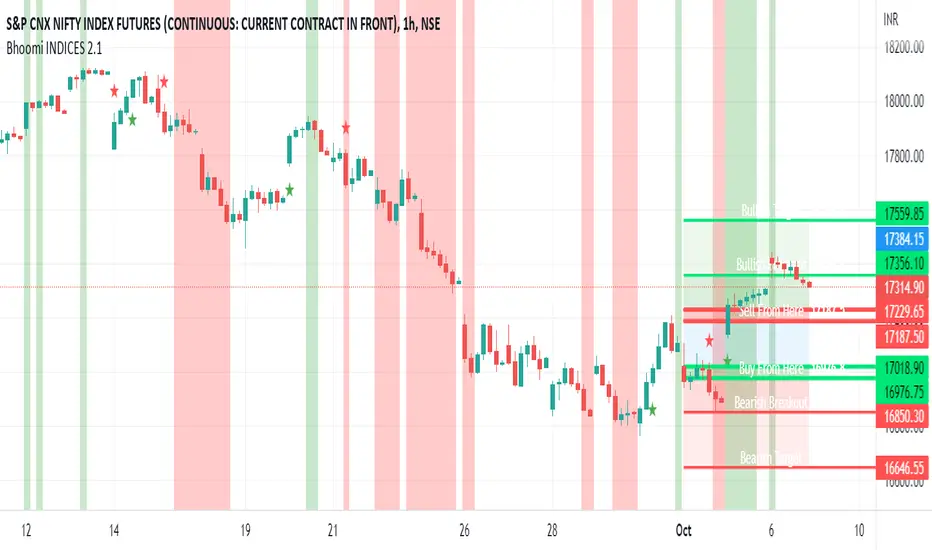
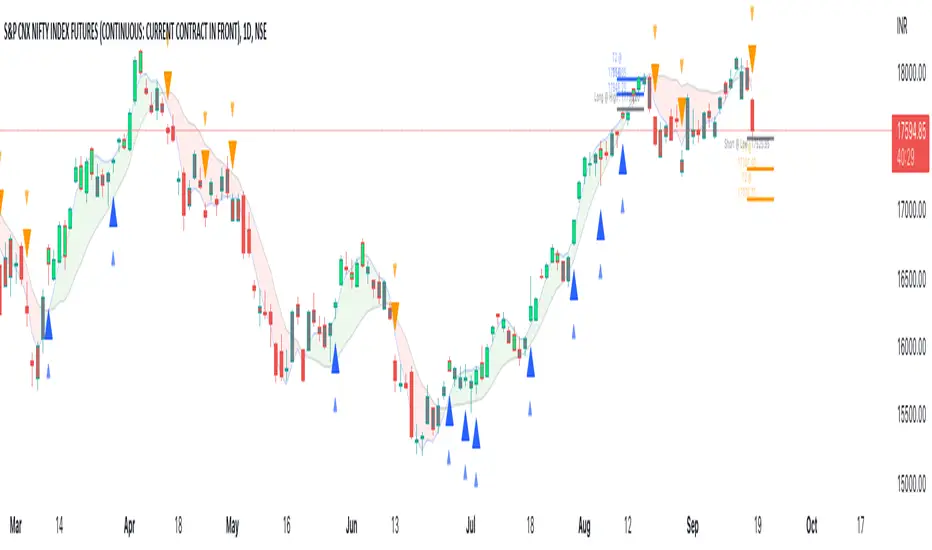
Bhoomi INDICES 2.1Bhoomi 2.0 is a Market Directional Indicator. It predicts the same by plotting respective zones and Labels.
To request access and to know more Information please contact us here.
Bhoomi 2.0 INDICES works on the Major World Indices as listed on tradingview. More to come in future, but please find the current list below. If you do not see the INDEX you trades, please comment below and we will add that for you.
"SPCFD:SPX"
"TVC:IXIC"
"DJCFD:DJI"
"TVC:NI225"
"CBOE:VIX"
"TSX:TSX"
"TVC:UKX"
"XETR:DAX"
"EURONEXT:PX1"
"EURONEXT:PX1GR"
"EURONEXT:PX1NR"
"TVC:FTMIB"
"TVC:NI225"
"TVC:KOSPI"
"TVC:SHCOMP "
"SZSE:399001"
"HSI:HSI"
"TVC:STI"
"ASX:XJO"
"NZX:NZ50G"
"TWSE:TAIEX"
"FTSEMYX:FBMKLCI"
"IDX:COMPOSITE"
"TVC:SX5E"
"BME:IBC"
"SIX:SMI"
"GPW:WIG20"
"EURONEXT:AEX"
"EURONEXT:BEL20"
"INDEX:BEL20"
"MOEX:IMOEX"
"OMXHEX:OMXH25"
"OMXICE:OMXI10"
"OMXSTO:OMXS30"
"OMXCOP:OMXC25"
"BELEX:BELEX15"
"OMXRSE:OMXRGI"
"OMXTSE:OMXTGI"
"OMXVSE:OMXVGI"
"BIST:XU100"
"TASE:TA35"
"TVC:SA40"
"NSE:NIFTY"
"BSE:SENSEX"
"DFM:DFMGI"
"TADAWUL:TASI"
"QSE:GNRI"
"BAHRAIN:BSEX"
"NSENG:NSE30"
"EGX:EGX30"
"BMFBOVESPA:IBOV"
"BMV:ME"
"BYMA:IMV"
"BVC:ICAP"
"BCS:SP_IPSA"
"BVL:SPBLPGPT"
"CURRENCYCOM:US500"
"CURRENCYCOM:US300"
"CURRENCYCOM:US100"
"CURRENCYCOM:US30"
"INDEX:DEU30"
"CBOE:VXD"
INDEX:DE40
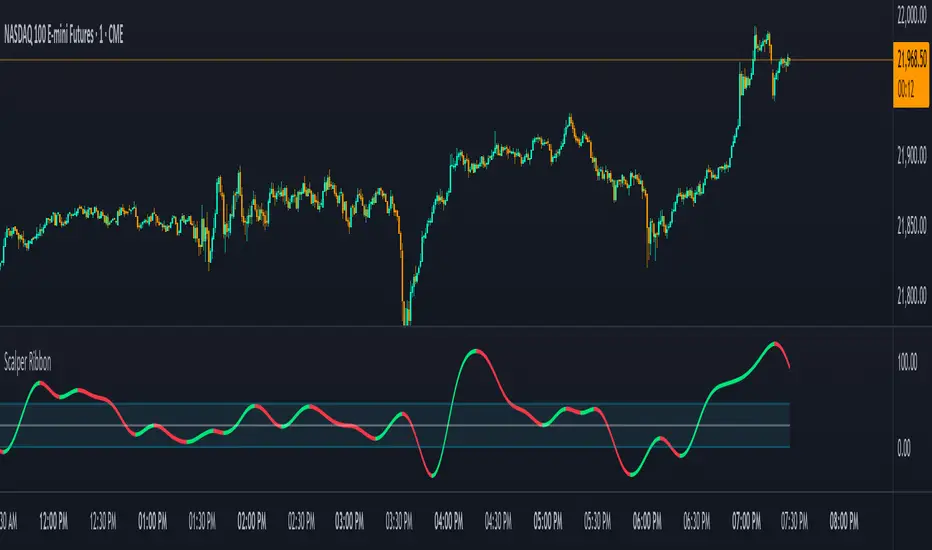
Scalper RibbonThis Scalper Ribbon is a combination of 6 different oscillators with a sprinkle of secret sauce . It’s smoothed out so it’s easy to read, but is quick enough to catch reversals early and helps you spot divergences. It will turn green or red according to the bullish or bearish nature of the ticker you are viewing without all of the noise that most oscillators give you.
It combines price action, momentum, rsi and a few other oscillators together to give an overall trend strength line that is smoothed out and coupled with a moving average to make it less noisy. Use it as an identifier of the underlying trend so you can make better decisions on scalp trades as well as swing trades on longer timeframes. Wait for the ribbon to break out/down from the middle blue range to avoid chop and get in when price is actually moving.
***HOW TO USE***
Find tops and bottoms of the market by looking for reversals in the ribbon when it is either very high or very low. The white line is the midline and the ribbon is overall bullish when above the midline and overall bearish when below the midline. There are also two blue lines just above and below the midline that is a buffer area I like to call the neutral range. When the ribbon is in the neutral range, expect indecision in the market and look for the ribbon to break out or down from that range for continuation of a trend. The farther away from the neutral range the ribbon is, the stronger the trend is. Take a look at how it performs across multiple timeframes and tickers and get a feel for it before using it in your strategy. It will help you spot reversals early and show you hidden divergences in price action before the reversals happen.
***CUSTOMIZATION***
You can adjust the length of the oscillators and the moving average ribbon to be faster or slower to suit your preferences. The lower the number used, the faster it will detect changes, but the more noise it will have. The higher the number used, the slower it will detect changes, but there will be less noise and easier to follow.
***MARKETS***
This indicator can be used as a signal on all markets, including stocks, crypto, futures and forex.
***TIMEFRAMES***
This Scalper Ribbon indicator can be used on all timeframes.
VWAP BANDS [qrsq]Description
This indicator is used to find support and resistance utilizing both buying and selling volume. It can be used on lower and higher time frames to understand where price is likely to reject or bounce.
How it works
Instead of calculating the VWAP using the total volume, this script estimates the buying/selling volume and respectively calculates their individual VWAP's. The standard deviations of these are then calculated to create the set of two bands. The top bands being the VWAP from buying volume and bottom bands are from selling volume, with the option to use a double band on either pair.
How to use it
I like to use the bands for LTF scalping as well as HTF swings, I also like to use it alongside my SMA VWAP BANDS.
For scalping:
I tend to use either the 5m or 15m TF
I then set the indicator's TF to 1m
I will take a scalp based on the bands confluence with other PA methods, if price is being either supported or rejected.
For swings:
I tend to use a variety of TFs, including: 30m, 1H, 4H, D
I then set the indicator's TF to "Chart"
I will take a swing based on the bands confluence with other PA methods, if price is being either supported or rejected.
I also tend to use them on perpetual contracts as the volume seems to be more consistent and hence results in more accurate support and resistance.

Optimal Confidence Scalper [OCS]Introduction
OCS : Optimal Confidence Scalpers, Utilise the computational approach towards finding confidence estimating in signal generating process, It helps u enter and exit the financial markets quickly, It buy and sell many times in a day with the objective of making consistent profits from incremental movements in the traded security's price. As we all know Lag is very undesirable because a trading system. Late trades can many times be worse than no trades at all, Main aim of the System is to find optimal Entry and Exit points for a successful trade
Mathematics behind the indicator
The indicator use two fundamentals pillars :
Estimation of a Confidence Interval
In frequentist statistics, a confidence interval (CI) is a range of estimates for an unknown parameter. A confidence interval is computed at a designated confidence level; the 95% confidence level is most common, but other levels, such as 90% or 99%, are sometimes used.
Desired properties are Validity, Optimality and Invariance
Polynomial Filters
The polynomial filters are based on the orthogonal polynomials of Legendre and Laguerre. Orthogonal polynomials are widely used in applied mathematics, physics and engineering, and the Legendre and Laguerre polynomials are only two of infinitely many sets, each of which has its own weight function.
They can be characterized in three equivalent ways:
1. They are the optimal lowpass filters that minimize the NRR, subject to additional constraints than the DC unity-gain condition
2. They are the optimal filters that minimize the NRR whose frequency response H(ω) satisfies certain flatness constraints at DC
3. They are the filters that optimally fit, in a least-squares sense, a set of data points to polynomials of different degrees.
The System uses Predictive Differentiation Filters, as subset to Polynomial Filters
Components of the System
Buy Signal and Sell Signals
=====================
=====================------ HOW TO USE IT
=====================
ENTRY and EXITS
Momentum Bands
Confidence Levels
Indicator Properties
Provision For Alerts
1. Buy Signal Alert
2. Sell Signal Alert
3. Exit Alert if in Buy Trade
4. Exit Alert if in Sell Trade
Some Examples
What TimeFrames To Use
U can use any Timeframe, The indicator is Adaptive in Nature,
I personally use timeframes such as : 1m, 5m 10m, 15m, ..... 1D, 1W
How to Access
U will need to privately message me.
use comment box for constructive comments
Thanks
RedK Chop & Breakout Scout (C&B_Scout)The RedK Chop & Breakout Scout (C&BS or just CBS) is a centered oscillator that helps traders identify when the price is in a chop zone, where it's recommended to avoid trading or exit existing trades - and helps identify (good & tradeable) price breakouts.
i receive many questions asking for simple ways to identify chops .. Here's one way we can do that.
(This is work in progress - i was exploring with the idea, and wasn't sure how interesting other may find it. )
Quick Intro:
==================
Quick techno piece: This concept is similar to a Stochastic Oscillator - with the main difference being that we're utilizing units of ATR (instead of a channel width) to calculate the main indicator line - which will then lead to a non-restricted oscillator (rather than a +/- 100%) - given that ATR changes with the underlying and the timeframe, among other variables.
to make this easy, and avoid a lot of technical speak in the next part, :) i created (on the top price panel) the same setup that the C&B Scout represents as a lower-panel indicator.
So as you read below, please look back and compare what C&BS is doing in its lower panel, with how the price is behaving on the price chart.
how this works
========================
- To identify chops and breakouts, we need to first agree on a definition that we will use for these terms.
- for the sake of this exercise, let's agree that the price is in a chop zone, as long as the price is moving within a certain distance from a "price baseline" of choice ( which we can adjust based on the underlying, the volatility, the timeframe, the trading style..etc)
- when the price moves out of that chop zone, we consider this a breakout
- Now not all breakouts are "good" = they need to at least happen in the direction of the longer term trend. In this case, we can apply a long Moving Average to act as a filter - and consider breakouts to be "good" if they are in the same direction as the filter line
- With the above background in mind, we establish a price baseline (as you see on the top panel, this is based on the midline of a Donchian Channel - but we can use other slow moving averages in future versions)
- we will decide how far above/below that baseline is considered to be "chop zone" - we do this in terms of units of Average True Range (ATR) - using ATR here is valuable for so many reasons, most of all, how it adjusts to timeframe and volatility of underlying.
- The C&B Scout line simply calculates how far the price is above/below the baseline in terms of "ATR units". and shows how that value compares to our own definition of a "chop zone"
- so as long as the price is within the chop zone, the CBS line will be inside the shaded area - and when the price "breaks out" of the chop zone, the CBS line will also breakout (or down) from the chop zone.
- C&B Scout will give a visual clue to help take trades in the direction of the prevailing trend - the chop zone is green when the price is in "long mode", as in, the price is above the filter line - and will be red when we are in "short mode" - so the price is below the filter line. in green mode, we should only consider breakouts to the upside, and ignore breakouts to the downside (or breakdowns) - in red mode, we should only consider breakouts to the downside., and ignore the ones to the upside.
- i added some examples of "key actions" on the chart to help explain the approach here further.
Usage & settings Notes:
========================
- even though for many traders this will be a basic concept/setup, i still highly suggest you spend time getting used to how it works/reacts and adjusting the settings to suit your own trading style, timeframe, tolerance, what you trade....etc
- for example, if i am a conservative trader, i may consider any price movement within 1 x ATR above and below the baseline to be in "chop" (ATR Channel width = 2 x ATR) - and i want to only take trades when the price moves outside of that range *and* in the direction of the prevailing trend
- An aggressive trader may use a smaller ATR-based value, say 0.5 x ATR above/below the baseline, as their chop zone.
- A swing trader may use a shorter filter line and focus on the CBS line crossing the 0 line.
- .... and so on.
- Also note that the "tradeable" signal is when the CBS line "exits" the chop zone (upward on green background, or downward on red background) - however, an aggressive trader may take the crossing of the CBS line with the 0 line as the signal to open a trade.
- As usual please do not use this indicator "in isolation" and ensure you have other confirming signals from your setups before trading.
conclusion
===========
As i mentioned, this is really a simple concept - and i'm a big fan of those :) -- and there's so much that could be done to expand around it (add more visuals/colors, add alerts, add options for ATR calculation, Filter line calculations, baseline..etc) - but with this v1.0, i wanted to share this initially and see how much interest and how valuable fellow traders find it, before playing any further with it. so please be generous with your comments.

SMA VWAP BANDS [qrsq]Description
This indicator is used to find support and resistance utilizing both SMA and VWAP. It can be used on lower and higher time frames to understand where price is likely to reject or bounce.
How it works
Rather than using the usual calculation for the VWAP, instead this script smooths the volume first with the SMA and then respectively calculates the smoothed multiplication of high, low and close price with the volume individually. These values are then divided by the smoothed volume to find individual VWAP's for each of the sources. The standard deviations of these are calculated, resulting in an upper, lower and middle band. It is essentially VWAP bands with some smoothed calculations in the middle.
How to use it
I like to use the bands for LTF scalping as well as HTF swings.
For scalping:
I tend to use either the 5m or 15m TF
I then set the indicator's TF to 1m
I will take a scalp based on the bands confluence with other PA methods, if price is being either supported or rejected.
For swings:
I tend to use a variety of TFs, including: 30m, 1H, 4H, D
I then set the indicator's TF to "Chart"
I will take a swing based on the bands confluence with other PA methods, if price is being either supported or rejected.
I also tend to use them on perpetual contracts as the volume seems to be more consistent and hence results in more accurate support and resistance.

Simple Swing with T3MAThis indicator is based on T3 Moving Average , which was first described in the January 1998 issue of the " Stocks & Commodities " journal in the article " Smoothing Techniques For More Accurate Signals " by Tim Tillson.
The T3 Moving Average was developed in the search for a “perfect” moving average, which would have 2 characterictics:
Smooth (not sensitive to random noise in the underlying price)
Would not lag behind the price
The smoothness of a filter could be improved by running it through itself multiple times, at the cost of increasing the phase lag. So, we choose a moving average with a very minimal lag (Generalized DEMA), & run it through itself multiple times to get a smoother version with with minimal lag (T3 MA). The problem with multiple runs though these filters increase their tendency to overshoot the data, giving an unusable result. To solve this problem, we need to simply turn down the volume by using a volume factor less than 1. Using a value for v less than 1, & running GDEMA (Generalized DEMA) through itself multiple times we get a new, smoother moving average (T3) that does not overshoot the data:
T3(n) = GDEMA(GDEMA (GDEMA(n)))
Traditionally, the entry is mainly done by crossovers between a fast and a slow moving average (MA). When the fast MA crosses up the slow MA, the trader takes it as a buy signal. Similarly, when the fast MA crosses down the slow MA, we get a sell signal. These traditional signals are lagging .
In the Simple Swing Strategy, we propose the Early Upswing (E0) & Early Downswing (Ex) terminologies. The Early Upswing starts when the T3 ribbon is red (i.e. Fast T3MA is lesser than slow T3MA), but the price has closed above the ribbon. This is the E0 candle. Similarly, the Early Downswing starts when the T3 ribbon is green (i.e. Fast T3MA is greater than slow T3MA), but the price has closed below the ribbon. This is the Ex candle.
The long entry (or the short exit) is taken once the price closes above the red ribbon.
The long exit (or the short entry) is taken once the price closes below the green ribbon.
Thereafter, the color of the ribbon confirms the swings. When we have the green ribbon, we are in a Confirmed upswing . When we have the red ribbon, we are in a Confirmed downswing .
p.s. It should be noted that the terms “swing” & “trend” are not interchangable. You can have an upswing in a downtrend, & a downswing in an uptrend. An upswing in an uptrend is the most reliable environment for long positions, & vice versa.
---------------------------------------------------------------
References:
- T3 Average by HPotter (2014)
- T3MA Ribbon by JustUncleL (2017)

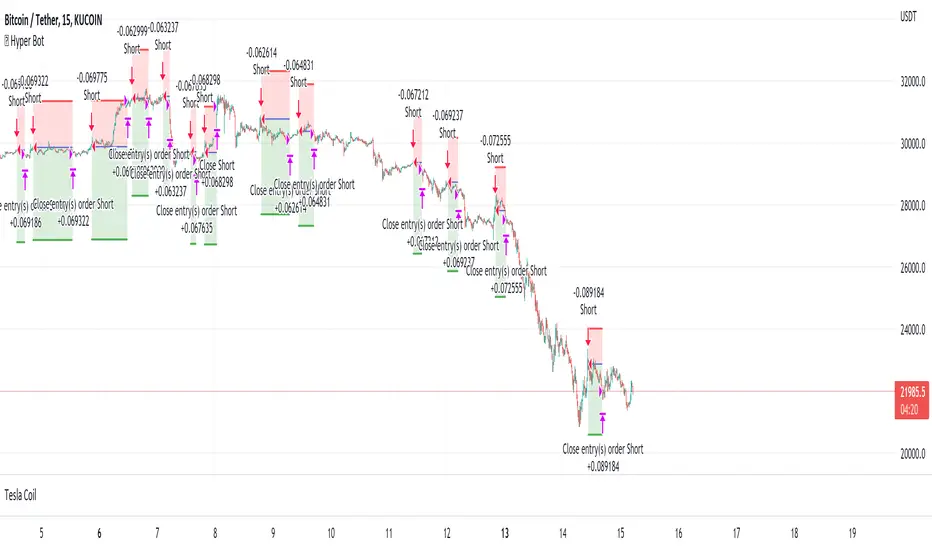
Scot Signal IndicatorThe Scot Signal Indicator is intended as a Scalping Resource. It was designed to work best on the ❗❗ 5 MINUTE CHART with Bitcoin ❗❗ / USD & USDT pairs.
🟡🔼🔽 Yellow Triangles : these are pre-signals. If the triangle is Pointing Down, then look for a possible Short to come, and vice-versa for Upward facing triangles will go Long.
* Be careful, this is a Canary in the Coal Mine, but not the full signal. Going purely on the triangle as a signal could lead to fake-outs more frequently.
🟩 🟥 Green & Red Boxes : these are "Long" & "Short" signals where the indicator feels the time is safe to enter a trade.
❗ EXITING THE TRADE ❗ : this is a scalping indicator, specifically meant for entering trades, NOT EXITING them. An ideal scalp is $100 - $200 Bitcoin move. Though, we run bots using this indicator, taking scalps as little
as $60, performing up to 8 trades a day.

LNL Pullback ArrowsBuying the dip has never been easier! LNL Pullback Arrows are here to pinpoint the best possible entries for the trend following setups. With the Pullback Arrows, trader can pick his own approach and risk level thanks to four different types of arrows. The goal of these arrows is to force the traders to scale in & out of trades which is in my opinion crucial when it comes to trend following strategies. These arrows were designed primarily for the daily & weekly time frame (swing trading).
Four Types of Pullback Arrows:
1. Aggro Arrows - Ideal for aggresive approach during parabolic trends. Sometimes trends are so strong that the price barely revisits the daily 8 EMA. This is where the aggro arrows can perfectly pinpoint the aggresive high risk entries. Ideal for halfsize or 1/4 size of the full position. Aiming for quick 1-2 day moves targeting the recent high/low. These arrows could be also named as scalping arrows for the swing traders. A quick In & Out.
2. HalfSize Arrows - Medium risk approach. First arrows to scale in. HalfSize arrows are the first sign that the pullback might be ending, yet there is still some space left for an even deeper pullback. That is the reason why they are called half-size. Ideally taken with half-sized position. When trading the HalfSize Arrows, It is better to have some "spare ammo in the gun" ready to use.
3. FullSize Arrows - Regular risk approach. These arrows represent a zone where the core of the posititon should be taken. The point of validity for the trend is not that far away, meaning the risk can be kept tight. Ideal for scailing the other halfs or quarters of the full position. Also great for more conservative traders or environments with higher volatility.
4. Rare Arrows - Offer the best risk to reward entries during the trend. Rare Arrows should be the "last kick" of the retracement, therefore stops can be positioned really tight. They either trigger the stop immidiately or they provide another juicy leg up or down in the direction of the trend. However, they really do appear rarely.
Simple EMA Cloud:
A simple cloud based on 21 and 55 exponential moving averages. This default length creates a pullback zone that is wide enough for the conservative traders but also give the opportunities to more aggresive traders. Alternatives such as 8 & 21, or 21 & 34 are forming the zone that is too aggresive and usually too thin. Of course, cloud can be fully adjusted or turned off completely. The only role of the cloud is to gauge the trend.
Tips & Tricks:
1.Importance of the Scailing
- As already stated, scailing is crucial to this since there is no way of knowing the exact level at which the price magically bounce every time. It is hard to tell where and which EMA will be respected. How can we know it will be 21 EMA every time? or 34 EMA or 10 EMA or 100 SMA or 50 DMA ... Single MA does not make a trend. This is the reason why scailing is so important. Scailing can make a difference.
2. Nothing is Perfect
- Same as any other study, nothing works 100% perfectly. Sometimes the setup will go right against you and sometimes the price will fade away sideways and breaks off the structure of the trend. This is not a magic certainty tool. This is just another probability tool.
3. Point of Validity & Other Studies
- Even though the pullback arrows can be a stand-alone strategy. It is important to use other indicators that visualize the actual trend. Whether its EMA Cloud or EMAs or DMI Bars or Keltner Channels, there should be something that validates the trend, something that tells the trend is over. (Pullback Arrows are not showing the actual stops!).
Hope it helps.

Booz StrategyBooz Backtesting : Booz Backtesting is a method for analyzing the performance of your current trading strategy . Booz Backtesting aims to help you generate results and evaluate risk and return without risking real capital.
The Booz Backtesting is the Booz Super Swing Indicator equivalent but gives you the ability to backtest data on different charts.
This is an Indicator created for the purpose of identifying trends in Multiple Markets, it is based on Moving Average Crossover and extra features.
Swing Trading: This function allows you to navigate the entire trend until it is not strong enough, so you can compare it with fixed parameters such as Take Profit and Stop Loss.
Take Profit and Stop Loss function: With this function you will be able to choose the most optimal parameters and see in real time the results in order to choose the best combination of parameters.
Leverage : We have this function for the futures markets where you can check which is the most appropriate leverage for your operation.
Trend Filter: allows you to take multiple entries in the same direction of the market.
If the market crosses below the 200 moving average, it will take only short entries.
If the market crosses above the 200 moving average, it will take only long entries.
Timeframes
Charting from 1 Hour, 4 Hour, Daily, Weekly, Weekly
Markets :Booz Backtesting can be tested in Cryptocurrency, Stocks and Futures markets.
Background Color : at a glance, you can see what cycle the market is in.
Green background : Shows that the market is in a bullish cycle.
Red background: Shows that the market is in a bearish cycle.

Infiten's Return Candle OscillatorInfiten's Return Candle Oscillator is an oscillator which shows the percentage return on the open, high, close and low over a customizable period in the form of candlesticks. It may be helpful for seeing volatility, swing trading, or mean reversion trading.
The RCO consists of two plotted elements :
RCO Candles (short length): candlesticks which are plotted with low = the product of the percentage changes in the low over a period, high = the product of the percentage changes in the high over a period, close = the product of the percent changes in close over a period, and open = the product of the percentage changes in return over a period. Similarly to with standard candlesticks, if the percentage change on the close is higher than the percentage change on the open, the candlestick is green, otherwise it is red.
Smoothed RCO Line (long length) : a moving average of the average of the low, close, open and high calculated for the RCO Candles. The line's transparency is determined by the percentage difference between the RCO and the highest or lowest RCO over the long length. A more transparent line means that the RCO is closer to the highest or lowest RCO, and may be indicative of a reversal, or weakening trend.

Hyper Bot | Self Optimizing Buy & SellThis strategy primarily uses Bollinger Bands with custom improvements and alterations in entry exit signals which i have learned over the past years.
How to use?
Visit strategy settings. You will see checkboxes before all options, meaning they can be turned ON and OFF.
For "Long SL %" to work, the "LONG" should be enabled aswell. If Long is not enabled, changing numbers in "Long SL%" won't make any difference.
Likewise if you want to test take profit, then either long or short or both should be enabled with "TP Long%" or "TP Short%"
This wide customization is being provided for you to be able to test all possible variations and choose whichever best is working for you. Play around with the numbers of SL% and TP% and find best ones that work for you in terms of drawdown, risk to profit etc.
Commission 0.1% by default is included, if however your commissions are lower, please change them to get better results.
This strategy is mainly optimized for Cryptocurrencies, however if you wish to use for indices and commodities please DM me, i will provide customization services.
Enjoy!
© Copyright 2022 "M Tahreem Alam"
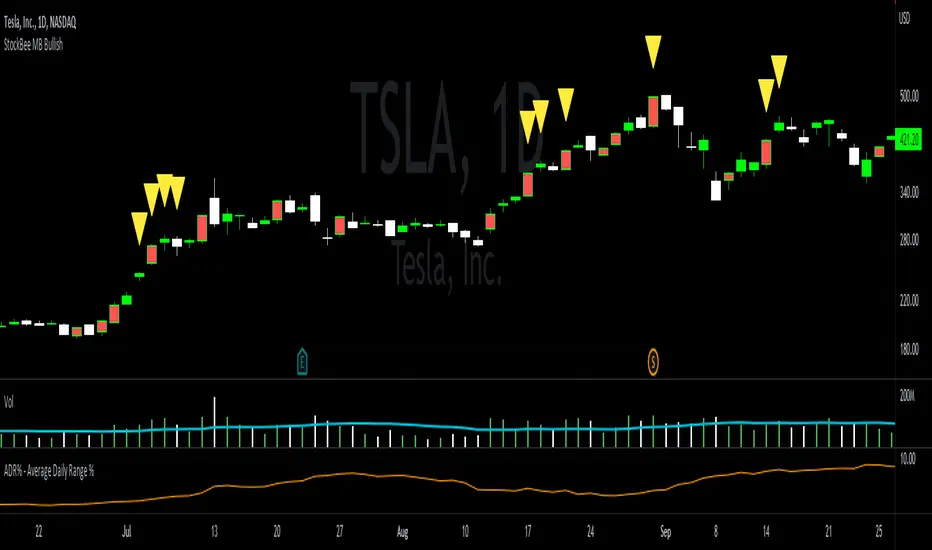
StockBee MB BullishStockBee Bullish Momentum Burst & 20% Plus Study Tool
The Stockbee bullish momentum burst study tool is helpful for practitioners of the momentum burst method who want to easily find historical momentum bursts and/or 20% plus gainers using Trading View. This script finds three specific breakouts that meet the below criteria:
4% Breakouts (Colors Candle Body)
1. Volume of the candle is greater than the previous candle volume.
2. The percent change of candle's price is greater than 4% from the previous candle close.
3. Current candle close is less than 30% from candle's high.
**Users can toggle 4% Breakouts on/off and also change candle body color in settings**
Dollar Breakouts (Colors Candle Body)
1. The change of candle's price is greater than $0.90 from the previous candle close.
2. Current candle close is less than 30% from candle's high.
** Dollar Breakout does not take volume into consideration **
**Users can toggle Dollar Breakouts on/off and also change candle body color in settings**
20% Plus Gainers (Displays Yellow Triangle Icon)
1. The change over five candles is greater than 20%.
**Users can toggle 20% plus label on/off, cannot change the label color**
This script also filters out any candle that gaps up and breaks down with a close above 4% the previous candle (Eliminates gap-ups that fade). This tool is meant to find and filter possible candidates. Not every marked candle is a great momentum burst trade. Users can look at 4% Breakouts, Dollar Breakouts, 20% Plus Gainers individually or any combination of the three.
This is helpful for Trading View users trading this specific setup.
StockBee 4% BreakoutThe Stockbee 4% Breakout script is a study tool for users who wants to do a deep dive on StockBee's 4% Breakout momentum burst method. This script will assist a specific group of traders who trade this method easily find historical momentum bursts. This script finds and colors red any candle body that meets the following criteria:
1. Volume of the candle is greater than the previous candle volume.
2. The percent change of candle's price is greater than 4% from the previous candle close.
3. Current candle close is less than 30% from candle's high.
This script also filters out any candle that gaps up and breaks down with a close above 4% the previous candle (Eliminates gap-ups that fade). This tool is meant to find and filter possible candidates. Not every marked candle is a great momentum burst trade.
This is very helpful for Trading View users trading this specific setup.

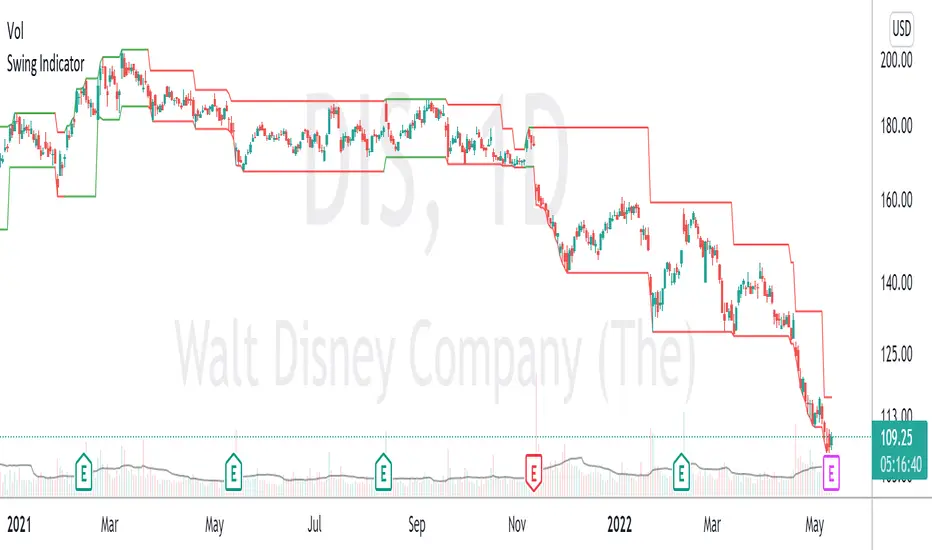
Swing High Swing Low This tool is the swing high swing low indicator. A swing high/low is a technical pattern that describes a local peak or trough on a chart. By connecting these peaks and troughs, we can determine the general direction the asset is trading. This indicator can be used on all time frames and in any market.
To use it, declare how many candles are needed to determine a swing level. By default, the indicator is set to two candles. This means that a candle must have two candles to the right AND left (totaling 5 consecutive candles) to be considered a swing level. If the middle candle has the highest high of the 5 consecutive candles, it will be classified as a Swing High. If the middle candle has the lowest low, it will be a Swing Low. Otherwise, it will be ignored.
Once a swing number is declared, the indicator will look for a starting swing high and swing low. The asset will trade inside the range established by the swing high/low lines. When the lines are parallel, it is considered a form of consolidation. You will likely see a lot of whipsaw action or chart patterns like bullflags or head-shoulders. Wait patiently for a break of this consolidation. The indicator will identify the new swing levels when the asset breaks out of this range.
Depending on the direction of the break, it will turn green for an uptrend or red for a downtrend. You should look to take long positions when the lines are green and short when the lines are red. You can use old swing levels as support or resistance in the future. The longer the line, the greater the likelihood that it will be support or resistance. This can help you identify potential entries.
The goal of this script is to make it easier to determine trends. Sometimes, we take the wrong trade because we don't understand which way the market is trending and what levels are important. This indicator is meant to take the guesswork out and make the trade easy and emotionless. This indicator works well on its own, but I suggest pairing it with another to add an extra confirmation before taking a trade. Happy Trading!
**Please note: Assets that have traded parabolically (steep inclines or declines) will have wide ranges that may not be broken. (see GME 2021)**
RSI Swing Trading Setup (2-Period)A simple script that adjusts the RSI visibly in order to better accommodate swing trading and certain swing trading setups/strategies.
--------------------------------------------------------------------------------------------------------------------------------------------------------
Best used in conjunction with "Linear Regression Channel by LonesomeTheBlue" with 2.2σ (std.dev) and Show Fib Levels.
^Click image for a redirect to that script.
--------------------------------------------------------------------------------------------------------------------------------------------------------
In certain price action patterns:
A bearish reversal from a previously bullish move can indicate tops of a rally if the RSI moves from 0-40 to 60 (1)
A bullish reversal from a previously bearish move can indicate bottoms of a pullback if the RSI moves from 60-100 to 40 (2)
(USE THE LINEAR REGRESSION CHANNEL TO VALIDIFY THE RETRACEMENTS)
--------------------------------------------------------------------------------------------------------------------------------------------------------
(1)
--------------------------------------------------------------------------------------------------------------------------------------------------------
(2)
--------------------------------------------------------------------------------------------------------------------------------------------------------

ORB Parabolic SAR Multi Time Frame (PSAR MTF)
This is an adaptation of the inbuilt PSAR function in a Multi Time Frame .
When MTF enabled It will plot two timeframe simultaneously as follows:-
1 Min with 5 Min (HTF)
5 Min with 15 Min(HTF)
15 Min with 1H(HTF)
1H with 4H(HTF)
4H with Daily(HTF)
Daily with Weekly(HTF)
Weekly with Monthly(HTF)
The higher timeframe(HTF) will get plotted in bigger circled lines.
By enabling plotting of all levels, you can see all current levels of all TF( M1 ,M5,M15,H,4H,D,W,M) on the same screen as "X" on the right side.
Alerts allow you to get alerts when these crossover happens.
