ICT 9:30am First FVGThis indicator is designed based on ICT (Inner Circle Trader)'s algorithmic price action theory, specifically targeting the first fair value gap (FVG) that forms immediately after the New York Stock Exchange opens at 9:30am. The FVG represents an imbalance in the price delivery where a significant price action gap occurs, which can play a crucial role in future price movements.
Features:
Identification of First FVG: Automatically identifies and plots the first fair value gap that forms post the 9:30am NY open.
Customizable Visualization: Choose between block or line styles for visual representation, with customizable colors and border styles.
Date Labeling: Optionally displays date labels for each identified gap to track patterns over time.
Imbalance Extension: Options to extend the imbalances to the current bar, helping to visualize their influence on ongoing price action.
Purpose:
The first fair value gap formed after the market opens is an important algorithmic price range in ICT's price action theory. This indicator simplifies the identification of these critical gaps and helps in understanding their impact on future price action.
Suporte e Resistência

Radius Trend [ChartPrime]RADIUS TREND
⯁ OVERVIEW
The Radius Trend [ ChartPrime ] indicator is an innovative technical analysis tool designed to visualize market trends using a dynamic, radius-based approach. By incorporating adaptive bands that adjust based on price action and volatility, this indicator provides traders with a unique perspective on trend direction, strength, and potential reversal points.
The Radius Trend concept involves creating a dynamic trend line that adjusts its angle and position based on market movements, similar to a radius sweeping across a chart. This approach allows for a more fluid and adaptive trend analysis compared to traditional linear trend lines.
◆ KEY FEATURES
Dynamic Trend Band: Calculates and plots a main trend band that adapts to market conditions.
Radius-Based Adjustment: Uses a step-based radius approach to adjust the trend band angle.
// Apply step angle to trend lines
if bar_index % n == 0 and trend
multi1 := 0
multi2 += step
band += distance1 * multi2
if bar_index % n == 0 and not trend
multi1 += step
multi2 := 0
band -= distance1 * multi1
Volatility-Adjusted Calculations: Incorporates price range volatility for more accurate band placement.
Trend Direction Visualization: Provides clear color-coding to distinguish between uptrends and downtrends.
Flexible Parameters: Allows users to adjust the radius step and initial distance for customized analysis.
◆ USAGE
Trend Identification: Use the color and direction of the main band to determine the current market trend.
Trend Strength Analysis: Observe the angle and consistency of the band for insights into trend strength.
Reversal Detection: Watch for price crossing the main band or crossing a dashed band as a potential trend reversal signal.
Volatility Assessment: The distance between price and bands can provide insights into market volatility.
⯁ USER INPUTS
Radius Step: Controls the rate of angle adjustment for the trend band (default: 0.15, step: 0.001).
Start Points Distance: Sets the initial distance multiplier for band calculations (default: 2, step: 0.1).
The Radius Trend indicator offers traders a unique and dynamic approach to trend analysis. By combining radius-based trend adjustments with volatility-sensitive calculations, it provides a fluid representation of market trends. This indicator is particularly useful for traders looking to identify trend persistence, potential reversal points, and adaptive support/resistance levels across various market conditions and timeframes.

ka66: Bar Range BandsThis tool takes a bar's range, and reflects it above the high and below the low of that bar, drawing upper and lower bands around the bar. Repeated for each bar. There's an option to then multiply that range by some multiple. Use a value greater than 1 to get wider bands, and less than one to get narrower bands.
This tool stems out of my frustration from the use of dynamic bands (like Keltner Channels, or Bollinger Bands), in particular for estimating take profit points.
Dynamic bands work great for entries and stop loss, but their dynamism is less useful for a future event like taking profit, in my experience. We can use a smaller multiple, but then we can often lose out on a bigger chunk of gains unnecessarily.
The inspiration for this came from a friend explaining an ICT/SMC concept around estimating the magnitude of a trend, by calculating the Asian Session Range, and reflecting it above or below on to the New York and London sessions. He described this as standard deviation of the Asian Range, where the range can thus be multiplied by some multiple for a wider or narrower deviation.
This, in turn, also reminded me of the Measured Move concept in Technical Analysis. We then consider that the market is fractal in nature, and this is why patterns persist in most timeframes. Traders exist across the spectrum of timeframes. Thus, a single bar on a timeframe, is made up of multiple bars on a lower timeframe . In other words, when we reflect a bar's range above or below itself, in the event that in a lower timeframe, that bar fit a pattern whose take profit target could be estimated via a Measured Move , then the band's value becomes a more valid estimate of a take profit point .
Yet another way to think about it, by way of the fractal nature above, is that it is essentially a simplified dynamic support and resistance mechanism , even simpler than say the various Pivot calculations (e.g. Classical, Camarilla, etc.).
This tool in general, can also be used by those who manually backtest setups (and certainly can be used in an automated setting too!). It is a research tool in that regard, applicable to various setups.
One of the pitfalls of manual backtesting is that it requires more discipline to really determine an exit point, because it's easy to say "oh, I'll know more or less where to exit when I go live, I just want to see that the entry tends to work". From experience, this is a bad idea, because our mind subconsciously knows that we haven't got a trained reflex on where to exit. The setup may be decent, but without an exit point, we will never have truly embraced and internalised trading it. Again, I speak from experience!
Thus, to use this to research take profit/exit points:
Have a setup in mind, with all the entry rules.
Plot your setup's indicators, mark your signals.
Use this indicator to get an idea of where to exit after taking an entry based on your signal.
Credits:
@ICT_ID for providing the idea of using ranges to estimate how far a trend move might go, in particular he used the Asian Range projected on to the London and New York market sessions.
All the technicians who came up with the idea of the Measured Move.

Volumatic S/R Levels [BigBeluga]THE VOLUMATIC S/R LEVELS
The Volumatic S/R Levels [ BigBeluga ] is an advanced technical analysis tool designed to identify and visualize significant support and resistance levels based on volume and price action.
The core concept of this indicator is to highlight areas where large volume and significant price movements coincide. It does this by plotting horizontal lines at price levels where unusually large candles (in terms of price range) occur alongside high trading volume. These lines represent potential support and resistance levels that are likely to be more significant due to the increased market activity they represent.
⬤ Key Features
Dynamic S/R Level Identification: Automatically detects and displays support and resistance levels from high volume candles.
Volume-Weighted Visualization: Uses line color to see positive or negative volume and box size to represent the strength of each level
Positive and Negative Volume:
Box Size Based on Volume:
Adaptive Levels Color: Adjusts level color based on price above or below level
Real-time Level Extension: Extends identified levels to the right side of the chart for better visibility
Volume and Percentage Labels: Displays volume information and relative strength percentage for each level
Dashed Levels: Displays levels with which price have interact multiple times
Dashboard: Shows max and min level information for quick reference
⬤ How to Use
Identify Key Levels: Look for horizontal lines representing potential support and resistance areas
Assess Level Strength:
- Thicker boxes indicate stronger levels, on which price reacts more
Monitor Price Interactions: Watch how price reacts when approaching these levels for potential trade setups
Volume Confirmation: Use the volume boxes to confirm the significance of each level
Relative Strength Analysis: Check the percentage labels to understand each level's importance relative to others
Trend Analysis: Use the color of the levels (lime for bullish, orange for bearish) to understand the overall market sentiment at different price points
Quick Reference: Utilize the dashboard to see the strongest and weakest levels at a glance
⬤ Customization
Levels Strength: Adjust the minimum threshold for level strength identification (default: 2.4)
Levels Amount: Set the maximum number of levels to display on the chart (max: 20)
The Volumatic S/R Levels indicator provides traders with a sophisticated tool for identifying key price levels backed by significant volume. By visualizing these levels directly on the chart and providing detailed volume and relative strength information, it offers valuable insights into potential areas of support, resistance, and price reversal. The addition of a ranking system and dashboard further enhances the trader's ability to quickly assess the most significant levels. This indicator is particularly useful for traders focusing on volume analysis and those looking to enhance their understanding of market structure. As with all technical tools, it's recommended to use this indicator in conjunction with other forms of analysis for comprehensive trading decisions.

Ultra Key LevelsThe "Ultra Key Levels" indicator is a powerful tool designed for traders who seek to identify critical price levels in the market. This Pine Script™ indicator is optimized to plot significant pivot highs and lows directly on your chart, providing a clear visual representation of potential support and resistance zones.
Pivot Detection: Automatically identifies and marks pivot highs and lows using customizable parameters. Traders can fine-tune the length of the pivots, allowing for precise detection of significant price points.
Dynamic Boxes: The indicator draws dynamic boxes around each identified pivot high and low, highlighting key levels. These boxes are adjusted based on the Average True Range (ATR), ensuring they reflect the current market volatility.
Pivot Highs/Lows: Control the appearance and behavior of pivot points with options to adjust source data, length, transparency, and the maximum number of pivots displayed on the chart.
ATR Multiplier: Set the ATR multiplier to determine the size of the boxes around pivot points, helping you assess the strength of each level.
Debug Mode: Activate debug mode to visualize pivot points and fine-tune your settings for optimal performance.
Scalability: Supports up to 500 boxes, making it suitable for both short-term and long-term traders who need to track multiple levels across different timeframes.
The "Ultra Key Levels" indicator is ideal for traders who rely on technical analysis to make informed decisions. By automatically identifying and highlighting key price levels, this tool helps you anticipate potential market movements and optimize your trading strategy.

Uptrick: Adaptive Cloud Oscillator (ACO)### **Uptrick: Adaptive Cloud Oscillator (ACO)**
---
### Introduction
The **Uptrick: Adaptive Cloud Oscillator (ACO)** is an advanced technical analysis tool designed to empower traders with precise trend detection and visual clarity in dynamic market conditions. By seamlessly integrating adaptive trend analysis, volatility filtering, and cloud-based support and resistance levels, the ACO provides traders with the actionable insights needed to navigate complex markets with confidence.
This indicator is highly customizable, allowing traders to tailor its functionality to their specific trading style and preferences. Whether you're a trend follower, swing trader, or looking to identify key support and resistance zones, the **Uptrick: ACO** is an indispensable tool that can adapt to a variety of market conditions.
### Indicator Purpose and Functionality
#### 1. **Adaptive Trend Detection**
At the heart of the **Uptrick: ACO** lies its adaptive trend detection algorithm. Unlike traditional moving averages that may lag in volatile markets or react too slowly to rapid changes, this adaptive method uses a smoothing technique that dynamically adjusts based on market conditions. By doing so, it provides a more responsive trend line that captures meaningful price movements while filtering out minor fluctuations.
- **How It Works:** The trend line is calculated using an adaptive smoothing factor, making it responsive to recent price actions while maintaining a level of stability that prevents whipsaw signals. This ensures that traders are always in tune with the prevailing market trend, whether bullish, bearish, or neutral.
#### 2. **Dynamic Cloud Support and Resistance**
The **Uptrick: ACO** features a dynamic "cloud" that serves as a key element in its analysis. This cloud is constructed using a moving average combined with the Average True Range (ATR), which adjusts based on the market’s volatility. The cloud provides dynamic support and resistance levels, essential for identifying potential reversal zones or confirming trend continuations.
- **Cloud Displacement:** The cloud is displaced forward by a user-defined number of bars, offering a predictive view of where future support and resistance levels may lie. This forward-looking feature helps traders anticipate potential price movements, making the ACO a powerful tool for planning trades ahead of time.
#### 3. **Versatile Visualization Options**
The **Uptrick: ACO** is designed with flexibility in mind, allowing users to choose between two distinct display modes:
- **Buy/Sell Signals:** In this mode, the indicator generates clear buy and sell signals based on crossovers of the trend line and the cloud boundaries. These signals are visualized directly on the chart with up and down labels, making it easy for traders to identify potential entry and exit points.
- **Cloud Fill Only:** For traders who prefer a cleaner chart, this mode removes the buy/sell signals and instead focuses on coloring the area between the upper and lower cloud boundaries. The color of the cloud fill changes based on the trend direction, providing a visual representation of the market's momentum.
- **Optional EMA Line:** An Exponential Moving Average (EMA) line can be optionally displayed on the chart. The EMA serves as an additional trend filter, helping traders further refine their entries and exits. The length, color, and thickness of the EMA are fully customizable to fit individual trading strategies.
### Practical Applications
#### 1. **Trend Following and Reversals**
The **Uptrick: ACO** excels in identifying and following trends. By analyzing the relationship between the trend line and the cloud, traders can determine the strength and direction of the current market trend. The cloud’s dynamic nature means it can adapt to both trending and ranging markets, providing consistent insights regardless of market conditions.
- **Example:** If the trend line crosses above the upper cloud boundary, it signals a potential buy opportunity. Conversely, a cross below the lower cloud boundary suggests a sell opportunity. Traders can use these signals to enter trades aligned with the prevailing trend.
#### 2. **Support and Resistance Identification**
The forward-displaced cloud acts as a predictive support and resistance zone. Traders can use these zones to set stop-loss levels, determine take-profit targets, or identify potential reversal points.
- **Example:** When the price approaches the upper cloud boundary from below, the boundary may act as resistance, indicating a potential reversal or pullback. If the price breaks through this level, it may signal a continuation of the bullish trend.
#### 3. **Volatility-Based Analysis**
By incorporating ATR into its calculations, the **Uptrick: ACO** provides a built-in mechanism to adapt to varying levels of market volatility. This makes it particularly useful in markets prone to sudden spikes in volatility, such as during major economic announcements or geopolitical events.
- **Example:** In a high-volatility environment, the cloud widens, allowing for greater price fluctuations within the trend. Traders can use this information to adjust their risk management strategies, such as widening stop-loss levels during volatile periods to avoid being stopped out prematurely.
### Customization and Flexibility
The **Uptrick: ACO** is designed to be highly customizable, ensuring it can meet the needs of traders with different strategies and preferences. Key customization options include:
- **Cloud and Trend Settings:** Traders can adjust the length of the cloud, the smoothing factor for the trend line, and the displacement of the cloud to optimize the indicator for their specific market and timeframe.
- **Display Modes:** With a simple dropdown selection, traders can choose whether to display buy/sell signals or focus solely on the cloud fill, providing flexibility in how the indicator is visualized.
- **Color and Style Customization:** The colors for bullish and bearish trends, cloud fill, buy/sell signals, and the EMA line can all be customized, allowing traders to integrate the **Uptrick: ACO** seamlessly into their existing chart setups.
### Conclusion
The **Uptrick: Adaptive Cloud Oscillator (ACO)** is more than just a trend indicator—it's a comprehensive market analysis tool that provides traders with a deep understanding of market dynamics. Its combination of adaptive trend analysis, dynamic support and resistance levels, and versatile visualization options makes it an essential tool for traders looking to gain an edge in any market environment.
Whether you're a seasoned trader or just starting, the **Uptrick: ACO** offers the insights and flexibility needed to make informed trading decisions. By helping you identify trends, anticipate reversals, and adapt to changing market conditions, the **Uptrick: ACO** can significantly enhance your trading strategy and improve your overall trading performance.

Uptrick: FVG Market Zones**Uptrick: FVG Market Zones**
---
### Introduction
**Uptrick: FVG Market Zones** is a cutting-edge technical analysis tool designed to identify and visualize Fair Value Gaps (FVGs) within financial markets. This indicator focuses on pinpointing critical price levels where significant gaps occur, which can act as potential support and resistance zones. By integrating advanced volatility analysis and user-configurable parameters, the **Uptrick: FVG Market Zones** provides traders with a robust framework for understanding market dynamics and making informed trading decisions.
### Purpose and Functionality
The primary purpose of the **Uptrick: FVG Market Zones** indicator is to detect and highlight Fair Value Gaps, which are areas on a price chart where there is a significant price movement without any trading activity in between. These gaps can provide critical insights into market behavior, as they often indicate areas where the market has not fully accounted for the supply and demand dynamics. Traders use these zones to anticipate potential reversals, breakouts, or consolidations, making this tool highly valuable for both short-term and long-term trading strategies.
### Unique Features and Originality
The **Uptrick: FVG Market Zones** indicator is distinguished by its focus on FVGs and its ability to integrate this concept into a broader market analysis framework. Unlike other indicators that may offer generalized support and resistance levels, this tool specifically identifies and visualizes gaps based on volatility-adjusted criteria. This precision allows traders to focus on the most relevant market zones, improving their ability to anticipate market movements.
One of the standout features of this indicator is its user-configurable settings, which provide a high degree of customization. This flexibility ensures that traders can tailor the indicator to suit their specific trading style and the particular market they are analyzing. Additionally, the indicator's visualization capabilities are enhanced with customizable colors and gap-filling options, making it easier for traders to interpret and act on the information presented.
### Inputs and Configurations
**Uptrick: FVG Market Zones** comes with several user inputs that allow traders to customize the indicator's behavior and appearance. Each input plays a crucial role in determining how the indicator identifies and visualizes FVGs on the chart. Here’s a detailed breakdown of each input:
1. **FVG Analysis Period (fvgPeriod):**
- **Description:** This input determines the period over which the indicator analyzes the chart for identifying FVGs. By adjusting this value, traders can control how far back in time the indicator looks to detect significant gaps.
- **Default Value:** 25
- **Purpose:** A shorter period may focus on more recent market activity, making the indicator more sensitive to recent price movements. In contrast, a longer period allows the indicator to identify gaps that have remained unfilled for an extended time, potentially acting as stronger support or resistance levels.
2. **Analysis Mode (mode):**
- **Description:** The Analysis Mode input allows traders to choose between different methods of analyzing the chart for FVGs.
- **Options:** "Recent Gaps" and "Extended View"
- **Default Option:** "Recent Gaps"
- **Purpose:**
- **Recent Gaps:** Focuses on the latest significant gaps, providing traders with up-to-date information on the most relevant market zones.
- **Extended View:** Considers a broader range of gap patterns, which can be useful in markets where historical gaps may still influence current price action.
3. **Volatility Sensitivity (volatilityFactor):**
- **Description:** This input adjusts the sensitivity of the indicator to market volatility. It is used in calculating the threshold for identifying FVGs.
- **Default Value:** 0.3
- **Step Size:** 0.1
- **Purpose:** A higher sensitivity will cause the indicator to detect smaller gaps, which might be more frequent but less significant. Lower sensitivity focuses on larger, more impactful gaps, which are less frequent but potentially more powerful in predicting market behavior.
4. **Highlight Market Gaps (showGaps):**
- **Description:** A boolean input that determines whether the identified FVGs should be highlighted on the chart.
- **Default Value:** True
- **Purpose:** This input allows traders to toggle the visualization of FVGs. When enabled, the indicator highlights gaps using colored boxes, making them visually prominent on the chart.
5. **Bullish Highlight Color (bullColor):**
- **Description:** Sets the color used to highlight bullish FVGs (gaps that may indicate support).
- **Default Value:** #00FF7F (a shade of green)
- **Purpose:** The color choice is crucial for quickly distinguishing bullish zones from bearish ones. Green is typically associated with upward price movement, making it intuitive for traders to identify potential support areas.
6. **Bearish Highlight Color (bearColor):**
- **Description:** Sets the color used to highlight bearish FVGs (gaps that may indicate resistance).
- **Default Value:** #FF4500 (a shade of red)
- **Purpose:** Red is commonly associated with downward price movement, making it easy for traders to identify potential resistance areas. This color coding helps in quickly assessing the chart.
7. **Fill Gap Areas (fillGaps):**
- **Description:** A boolean input that determines whether the FVGs should be filled with a color on the chart.
- **Default Value:** True
- **Purpose:** Filling the gap areas provides a more solid visual cue for traders. It enhances the visibility of the gaps, making it easier to spot these zones during fast-paced trading sessions.
8. **Hidden Color (hidden):**
- **Description:** A color input that is used when certain elements should be hidden from the chart.
- **Default Value:** color.rgb(0,0,0,100) (a semi-transparent black)
- **Purpose:** This input is useful for controlling the visibility of certain plots or elements on the chart, ensuring that the indicator remains clean and uncluttered.
### Market Gap Detection
The core functionality of the **Uptrick: FVG Market Zones** indicator lies in its ability to detect Fair Value Gaps. These gaps occur when the price makes a significant jump from one level to another without any trading activity in between. The indicator uses a combination of price action analysis and volatility thresholds to identify these gaps.
- **Volatility Measurement:** The indicator begins by measuring market volatility using the Average True Range (ATR). This volatility measurement is then adjusted by the user-defined sensitivity factor, which determines the threshold for identifying significant gaps.
- **Gap Identification:** The indicator checks for instances where the current low is higher than the high two bars ago (bullish gap) or where the current high is lower than the low two bars ago (bearish gap). These conditions signify a potential FVG.
- **Gap Storage and Management:** Once a gap is identified, it is stored in an array. The indicator also manages the size of these arrays based on the selected analysis mode, ensuring that only the most relevant gaps are considered in the analysis.
### Visualization
Visualization is a key component of the **Uptrick: FVG Market Zones** indicator. By providing clear and customizable visual cues, the indicator ensures that traders can quickly and easily interpret the information it provides.
- **Gap Highlighting:** When enabled, the indicator highlights the identified FVGs on the chart using colored boxes. Bullish gaps are highlighted in green, while bearish gaps are highlighted in red. This color coding helps traders instantly recognize potential support and resistance zones.
- **Gap Filling:** The indicator can also fill the identified gaps with a semi-transparent color. This option enhances the visibility of the gaps, making them more prominent on the chart. Filled gaps are particularly useful for traders who want to keep track of these zones over multiple trading sessions.
- **Gap Averages:** The indicator calculates the average level of the identified gaps and plots these averages as lines on the chart. These lines represent the general area of support or resistance based on the detected gaps, providing traders with a reference point for setting their stop losses or profit targets.
- **Text Labels:** The indicator also labels each FVG with the text "FVG" inside the highlighted area. This feature ensures that traders can easily identify these zones even in charts with dense price action.
### Practical Applications
The **Uptrick: FVG Market Zones** indicator is versatile and can be applied to a wide range of trading strategies across different markets and timeframes. Here are a few examples of how this indicator can be used in practice:
1. **Support and Resistance Trading:**
- Traders can use the identified FVGs as dynamic support and resistance levels. By placing their trades based on these levels, they can take advantage of potential reversals or continuations at key market zones.
2. **Gap Filling Strategy:**
- Some traders focus on the concept of gap filling, where the market eventually returns to "fill" the gap created by rapid price movements. The **Uptrick: FVG Market Zones** indicator can
help identify such gaps and anticipate when the market might return to these levels.
3. **Breakout Trading:**
- The indicator can be used to identify breakouts from significant gaps. When the price moves beyond the identified FVGs, it may signal a strong trend continuation, providing an opportunity for breakout traders.
4. **Reversal Trading:**
- By monitoring the signals generated by the indicator, traders can identify potential market reversals. A sell signal after a prolonged uptrend or a buy signal after a downtrend may indicate a reversal, allowing traders to position themselves accordingly.
5. **Risk Management:**
- The average levels of the FVGs can be used to set stop-loss and take-profit levels. By aligning these levels with the FVG zones, traders can improve their risk management practices and enhance their trading discipline.
### Customization and Flexibility
One of the standout features of the **Uptrick: FVG Market Zones** indicator is its high level of customization. Traders can adjust various parameters to tailor the indicator to their specific needs and preferences.
- **Customizable Colors:** The indicator allows traders to choose their preferred colors for highlighting bullish and bearish gaps. This flexibility ensures that the indicator can be integrated seamlessly into any trading setup, regardless of the trader's color scheme preferences.
- **Adjustable Periods and Sensitivity:** By allowing traders to adjust the analysis period and volatility sensitivity, the indicator can be fine-tuned to suit different market conditions. For example, a trader might use a shorter analysis period and higher sensitivity in a volatile market, while opting for a longer period and lower sensitivity in a more stable market.
- **Toggling Visual Elements:** Traders can choose to enable or disable various visual elements of the indicator, such as gap highlighting, gap filling, and text labels. This level of control allows traders to declutter their charts and focus on the information that is most relevant to their trading strategy.
### Advantages and Benefits
The **Uptrick: FVG Market Zones** indicator offers several key advantages that make it a valuable tool for traders:
1. **Precision:** By focusing on Fair Value Gaps, the indicator provides highly precise levels of support and resistance, which are often more reliable than traditional horizontal levels.
2. **Clarity:** The clear visual representation of FVGs, along with the text labels and color coding, ensures that traders can quickly interpret the indicator's signals and incorporate them into their trading decisions.
3. **Adaptability:** The indicator's customizable settings allow it to be adapted to different markets, timeframes, and trading styles. Whether you are a day trader, swing trader, or long-term investor, this indicator can be tailored to meet your needs.
4. **Enhanced Decision-Making:** The trading signals generated by the indicator provide actionable insights that can help traders make more informed decisions. By aligning their trades with the identified FVG zones, traders can improve their chances of success.
5. **Risk Management:** The use of FVG zones as reference points for stop-loss and take-profit levels enhances risk management practices, helping traders protect their capital while maximizing their profit potential.
### Conclusion
The **Uptrick: FVG Market Zones** indicator is a powerful and versatile tool for traders seeking to enhance their market analysis and improve their trading outcomes. By focusing on Fair Value Gaps and providing a high level of customization, this indicator offers a unique blend of precision, clarity, and adaptability. Whether you are looking to identify key market zones, generate trading signals, or improve your risk management practices, the **Uptrick: FVG Market Zones** indicator is a valuable addition to any trader's toolkit.
With its innovative approach to market analysis and user-friendly design, **Uptrick: FVG Market Zones** stands out as an essential tool for traders who want to stay ahead of the market and make more informed trading decisions. Whether you are trading stocks, forex, commodities, or cryptocurrencies, this indicator provides the insights you need to navigate the markets with confidence and success.

Rising & Falling Window Signals [LuxAlgo]The Rising & Falling Window Signals indicator identifies Rising & Falling Window formations on the chart and manages them for use as support and resistance zones. The Rising and Falling Window methods used in this indicator are based on Steve Nison's techniques, emphasizing the importance of these areas to better identify continuation momentum and likely reversal points.
Various filtering settings are included to identify zones of a specific width, as well as hide shorter zones from displaying on their chart, helping the users focus on the most significant zones.
🔶 USAGE
A Window (Rising or Falling) forms when the candle wicks from 2 consecutive candlesticks do not overlap, causing a gap. This gap is considered as a strong market sentiment of upward or downward movement, allowing traders to anticipate the likely direction of future prices.
The formation of a Rising Window is a typical indication that a bullish trend is likely to follow.
The formation of a Falling Window is a typical indication that a bearish trend is likely to follow.
After forming a window, we can interpret the zone as a likely area of support and resistance for the price to return to and react from.
Generally, the extremities of the window are used as support and resistance levels, with opposite extremities being regarded as the strongest point of support/resistance. However, when the window is exceptionally wide, the mid-point is looked upon as the strongest point of support/resistance. Once the price closes beyond the window, the window is no longer seen as supportive.
🔶 DETAILS
The script uses a fairly simple concept and implements it with familiar size and mitigation checks. From the settings of this script, the zones can be controlled based on user preferences.
🔹 Horizontal Zone Control
Horizontal Control Settings manipulate the extension and zone display for each zone; however, these settings do not affect the identification of each zone.
Maximum Live Zone Length: This determines the maximum duration of a zone. Zones will stop extending once the zone is mitigated, or if it has reached the maximum zone length determined by this setting.
Minimum Inactive Zone Length: This will hide mitigated (inactive) zones that are shorter than this setting value, this is used to free up the chart from irrelevant zones.
Extend Historical Zones on Touch: If a zone is unmitigated, but has stopped extending, it is considered a "historical" zone. If the price returns to a historical zone, this setting will cause it to extend to the current bar.
🔹 Vertical Zone Control
Vertical Control Settings filter out windows that are wider or thinner than the desired width range. Each of these settings is specified as "ATR Multipliers".
Minimum Width: Filters out any zones whose width is lower than ATR * Minimum Width.
Maximum Width: Filters out any zones whose width is higher than ATR * Maximum Width.
🔹 Signal Types
Signals are used to identify interactions with the Rising & Falling Window zones. The script has 3 different identification types to choose from:
Note: These are all bullish (rising window) examples of each signal.
Regular: The "regular" signal will fire when the price crosses above the upper extremity of an unmitigated zone.
Engulfing: The "engulfing" signal will fire when a bullish engulfing candlestick pattern occurs while one or more of the candle's wicks are touching the zone.
Wick: The "wick" signal will fire when the low of the candle is below the top of a zone, but the candle then closes above the top of the zone.
🔶 SETTINGS
🔹 Horizontal Zone Control
Maximum Live Zone Length: Maximum duration of newly formed zones.
Minimum Inactive Zone Length: Hides Zones whose length is lower than this setting.
Extend Historical Zones on Touch: Extend historical unmitigated zones when the price reaches the zone to the current bar.
🔹 Vertical Zone Control
Minimum Width: ATR multiplier used to filter out any zones whose width is lower than ATR * Minimum Width.
Maximum Width: ATR multiplier used to filter out any zones whose width is higher than ATR * Maximum Width.
Show Midlines: Determine if the zone midlines are displayed.
🔹 Signals
Show Zone Tests: Determine if signals appearing on zone tests are displayed.
Test Type: Sets the signal method for zone tests.
Signal Size: Sets label size for displayed signals.

[1] Dynamic Support and Resistance with breakout [Dr Future]This script appears to be designed to identify and visualize dynamic support and resistance levels on a price chart, along with potential breakout signals.
Key Components & Functionality (Inferred):
Dynamic Support and Resistance: The script likely employs algorithms to calculate and plot support and resistance levels that adjust in real-time as price action evolves.
Breakout Detection: The script probably incorporates logic to recognize when the price breaks out of these dynamic support or resistance zones. This could trigger alerts or visual cues on the chart.
Dr Future's Approach: It's worth noting the " " tag, suggesting the script might be based on specific methodologies or insights associated with a trader or analyst known as "Dr Future." Without more context on their strategies, it's difficult to pinpoint the exact techniques used.
Potential Benefits:
Adaptive Levels: Dynamic support and resistance can offer a more responsive approach compared to static levels, as they account for changing market conditions.
Breakout Opportunities: Identifying breakouts can help traders spot potential entry or exit points.
Visual Clarity: Plotting these levels directly on the chart can provide a clearer picture of the current market structure and potential turning points.
Caveats:
False Signals: Like any technical tool, dynamic support and resistance can generate false signals. Breakouts might not always lead to sustained trends.
Parameter Sensitivity: The script's effectiveness likely depends on how its parameters are configured. Fine-tuning might be required to suit different markets or timeframes.
"Dr Future" Factor: The script's performance could be tied to the specific strategies of "Dr Future," which might not be universally applicable.
Important Note:
Without access to the actual code and a deeper understanding of "Dr Future's" methods, this description is based on inference and general knowledge of technical analysis.
Recommendation:
If you're considering using this script, it would be prudent to:
Backtest Thoroughly: Test the script on historical data to assess its performance and identify potential pitfalls.
Understand the Parameters: Familiarize yourself with the script's settings and how they impact the plotted levels and breakout signals.
Combine with Other Tools: Use this script in conjunction with other technical indicators and risk management strategies for a more holistic trading approach.

Uptrick: Imbalance MA Trailing System
### **Overview**
The "Uptrick: Imbalance MA Trailing System" is a complex trading indicator designed to help traders identify potential bullish and bearish imbalances in the market, coupled with a trailing stop mechanism to manage trades. The indicator uses a combination of moving averages, Average True Range (ATR), and custom logic to detect trading signals and plot various levels on the chart to assist traders in making informed decisions.
### **Key Components and Functionality**
#### 1. **Inputs and Configuration**
- **Imbalance Filter (`imbalanceFilter`)**: This input sets the filter for detecting imbalances based on the difference between two price points. The value is a float and can be adjusted to fine-tune the sensitivity of imbalance detection. The default value is `0.0`, with a step size of `0.1`.
- **Moving Average Settings (`maLength1`, `maLength2`, `maColor1`, `maColor2`)**:
- `maLength1` and `maLength2` define the lengths of the two moving averages used in the indicator. By default, they are set to `50` and `200` periods, respectively.
- `maColor1` and `maColor2` specify the colors of these moving averages on the chart. The first MA is colored blue, and the second is red.
- **Take Profit and Stop Loss Settings (`displayTP`, `tpMultiplier`, `tpColor`, `displaySL`, `slMultiplier`, `slColor`)**:
- `displayTP` and `displaySL` are boolean inputs that control whether the TP and SL areas are displayed on the chart.
- `tpMultiplier` and `slMultiplier` are multipliers used to calculate the TP and SL levels relative to the detected imbalance level using the ATR value.
- `tpColor` and `slColor` define the colors of these areas. The TP area is green (with a transparency of 50), and the SL area is red (with a transparency of 50).
- **Trailing Stop Settings (`trailMultiplier`)**: This setting determines the multiplier used to calculate the trailing stop level based on the ATR value. The default multiplier is `2.5`.
- **Style Settings (`bullishColor`, `bearishColor`)**:
- `bullishColor` and `bearishColor` set the colors for bullish and bearish zones created when an imbalance is detected. The bullish zone is green, and the bearish zone is red.
- **Signal Label Size (`labelSizeOption`)**: The size of the signal labels displayed on the chart can be adjusted. The options include `Tiny`, `Small`, `Normal`, `Large`, and `Huge`. The selected size affects the visual prominence of the labels.
#### 2. **ATR Calculation (`atrValue`)**
- The ATR value is calculated using a period of 14, which is a standard setting for measuring market volatility. This value is used extensively throughout the indicator to calculate TP, SL, and trailing stop levels.
#### 3. **Imbalance Detection and Zone Creation**
- The indicator detects potential imbalances in the market by comparing certain price points, using a custom function (`imbalanceCondition`).
- **Bullish Imbalance Detection (`bullishSignal`)**:
- A bullish imbalance is detected when the low of three bars ago is higher than the high of one bar ago, and the current close is above the low of three bars ago.
- Additional conditions include checking that the current close is above the calculated average of the two moving averages (`ma1` and `ma2`), and that the imbalance exceeds the threshold set by the `imbalanceFilter`.
- **Bearish Imbalance Detection (`bearishSignal`)**:
- A bearish imbalance is detected under conditions where the low of one bar ago is higher than the high of three bars ago, and the current close is below the high of three bars ago.
- Like the bullish signal, the close must also be below the average of the two moving averages, and the imbalance must exceed the `imbalanceFilter` threshold.
- Upon detection of an imbalance (either bullish or bearish), the indicator creates a zone using `box.new` that highlights the price range of the imbalance. The box color corresponds to the bullish or bearish nature of the signal.
- The center of the imbalance range is marked with a dashed line, and a corresponding label (`🔴` for bearish and `🟢` for bullish) is placed on the chart to indicate the detected signal.
#### 4. **Take Profit and Stop Loss Calculation (`calculateTPSL`)**
- When an imbalance is detected, the indicator calculates potential TP and SL levels based on the ATR value and the respective multipliers.
- If the TP or SL areas are enabled, the indicator plots these areas as colored boxes on the chart.
- The function also tracks whether these levels are hit by subsequent price action, updating the status (`reached`) as appropriate.
#### 5. **Trailing Stop Logic (`applyTrailingStop`)**
- The trailing stop feature is a dynamic mechanism that adjusts the stop level as the price moves in the trader's favor.
- The trailing stop is calculated using the ATR value multiplied by the `trailMultiplier`.
- If the trailing stop is triggered (i.e., the price crosses the trailing stop level), the indicator marks the trade as stopped out.
#### 6. **Plotting and Visualization**
- The indicator plots the two moving averages on the chart with the specified colors and line width.
- If a trailing stop is active, it plots the trailing stop level on the chart, updating as the stop moves.
- The bar color changes based on the status of the current signal and whether the trailing stop or TP/SL levels have been hit.
### **Detailed Execution Flow**
1. **Initialization**: The indicator initializes several variables, including lines, boxes, and the current signal state. This setup ensures that the script can dynamically update these elements as new price data comes in.
2. **Moving Average Calculation**: The moving averages (`ma1` and `ma2`) are calculated using simple moving average (SMA) functions, which are foundational for many of the indicator's conditions.
3. **Imbalance Detection**: The script evaluates price action to detect potential bullish or bearish imbalances, applying filters based on the user-defined `imbalanceFilter`.
4. **Zone Creation and Labeling**: Upon detecting an imbalance, the script creates visual zones on the chart using the `box.new` function and labels the zones for easy identification.
5. **Take Profit and Stop Loss Logic**: The TP and SL areas are calculated and plotted if the relevant settings are enabled. The script continuously checks if these levels are reached as new bars form.
6. **Trailing Stop Calculation**: The script dynamically adjusts the trailing stop level based on the price movement and ATR value. The trailing stop helps lock in profits as the trade progresses.
7. **Plotting**: The moving averages, trailing stop levels, and bar colors are plotted on the chart, providing a visual representation of the indicator's signals and trade management levels.
8. **Final Checks and Updates**: The script concludes each bar's processing by updating the status of various elements, such as whether levels have been reached or if the trailing stop has been triggered.
### **Conclusion**
The "Uptrick: Imbalance MA Trailing System" is a highly versatile indicator designed for traders who want to identify market imbalances and manage their trades effectively using a combination of moving averages, ATR-based calculations, and custom logic. The indicator offers a wide range of customization options, allowing traders to adjust the sensitivity of imbalance detection, the size of the signal labels, and the visibility of various trade management levels (TP, SL, and trailing stop).
The combination of these features makes it a powerful tool for both novice and experienced traders, providing clear visual cues and robust trade management capabilities directly on the chart.

False Breakouts [TradingFinder] Fake Breakouts Failure🔵 Introduction
Technical indicators are essential tools for analysts and traders in financial markets, helping them predict price movements and make better trading decisions. One of the key concepts in technical analysis that should be carefully considered is the "False Breakout."
This phenomenon occurs when a price temporarily breaks through a significant support or resistance level but fails to hold and quickly returns to its previous range. Understanding this concept and applying it in trading can reduce risks and increase profitability.
🟣 What is a False Breakout?
A Fake Breakout, as the name suggests, refers to a breakout that appears to occur but fails to sustain, leading the price to quickly revert back to its previous range. This situation often happens when inexperienced or non-professional traders, under psychological pressure and eager to enter the market quickly, initiate trades.
This creates opportunities for professional traders to take advantage of these short-term fluctuations and execute successful trades.
🟣 The Importance of Recognizing False Breakouts
Recognizing False Breakouts is crucial for any trader aiming for success in financial markets. False Breakouts typically occur when the market approaches a critical support or resistance level.
In these situations, many traders are waiting to see if the price will break through this level. However, when the price quickly returns to its previous range, it indicates weakness in the movement and the inability to sustain the breakout.
🟣 How to identify False Breakouts?
To identify Fake Breakouts, it is important to carefully analyze price charts and look for signs of a quick price reversal after breaking a key level.
Here are some chart patterns that may help you identify a False Breakout :
1. Pin Bar Pattern : The Pin Bar is a candlestick pattern that indicates a price reversal. This pattern usually appears near support and resistance levels, showing that the price attempted to break through a key level but failed and reversed.
2. Fakey Pattern : This pattern, which consists of several candlesticks, indicates a False Breakout and a quick price return to the previous range. It usually appears near key levels and can signal a trend reversal.
3. Using Multiple Timeframes : One way to identify False Breakouts is by using charts of different timeframes. Sometimes, a breakout on a one-hour chart may be a False Breakout on a daily chart. Analyzing charts across multiple timeframes can help you accurately identify this phenomenon.
🔵 How to Use
Once you identify a False Breakout, you can use it as a trading signal. For this, it is best to look for trading opportunities in the opposite direction of the False Breakout. In other words, if a False Breakout occurs at a resistance level, you might consider selling opportunities, and if it happens at a support level, you might look for buying opportunities.
Here are some key points for trading based on False Breakouts :
1. Patience and Discipline : Patience and discipline are crucial when trading with False Breakouts. Wait for the False Breakout to clearly form before entering a trade.
2. Use Stop Loss : Setting an appropriate stop loss is vital when trading based on False Breakouts. Typically, the stop loss can be placed near the level where the False Breakout occurred.
3. Seek Confirmations : Before entering a trade, look for additional confirmations. These can include other analyses or technical indicators that show the price is likely to return to its previous level.
🔵 Settings
🟣 Logical settings
Swing period : You can set the swing detection period.
Max Swing Back Method : It is in two modes "All" and "Custom". If it is in "All" mode, it will check all swings, and if it is in "Custom" mode, it will check the swings to the extent you determine.
Max Swing Bac k: You can set the number of swings that will go back for checking.
🟣 Display settings
Displaying or not displaying swings and setting the color of labels and lines.
🟣 Alert Settings
Alert False Breakout : Enables alerts for Breakout.
Message Frequency : Determines the frequency of alerts. Options include 'All' (every function call), 'Once Per Bar' (first call within the bar), and 'Once Per Bar Close' (final script execution of the real-time bar). Default is 'Once per Bar'.
Show Alert Time by Time Zone : Configures the time zone for alert messages. Default is 'UTC'.
🔵Conclusion
False Breakouts, as a key concept in technical analysis, are powerful tools for identifying sudden price changes and using them in trading. Understanding this phenomenon and applying it can help traders perform better in financial markets and avoid potential losses.
To benefit from False Breakouts, traders need to carefully analyze charts and use the appropriate analytical tools. By leveraging this strategy, traders can achieve lower-risk and higher-reward trades.

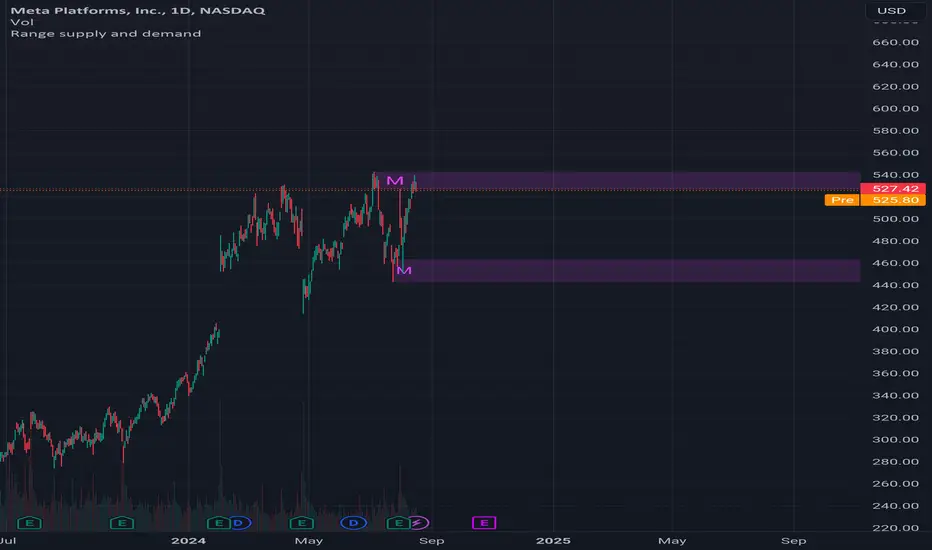
Range supply and demandHi all!
This is a very simple indicator. It plots the high timeframe (configurable via the "Timeframe" setting) high/low current timeframe bars (that has the same high/low as the higher timeframe) as supply/demand. The higher timeframe bar that's chosen is the one that's next last. As of now one high and one low zone is plotted.
The defaults are based on useful zones when on daily candles.
You can choose to display the higher timeframe within the zone via the "Show" option.
Hope this is clear enough, let me know otherwise.
Best of luck trading!
Dynamic Support, Resistance & Fibo by RezaDynamic Support, Resistance & Fibonacci Levels by Reza
This Pine Script indicator dynamically calculates and plots significant support and resistance levels, along with key Fibonacci retracement levels, based on recent price action. It provides traders with essential tools to identify crucial levels on the chart that may influence future price movements.
Key Features:
Dynamic Support and Resistance Lines:
The script identifies recent swing highs and swing lows within a customizable lookback period to determine dynamic support and resistance levels.
These levels are plotted as horizontal lines (blue for support, red for resistance) and are updated in real-time to reflect changes in the price structure.
Labels next to each line display the exact price level of the support and resistance, making it easy to identify them at a glance.
Fibonacci Retracement Levels:
The script calculates and plots Fibonacci retracement levels (23.6%, 38.2%, 50.0%, 55.9%, 61.8%, 66.7%, and 78.6%) between the identified support and resistance levels.
These Fibonacci levels are plotted as dotted lines, with customizable colors and labels for clarity.
The Fibonacci levels provide traders with potential retracement and extension levels, which are commonly used to predict price reversals, pullbacks, and continuation zones.
Customization:
Users can adjust the lookback period for swing high and swing low calculations to suit different trading styles and market conditions.
The script allows traders to enable or disable Fibonacci levels and choose whether or not to remove the background color of the labels for cleaner chart visuals.
Line width, highlight colors, and label colors are fully customizable for better integration with various chart styles and themes.
Real-Time Dashboard:
The indicator includes a real-time dashboard that calculates and displays the next potential target based on current market conditions, including potential retracement or continuation targets.
The dashboard dynamically updates based on trend direction and Fibonacci zones, giving traders valuable insights into potential price objectives.
How to Use:
This indicator is suitable for multiple timeframes, helping traders identify key levels in real-time as the market evolves.
By providing support and resistance zones along with Fibonacci retracement levels, this script offers a powerful combination of technical analysis tools for both novice and experienced traders.
The dynamic calculations help traders spot potential areas for entering or exiting trades, placing stop-loss levels, and identifying profit-taking zones.
Ideal for:
Traders who want to use support and resistance levels for trade planning.
Fibonacci enthusiasts looking for automated level plotting.
Anyone seeking to identify key price levels in real-time across different timeframes.
Script Author:
Reza – Bringing you dynamic, real-time support, resistance, and Fibonacci level plotting for more effective trading decisions.
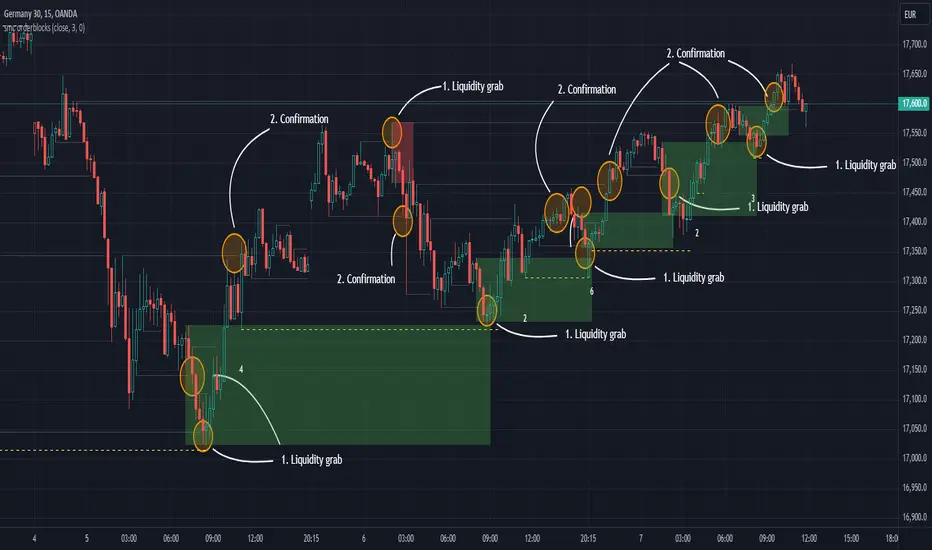
SMC Orderblocks (MTF)The SMC Orderblocks Indicator is designed to detect institutional orderblocks by focusing on price action and pattern detection, with a strong emphasis on identifying liquidity grabs.
This tool helps traders pinpoint areas where significant institutional trades are likely to occur by assuming the presence of orderblocks based on observed market behavior.
Unlike other indicators that may rely heavily on volume, the SMC Orderblocks Indicator offers a fresh approach rooted in a deep study of price action and Smart Money Concepts (SMC).
🔍 Unique Approach
Unlike other orderblock indicators that typically depend on volume to detect orderblocks (a common and valid method), the SMC Orderblocks Indicator explores a new approach. After extensive study and understanding of price action and SMC principles, this indicator focuses on market behavior to assume where institutional orderblocks might be. This approach offers traders a unique perspective and valuable insights, allowing them to view the market through a different lens.
🧠 The Theory Behind It
In trading, liquidity is essential for institutions and large market participants to execute their substantial orders. Orders tend to cluster around predictable levels, such as recent highs or lows, creating pools of liquidity. To secure better entry points for their large trades, institutions and market makers may manipulate prices to sweep these liquidity levels. The SMC Orderblocks Indicator is designed to detect these market manipulations—when price moves to capture liquidity—and uses these events to assume the presence of orderblocks at key levels. By recognizing these manipulations, the indicator provides insights into potential areas of significant institutional activity.
⚙️ How It Works
In order to make it work, there are two big essentail parts for this indicator. The first one is being able to identify liquidity areas. The second one is to detect the liquidity grab pattern.
1. Identifying Liquidity
So, in order to find market manipulations, mainly "liquidity grabs", the first thing we need is to find where the liquidity is.
Here "liquidity", refers to "orders", and only the exchange actually knows at what price orders are placed. The limit orders are visible in the order book and most of the time the exchange let this information be publicly accessed. But not all orders are in the orderbook. The stop-limit orders like stop-loss orders are added in the orderbook only when the market price reaches a certain price (the stop price).
At present, when using a chart script like Pinescript, there is no known way to access this real information.
But fortunately, traders and institutional behavior stay the same. Traders tend to place their orders at predictable levels, like above highs or below lows. They can also be near inducement areas, specifically created by institutions to induce traders to place their orders at certain levels.
So, the job of the indicator is first to find these levels, regardless of the method used. In the previous version of this script, I used pivots to detect highs and lows, but this method was lacking when it came to finding inducement zones or stacks of liquidity.
Instead, the indicator now uses a new method to check whether there is a stack of non-liquidated candles. This method allows the detection of inducement zones with unliquidated candles. When the stack reaches a certain number (by default, three), the liquidity is marked as valid for sweep detection.
Note: When using the indicator, you can enable the display of liquidity (to see mitigated and unmitigated liquidity) and their stack number.
2. Detecting a Liquidity sweep
Once the first and key part is done, we need to detect the market manipulation: the liquidity grabs. Liquidity grab patterns are always the same. In the following example, let's assume the institutions want to fill sell orders in a bearish market. Here are the steps they will likely take:
- 1. The institutionals place their main orders (the orderblock) at a desired price.
- 2. They let the liquidity accumulate next to that desired price. They can even induce traders to place their own orders there. The will serve as liquidity.
- 3. Institutionals will manipulate the market price to move it towards their awaiting orders to fill them. Once that price is reach, and their orders are being filled, the market price will start moving in the opposite direction.
- 4. The grab is confirmed, when the liquidity in that oppsiite direction is grabed, or simply when the bearish market trend resumes by breaking the lows, along with additional confirmations
Sometimes, institutions will have two opposite positions in the same asset—one short and one long. This is called hedging. The goal here is to use the long orders to push the market price towards the main sell orders. Once the sell orders are filled and the market price starts falling, they may try to push it up again to close their long position with minimal loss and finally let the price fall for good.
It is at that moment that it is best to enter the market. This is why, by default, the indicator will display when the price starts moving upward towards the liquidity grab: because it's where the manipulation started and where the price is likely to reach again before resuming the main trend.
Real-Time Visualization:
As soon as an "orderblock" (or market manipulation) is detected, the indicator will display it on the chart in real time.
This immediate visualization helps traders stay ahead and catch the main market move.
💡 Usage Tips
Apply the script to your chart. This is a price-action based script so it will work on most markets. You do not need to edit settings but you can adjust them to match your trading style.
To get the most out of the SMC Orderblocks Indicator, it’s recommended to use it alongside other analysis tools, espacially market structure indicators. You can try the free-to-use SMC Market Structure (MTF) to filter the interesting orderblocks.
Additionnaly, if you search liquidity areas to set as your trade's target, you can enable their display to see mitigated and unmitigated liquidity lines. The display is disabled by default to keep charts clean.
While the indicator helps detect potential institutional orderblocks based on liquidity grabs, combining its insights with your trading knowledge and other tools will enhance decision-making.
⚠️ Disclaimer
While this method provides useful information, the orderblocks can only be assumed based on market behavior. Moreover, given how the indicator works, the accuracy cannot be guaranteed. It's important to combine the indicator's information with your own experience and other confirmation methods.
Orderblocks are also time-sensitive. The fact that an orderblock was detected and displayed on the chart does not guarantee that orders will still be present when the price returns to that level. If too much time has elapsed since the orderblock was created, or if the market structure has changed, it may be wise to disregard it. Always seek additional confirmation before opening a position.
The theory presented here on how institutional orderblocks are made, and how the market may be manipulated to fill orders, is based on my own research, knowledge, and analysis. Since I have never worked within an institution, these are educated assumptions and could be incorrect. Please always do your own research.
🚀 Active Development
The SMC Orderblocks Indicator is continuously evolving, with updates aimed at improving the rules for detecting and confirming orderblocks. Future updates may include new features and bug fixes to enhance performance and adapt to different trading styles.
📬 Note: If you encounter a bug, please contact me directly via private message, as I do not want to pollute the comment section with screenshots.
If you have any questions or suggestions for new features, feel free to reach out. You can also add a comment to boost its visibility.
Additionally, it’s recommended to compare the results of this indicator with others to find what best suits your trading style.
Please note that while this indicator is a paid script, you do not need to pay to test it. Contact me directly on TradingView via private message or through my socials, or leave a comment, and I’ll provide you with a free trial.
Configurable Level Trading StrategyThe Dynamic Level Reversal Strategy is a trading approach designed to capitalize on price movements between key support and resistance levels. This strategy leverages configurable levels the trader determines, allowing for flexibility and adaptation to different market conditions.
Key Features:
Configurable Levels:
The strategy uses three key levels: Level 1 (Support), Level 2 (Middle), and Level 3 (Resistance). These levels can be adjusted directly within the script settings, making the strategy adaptable to various trading scenarios.
Buy and Sell Signals:
A buy signal is triggered when the price touches Level 1 and shows signs of reversal. The trader enters a position and sets an initial stop-loss just below Level 1.
As the price moves upward, the stop-loss is dynamically adjusted to just below Level 2 and Level 3, locking in profits while managing risk.
A sell signal is generated if the price reverses and crosses below the current stop-loss level, ensuring the trader exits the position with minimized losses.
Iterative Process:
The strategy allows for iterative trades, where the trader re-enters positions at Level 1 or Level 2 if the price revisits these levels, continually adjusting stop-losses and take-profit targets as the price oscillates between the defined levels.
Ideal Use Cases:
Range-Bound Markets: The strategy is particularly effective in markets where the price tends to oscillate between well-defined support and resistance levels.
Volatile Markets: The dynamic adjustment of stop-loss levels helps protect against sudden price reversals, making it suitable for volatile market conditions.
How to Use:
Set the desired levels (Level 1, Level 2, Level 3) based on your market analysis.
The script will automatically generate buy and sell signals, and adjust stop-loss levels as the price moves through the levels.
Monitor the signals and execute trades according to the strategy's guidelines.
Support line based on RSIThis indicator builds a support line using the stock price and RSI.
Inputs:
1. Time window for the RSI:
the time window the RSI is calculated with, usually it's 14 but in here I recommend 30.
2. offset by percentage:
just adding or subtructing some percentage of the result, some stocks need a bit of offset to work
3. stability:
the higher it is the less the RSI effects the graph. for realy high stability the indicator the the stock price will be realy close.
formula: (close*(100-newRSI)/50)*(100+offset)/100
when:
newRSI = (RSI + (50 * stability1))/(stability+1)
recommended usage:
Usually, if the indicator becomes higher than the price, (the price lowers). the stock will go up again to around the last price where they met.
so, for example, if the stock price was 20 and going down. while the indicator was 18 and going up, then they met at 19 and later the indicator became 20 while the stock fell to 18. most chances are that the stock will come back to 19 where they met and at the same time the indicator will also get to 19.
In stocks that are unstable, like NVDA. this indicator can be used to see the trend and avoid the unstability of the stock.
