Multi-Timeframe 200 EMAMulti-Timeframe 200 EMA Indicator
Description:
This indicator plots the 200-period Exponential Moving Average (EMA) from multiple timeframes on a single chart. It allows traders to visualize key trend levels across different timeframes, helping with confluence, trend identification, and potential trade setups.
Key Features:
Multi-Timeframe EMAs: Displays the 200 EMA from the 2m, 5m, 15m, 30m, 1hr, and 4hr timeframes, regardless of the chart's current timeframe.
Dynamic Labeling: Each EMA is labeled with its respective timeframe (e.g., "2m", "1hr", "4hr") and the labels update in real-time, staying on the current EMA value.
Auto-Updating Labels: The labels move with the EMAs as new candles form, ensuring a clean and informative display. Old labels automatically disappear to prevent clutter.
Color-Coded EMAs: Each EMA has a unique color, making it easy to differentiate between timeframes.
How to Use This Indicator in Trading:
Trend Confirmation: If price stays above the higher timeframe 200 EMA (e.g., 1hr, 4hr), it suggests an uptrend; below it suggests a downtrend.
Support & Resistance Zones: The 200 EMA from larger timeframes often acts as strong dynamic support or resistance.
Multi-Timeframe Confluence: If multiple EMAs are aligned in the same direction, it strengthens the trend bias.
Reversal or Breakout Signals: When price crosses above or below a higher timeframe EMA, it could indicate a potential trend change or breakout opportunity.
Best Used For:
🔹 Scalpers & Day Traders: Helps identify intraday trends and key levels across multiple timeframes.
🔹 Swing Traders: Useful for aligning trade setups with higher timeframe trends.
🔹 Trend Followers: Provides confirmation of long-term trends using the 200 EMA.
Suporte e Resistência

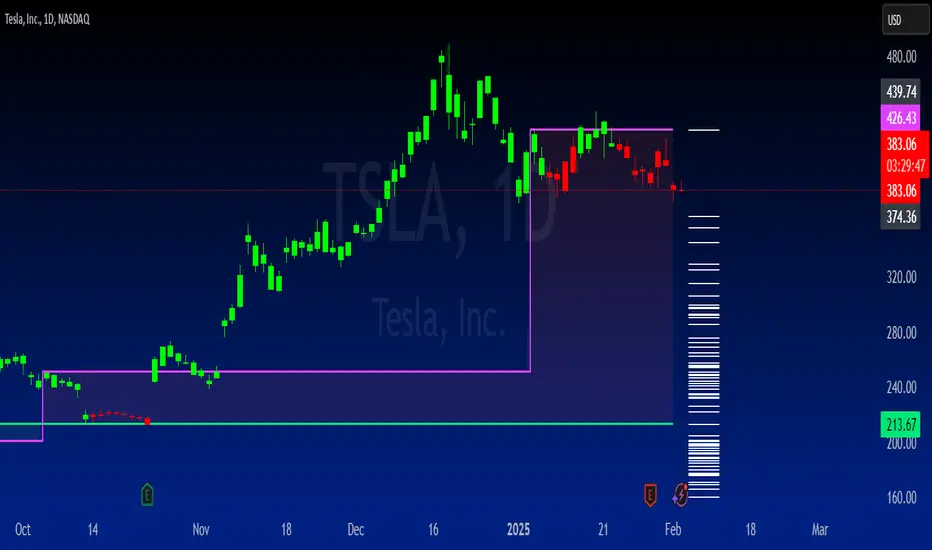
Correction Table# Correction Table Indicator
A powerful TradingView indicator that displays a comprehensive table showing price corrections from All-Time High (ATH) and the 200-day Simple Moving Average (SMA).
## Features
- Real-time calculation of 200-day Simple Moving Average (SMA)
- Display of current price deviations from 200 SMA
- ATH-based correction levels (-10%, -20%, -30%, -40%, -50%)
- Clear visualization through a customizable table
- Price differences shown in both absolute and percentage terms
- Color-coded positive/negative deviations for better readability
## Parameters
- **ATH Calculation Period**: Number of days to look back for calculating All-Time High (default: 90 days)
## Table Information
The indicator displays a table in the top-right corner of your chart with the following information:
- **200 SMA**: Current 200-day Simple Moving Average value
- **ATH-10%**: Price level at 10% below All-Time High
- **ATH-20%**: Price level at 20% below All-Time High
- **ATH-30%**: Price level at 30% below All-Time High
- **ATH-40%**: Price level at 40% below All-Time High
- **ATH-50%**: Price level at 50% below All-Time High
Each row shows:
- Target price level
- Current deviation from the price
- Percentage deviation

Timeframe Display Table with CustomizationsPlaces a single cell table in the top right of the chart to display the currently viewed timeframe at all times on the chart.

Advanced Support & Resistance [Alpha Extract]🔶 AE - Advanced Support & Resistance
A sophisticated yet user-friendly tool designed to enhance your trading analysis by accurately identifying and plotting key support and resistance levels. Built on a unique pivot-based detection algorithm, this indicator provides clear visual cues in real time, helping traders stay ahead of potential market reversals and breakouts.
🔶 Pivot-Based Detection
Leverages pivot highs and lows along with a configurable threshold to filter out overlapping levels. This method helps the script stand out from simpler support/resistance indicators by focusing on the most significant price zones.
🔶 Multi-Timeframe Analysis
Pulls higher-timeframe data to ensure that critical levels remain visible and properly scaled, regardless of your current chart view. This prevents distortion and offers a more comprehensive perspective of market structure.
🔶 Break Signal Alerts
Generates breakout or breakdown signals whenever the price crosses above or below a detected level—labeled as RB (Resistance Break) or SB (Support Break)—so traders can quickly spot shifts in momentum or trend.
🔶 Customizable Parameters
Fine-tune sensitivity and appearance—adjust pivot bar settings, lookback periods, thresholds, and the maximum number of plotted levels to match your trading style and preferences.
// === USER INPUTS ===
pivotLeft = input.int(15, "Left Pivot Bars", minval=1)
pivotRight = input.int(15, "Right Pivot Bars", minval=1)
lookback = input.int(200, "Lookback Period", minval=50)
threshold = input.float(0.2, "Price Threshold %", minval=0.1, step=0.1)
maxLevels = input.int(10, "Maximum Levels", minval=1)
📊How It Works
🔶 Identifying Pivots
The script scans for pivot highs and lows within a user-defined range of bars (Left Pivot Bars and Right Pivot Bars). Each pivot is evaluated against a proximity threshold, ensuring that similar nearby levels are combined into a single zone rather than cluttering the chart.
// === SUPPORT & RESISTANCE DETECTION ===
ph = ta.pivothigh(high, pivotLeft, pivotRight)
pl = ta.pivotlow(low, pivotLeft, pivotRight)
🔶Automatic Updates & Removal
Levels that remain untested or break too frequently are automatically removed based on the configured lookback period, keeping your chart focused on the most relevant support/resistance zones.
🔶Fixed Scaling
Through the use of higher-timeframe anchoring, the indicator maintains consistent plot lines that won’t distort when you zoom in or out. This approach ensures you always see crucial levels clearly.
🔶Entry and Exit Points
Pinpoint potential entry and exit opportunities based on how price interacts with these zones.
🔶Risk Management
Place stop-loss and take-profit orders around these levels to manage trade risk more effectively.
🔶Trend Confirmation
Observe how price respects or breaks levels to confirm ongoing trends or detect early signs of reversal.
🔶Sensitivity Adjustment
Control pivot bar width (pivotLeft and pivotRight) and the proximity threshold to focus on major or minor price zones.
🔶Visualization Options
Adjust line colors, styles, and thickness to align with your charting preferences.
🔶Maximum Levels
Limit the number of displayed levels to keep your chart clean and free of unnecessary clutter.

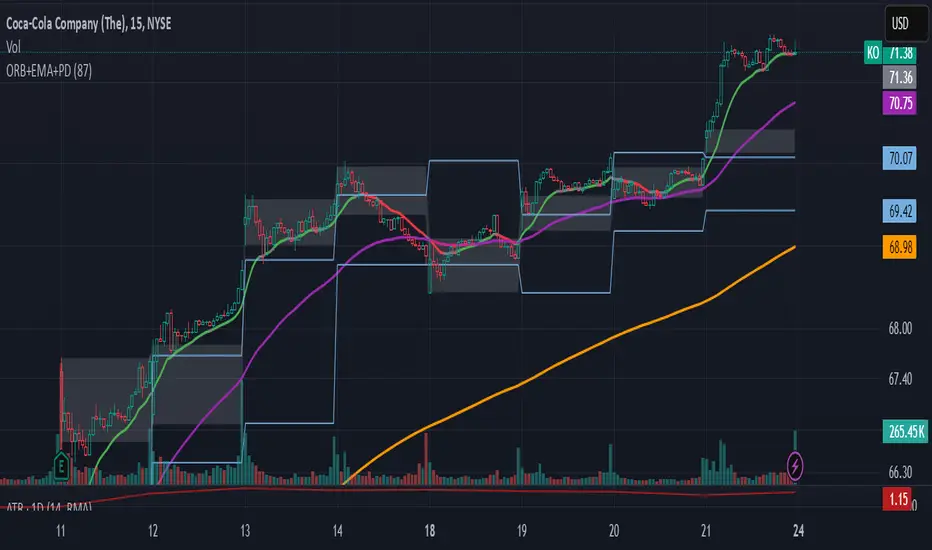
ORB-5Min + Adaptive 12/48 EMA + PDH/PDL
Overview:
This indicator combines the 5-Minute Opening Range Breakout (ORB), Adaptive 12/48 Exponential Moving Averages (EMAs), and Previous Day High/Low (PDH/PDL) levels to help traders identify key intraday levels and market trends.
Key Components and Logic:
5-Minute Opening Range Breakout (ORB):
Displays the high and low from the first 5-minute candle of the trading session.
Includes customizable opacity for the range fill.
Helps traders spot breakout opportunities and key support/resistance zones.
Adaptive 12/48 EMA System:
Displays EMAs for 9, 12, 48, and 200 periods.
The 12 EMA changes color based on whether the price is entirely above or below it.
The 48 EMA changes color depending on its relationship with the 12 EMA.
Provides dynamic trend identification and potential entry/exit signals.
Previous Day High/Low (PDH/PDL):
Displays the previous day’s high and low levels.
Useful for tracking key intraday support/resistance levels and potential reversal points.
Summary:
This script stands out by blending three popular intraday tools into a single comprehensive indicator. The combined visualization provides a layered market context that assists traders in making informed decisions quickly. The color-adaptive EMAs add clarity to trend direction, while the ORB and PDH/PDL levels highlight significant price zones for breakout or reversal trades.
How to Use:
Breakout Trades: Watch for price breaks above the ORB high or below the ORB low, especially when supported by EMA trends.
Trend Confirmation: Use the color-adaptive 12/48 EMA system to gauge momentum and market direction.
Reversal or Continuation: Observe how price reacts around PDH/PDL levels, especially if confluence with EMAs occurs.
This indicator is suitable for day traders seeking a clear and efficient way to track market structure, identify trends, and spot potential trade opportunities during regular market hours.
Adaptive Supply and Demand [EdgeTerminal]Adaptive Supply and Demand is a dynamic supply and demand indicator with a few unique twists. It considers volume pressure, volatility-based adjustments and multi-time frame momentum for confidence scoring (multi-step confirmation) to generate dynamic lines that adjust based on the market and also to generate dynamic support/resistance levels for the supply and demand lines.
The dynamic support and resistance lines shown gives you a better situational awareness of the current state of the market and add more context to why the market is moving into a certain direction.
> Trading Scenarios
When the confidence score is over 80%, strong volume pressure in trend direction (up or down), volatility is low and momentum is aligned across timeframes, there is an indication of a strong upward or downward trend.
When the supply and demand line crossover, the confidence score is over 75% and the volume pressure is shifting, this can be an indicator of trend reversal. Use tight initial stops, scale into position as trend develops, monitor the volume pressure for continuation and wait for confidence confirmation.
When the confiance score is below 60%, the volume pressure is choppy, volatility is high, you want to avoid trading or reduce position size, wait for confidence improvements, use support and resistance for entries/exits and use tighter stops due to market conditions. This is an indication of a ranging market.
Another scenario is when there is a sudden volume pressure increase, and a raising confidence score, the volatility is expanding and the bar momentum is aligning the volatility direction. This can indicate a breakout scenario.
> How it Works
1. Volume Pressure Analysis
Volume Pressure Analysis is a key component that measures the true buying and selling force in the market. Here's a detailed breakdown. The idea is to standardize volume to prevent large spikes from skewing results.
The indicator employs an adaptive volume normalization technique to detect genuine buying and selling pressure.
It takes current volume and divides it by average volume.
If normVol > 1: Current volume is above average
If normVol < 1: Current volume is below average
An example if this would be If current volume is 1500 and average is 1000, normVol = 1.5 (50% above average)
Another component of the volume pressure analysis is the Price Change Calculation sub-module. The purpose of this is to measure price movement relative to recent average.
It works by subtracting the average price from the current price. If the value is positive, price is average and if negative, price is below average.
Finally, the volume pressure is calculated to combine volume and price for true pressure reading.
2. Savitzky-Golay Filtering
SG filtering implements advanced signal smoothing while preserving important trend features. It uses weighted moving average approximation, preserves higher moments of data and reduces noise while maintaining signal integrity.
This results in smoother signal lines, reduced false crossovers and better trend identification. Traditional moving averages tend to lag and smooth out important features. Additionally, simple moving averages can miss critical turning points and regular smoothing can delay signal generation.
SG filtering preserves higher moments such as peaks, valleys and trends, reduces noise while maintaining signal sharpness.
It works by creating a symmetric weighting scheme. This way center points get the highest weights while edge points get the lowest weight.
3. Parkinson's Volatility
Parkinson's Volatility is an advanced volatility measurement formula using high-low range data. It uses high-low range for volatility calculation, incorporates logarithmic returns and annualized the volatility measure.
This results in more accurate volatility measurement, better risk assessment and dynamic signal sensitivity.
4. Multi-timeframe Momentum
This combines signals from each module for each timeframe to calculate momentum across three timeframes. It also applies weighted importance to each timeframe and generates a composite momentum signal.
This results in a more comprehensive trend analysis, reduced timeframe bias and better trend confirmation.
> Indicator Settings
Short-term Period:
Lower values makes it more sensitive, meaning it will generate more signals. Higher values makes it less sensitive, resulting in fewer signals. We recommend a 5 to 15 range for day trading, and 10 to 20 for swing trading
Medium-term Period:
Lower values result in faster trend confirmation and higher values show slower and more reliable confirmation. We recommend a range of 15-25 for day trading and 20-30 for swing trading.
Long-term Period:
Lower values makes it more responsive to trend changes and higher values are better for major trend identification. We recommend a range of 40-60 for day trading and 50-100 for swing trading.
Volume Analysis Window:
Lower values result in more sensitivity to volume changes and higher values result in smoother volume analysis. The optimal range is 15-25 for most trading styles.
Confidence Threshold:
Lower values generate more signals but quality decreases. Higher values generate fewer signals but accuracy increases.The optimal range is 0.65-0.8 for most trading conditions.

Reversal Probability Zone & Levels [LuxAlgo]The Reversal Probability Zone & Levels tool allows traders to identify a zone starting from the last detected reversal to highlight the probability of where the next reversal would be from a price and time perspective.
Price and time levels within the zone are displayed for up to 4 percentiles defined by the user.
🔶 USAGE
By default, the tool displays a zone with the 25th, 50th, 75th and 90th percentiles on both the price and time axis, indicating where, when and how many of the past reversals have occurred.
Traders can select the length for swing detection and the maximum number of reversals for probability calculations. The tool considers both bullish and bearish reversals separately, which means that if the last reversal was a swing high, the zone would show the probabilities for the last defined Maximum reversals
The Maximum reversals value has a direct impact on the probabilities, the more data traders use the more significant the result, probabilities over 10 occurrences are far weak compared to probabilities over 1000 occurrences.
🔹 Percentiles
Traders can fine-tune the percentile parameters in the settings panel.
A given percentile means that the number of occurrences in the data set is less than or equal to the percentile.
In English, this means
Percentile 20th: 20% of the occurrences are less than or equal to this value, so 80% of the occurrences are greater than this value.
Percentile 50th: 50% of the occurrences are below and 50% are above this value.
Percentile 80th: 80% of occurrences are lower than or equal to this value, so 20% of occurrences are greater than this value.
🔹 Normalize data
The Normalize Data feature allows traders to make an apples to apples comparison when we have a lot of historical data on high timeframe charts, using returns between swings instead of raw price.
🔹 Display Style
By default, the tool has the No overlapping feature enabled to display a clean chart, traders can turn it off, but this can fill the chart with too much information and barely see the price.
Traders can enable/disable settings to show only the last zone and the swing markers on the chart.
🔶 SETTINGS
Swing Length: The maximum length in bars used to identify a swing
Maximum Reversals: Maximum number of reversals included in calculations
Normalize Data: Use returns between swings instead of raw price
Percentiles: Enable/disable each of the four percentiles and select the percentile number, line style, colors, and size
🔹 Style
No Overlapping Zones: Enable or disable the No overlap between zones feature
Show Only Last Zone: Enable/disable display of last zone only
Show Marks: Enable/disable reversal markers

Enhanced Momentum Divergence Radar+ [Alpha Extract]Enhanced Momentum Divergence Radar+
The AE's Enhanced Momentum Divergence Radar+ is designed to detect momentum shifts and divergence patterns, helping traders identify potential trend reversals and continuation points. By normalizing momentum readings and applying divergence detection, it enhances market timing for entries and exits.
🔶 CALCULATION
The indicator calculates normalized momentum using a combination of Detrended Price Oscillator (DPO) and volatility-adjusted smoothing techniques. It highlights overbought and oversold conditions while identifying bullish and bearish divergences.
Core Calculation:
ATR-based volatility adjustment ensures dynamic sensitivity.
DPO is derived from the price minus a simple moving average (SMA) to isolate cyclical movements.
Momentum score is normalized using historical max values for consistent scaling.
Thresholds are dynamically adjusted based on average absolute momentum.
dpo = close - ma
sd = (dpo / volatility) * 100
normalizedSD = sd / maxAbsSD
The momentum score is plotted as a histogram, where:
Green bars indicate strong upward momentum.
Red bars indicate strong downward momentum.
Neutral values fade into gray.
🔶 DETAILS
📊 Visual Features:
Histogram bars dynamically color-coded based on momentum strength.
Threshold bands provide reference points for overbought and oversold levels.
Divergence markers (Bullish/Bearish & Hidden Bullish/Bearish) highlight key reversal signals.
🛠 How Divergences Work:
Bullish Divergence (𝓞𝓢): Price makes a lower low while momentum makes a higher low.
Bearish Divergence (𝓞𝓑): Price makes a higher high while momentum makes a lower high.
Hidden Divergences confirm trend continuations rather than reversals.
📌 Example of Divergence Logic:
bullishDiv = (low == priceLow) and (sd > momentumLow)
bearishDiv = (high == priceHigh) and (sd < momentumHigh)
🔶 EXAMPLES
📍 The chart below illustrates price reacting to momentum divergences, identifying potential tops and bottoms before major price moves.
📌 Example snapshots:
A bullish divergence leading to a reversal in price.
A bearish divergence marking the beginning of a downtrend.
🔶 SETTINGS
🔹 Customization Options:
Lookback Period: Adjusts sensitivity to market cycles.
Smoothing Period: Controls signal clarity.
Color Options: Enables bar coloring based on momentum strength.
Divergence Sensitivity: Choose to display hidden divergences.

Sma Indicator with Ratio (pr)SMA Indicator with Ratio (PR) is a technical analysis tool designed to provide insights into the relationship between multiple Simple Moving Averages (SMAs) across different time frames. This indicator combines three key SMAs: the 111-period SMA, 730-period SMA, and 1400-period SMA. Additionally, it introduces a ratio-based approach, where the 730-period SMA is multiplied by factors of 2, 3, 4, and 5, allowing users to analyze potential market trends and price movements in relation to different SMA levels.
What Does This Indicator Do?
The primary function of this indicator is to track the movement of prices in relation to several SMAs with varying periods. By visualizing these SMAs, users can quickly identify:
Short-term trends (111-period SMA)
Medium-term trends (730-period SMA)
Long-term trends (1400-period SMA)
Additionally, the multiplied versions of the 730-period SMA provide deeper insights into potential price reactions at different levels of market volatility.
How Does It Work?
The 111-period SMA tracks the shorter-term price trend and can be used for identifying quick market movements.
The 730-period SMA represents a longer-term trend, helping users gauge overall market sentiment and direction.
The 1400-period SMA acts as a very long-term trend line, giving users a broad perspective on the market’s movement.
The ratio-based SMAs (2x, 3x, 4x, 5x of the 730-period SMA) allow for an enhanced understanding of how the price reacts to higher or lower volatility levels. These ratios are useful for identifying key support and resistance zones in a dynamic market environment.
Why Use This Indicator?
This indicator is useful for traders and analysts who want to track the interaction of price with different moving averages, enabling them to make more informed decisions about potential trend reversals or continuations. The added ratio-based values enhance the ability to predict how the market might react at different levels.
How to Use It?
Trend Confirmation: Traders can use the indicator to confirm the direction of the market. If the price is above the 111, 730, or 1400-period SMA, it may indicate an uptrend, and if below, a downtrend.
Support/Resistance Levels: The multiplied versions of the 730-period SMA (2x, 3x, 4x, 5x) can be used as dynamic support or resistance levels. When the price approaches or crosses these levels, it might indicate a change in the trend.
Volatility Insights: By observing how the price behaves relative to these SMAs, traders can gauge market volatility. Higher multiples of the 730-period SMA can signal more volatile periods where price movements are more pronounced.

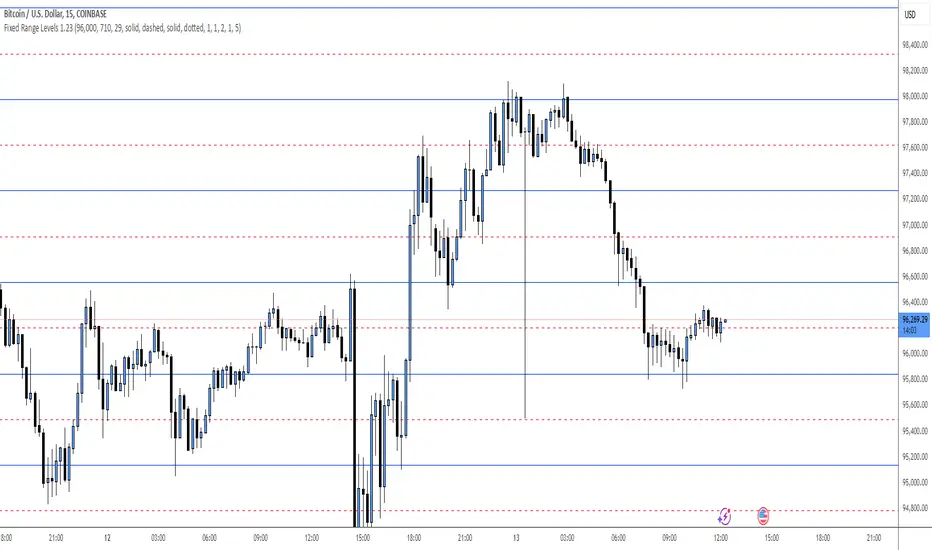
Fixed Range LevelsThis indicator draws horizontal price levels on your chart based on a starting price and a range size that you define. It can also draw midpoint lines between the main levels if enabled.
Here's a breakdown of its functionality:
Key Features:
Starting Price:
You define a starting price (e.g., 21630).
The indicator calculates a corrected base price by rounding the starting price to the nearest multiple of the range size.
Range Size:
You define a range size (e.g., 71).
The indicator draws horizontal lines at intervals of the range size above and below the corrected base price.
Dual Ranges:
You can define two range sizes (e.g., 71 and 29).
The indicator can draw levels for both ranges simultaneously or individually, depending on your settings.
Midpoint Lines:
If enabled, the indicator draws midpoint lines between the main levels.
For example, if the main levels are at 21584 and 21655, the midpoint line will be at 21619.5.
Customizable Styles:
You can customize the line style (solid, dotted, dashed) and color for both the main levels and midpoint lines.
Dynamic Levels:
The levels are recalculated and redrawn dynamically based on the starting price and range size.
How It Works:
Corrected Base Price Calculation:
The indicator calculates the corrected base price using the formula:
pinescript
Copy
correctedBasePrice = math.floor(startingPrice / rangeSize) * rangeSize
For example, if startingPrice = 21630 and rangeSize = 71:
Copy
correctedBasePrice = math.floor(21630 / 71) * 71 = 304 * 71 = 21584
Drawing Levels:
The indicator draws horizontal lines at intervals of the range size above and below the corrected base price.
For example, if rangeSize = 71 and maxLevels = 5, the levels will be drawn at:
Copy
21584 - (5 * 71) = 21249
21584 - (4 * 71) = 21320
...
21584 + (5 * 71) = 21939
Midpoint Lines:
If enabled, the indicator draws midpoint lines between the main levels.
For example, if the main levels are at 21584 and 21655, the midpoint line will be at:
Copy
(21584 + 21655) / 2 = 21619.5
Dual Ranges:
If you enable both ranges, the indicator will draw levels for both range sizes simultaneously.
For example, if rangeSize1 = 71 and rangeSize2 = 29, the indicator will draw two sets of levels:
Levels at intervals of 71 (e.g., 21584, 21655, 21726, ...).
Levels at intervals of 29 (e.g., 21634, 21663, 21692, ...).
Example Use Case:
Imagine you're trading a stock or cryptocurrency, and you want to identify key support and resistance levels based on a specific price range. Here's how you can use this indicator:
Set the Starting Price:
For example, if the current price is 21630, you can set this as the starting price.
Define the Range Size:
If you believe the price moves in increments of 71, set rangeSize1 = 71.
If you also want to track smaller increments of 29, set rangeSize2 = 29.
Enable Midpoint Lines:
If you want to see the midpoint between the main levels, enable Show Midpoint Line.
Customize Line Styles:
Choose different colors and styles for the main levels and midpoint lines to make them visually distinct.
Analyze the Chart:
The indicator will draw horizontal lines at the specified intervals, helping you identify potential support, resistance, and midpoint levels.
Why Is This Useful?
Support and Resistance Levels:
The horizontal lines act as dynamic support and resistance levels based on the range size you define.
Price Targets:
You can use the levels to identify potential price targets or areas where the price might reverse.
Midpoint Analysis:
The midpoint lines can help you identify areas of consolidation or potential breakout points.
Flexibility:
You can customize the range sizes, colors, and styles to suit your trading strategy.
Summary:
This indicator is a powerful tool for traders who want to visualize price levels and midpoints based on a specific range size. It helps you identify key levels for support, resistance, and potential price targets, making it easier to plan your trades.
Price Level Multi Timeframe [Snowdex]Price Level Multi-Timeframe Indicator
This indicator visualizes important price levels from multiple timeframes (e.g., daily, weekly, monthly) directly on the chart. It helps traders identify significant support and resistance levels for better decision-making.
Features:
Displays price levels for multiple timeframes: daily (1D), weekly (1W), monthly (1M), quarterly (3M), semi-annual (6M), and yearly (12M).
Customizable options to show or hide levels and adjust their colors.
Highlights high, low, and close levels of each timeframe with labels and dotted lines.
Includes options to extend levels visually for better clarity.
Benefits:
Easily compare price levels across timeframes.
Enhance technical analysis with multi-timeframe insights.
Identify key areas of support and resistance dynamically.

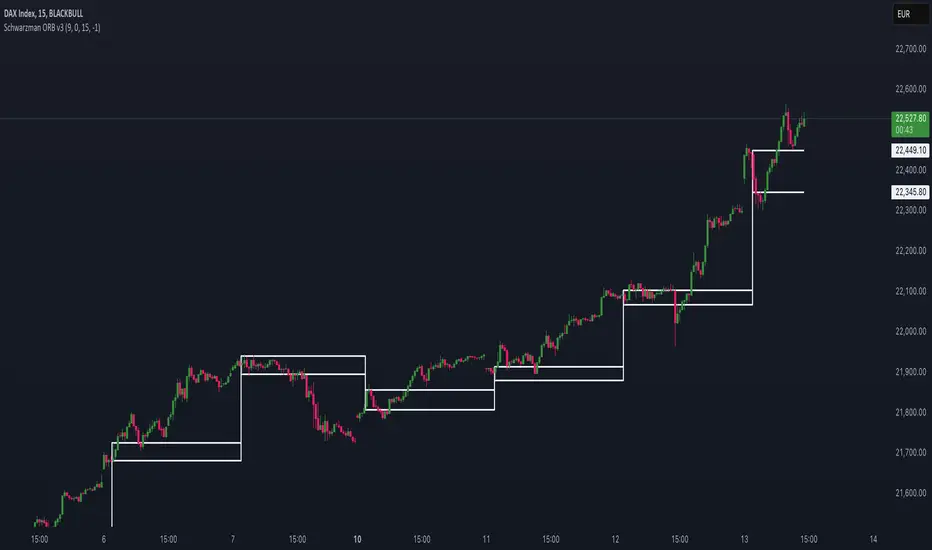
Schwarzman Custom ORB with Box DisplayIndicator Overview
The Schwarzman Custom ORB (Opening Range Breakout) Indicator is a fully self-developed script designed for traders who utilize opening range breakout strategies. This indicator allows users to customize their ORB settings, apply them to historical price data, and visually connect multiple ORBs to analyze past performance. The goal is to provide traders with a tool to backtest and refine their breakout strategies based on historical ORB data.
How the Indicator Works
1️⃣ User-Defined ORB Settings
• The user selects a custom start time (hour and minute) for the ORB.
• The user defines a duration (e.g., 15 minutes, 30 minutes, etc.) for the ORB period.
• A timezone offset is included to adjust for different market sessions.
2️⃣ ORB High and Low Calculation
• The script records the highest and lowest prices within the selected ORB time window.
• The recorded values remain static after the ORB period ends, ensuring accurate range plotting.
3️⃣ Historical ORB Visualization
• Instead of only showing a single ORB for the current session, this indicator connects multiple ORBs across past data.
• This allows traders to visually analyze previous breakout performance.
• The plotted ORBs remain fixed and do not repaint, ensuring an accurate backtesting experience.
4️⃣ Stepline Visualization & Range Filling
• The high and low ORB levels are displayed using stepline plots to maintain clear horizontal levels.
• A shaded box is applied between the ORB high and low for better visualization.
Use Cases & Strategy Application
📌 Backtesting Historical ORBs – See how past ORBs performed under different market conditions.
📌 Custom ORB Settings – Adjust the start time and duration for different trading sessions.
📌 Multi-ORB Analysis – Connect ORBs over multiple trading days to study trends and breakouts.
📌 Breakout Strategy Optimization – Use the historical ORB connections to refine entry and exit points.
This indicator is particularly useful for day traders, scalpers, and breakout traders looking for a data-driven approach to trading.
Indicator Development & Transparency Statement
As a trader, I have tested various ORB (Opening Range Breakout) indicators available in the TradingView community. Through these experiences, I aimed to develop a version that best fits my own trading needs and strategy.
This script is a self-developed ORB tool, created from scratch while drawing inspiration from the concept of opening range breakouts, which is widely used in trading. Since I initially coded in Pine Script v4, I used ChatGPT to help refine and migrate the script to Pine Script v6 to ensure compatibility with the latest TradingView features. However, the core logic, structure, and customization were entirely designed and implemented based on my own approach.
I am making this indicator public not to violate any TradingView guidelines but to share my work with the trading community and provide a tool that can help others analyze ORB-based strategies. If there are any compliance concerns, I am open to adjusting the script accordingly, but I want to clarify that this is not a copy of any existing ORB script—it is a custom-built indicator tailored to my own trading preferences.
I appreciate the opportunity to contribute to the community and would welcome any specific feedback from TradingView regarding rule compliance.
Best regards,
Janko S. (Schwarzman)
Appeal to TradingView
Dear TradingView Team,
This script is 100% self-developed and does not copy or replicate any third-party code. It is a customized ORB tool designed for traders who wish to backtest and analyze opening range breakout strategies over multiple sessions. We kindly request specific clarification regarding which exact line(s) of code violate TradingView’s guidelines. If there are any compliance concerns, we are happy to adjust the script accordingly.
Please let us know the precise rules or community guidelines that were violated so we can make the necessary modifications.
🚀 Summary
✔ Fully Custom & Self-Developed – No copied or third-party code.
✔ Innovative Feature – Connects past ORBs for strategy backtesting.
✔ Transparent & Compliant – Requesting exact details on any potential rule violations.
Market Structure HH, HL, LH and LLMarket Structure Indicator (HH, HL, LH, LL) – Explanation and Usage
Overview:
This indicator is designed to detect and visualize market structure shifts by identifying Higher Highs (HH), Higher Lows (HL), Lower Highs (LH), and Lower Lows (LL). It plots a ZigZag structure to mark trend changes, helping traders analyze price swings and market direction.
Indicator Logic:
The indicator operates based on ZigZag swing points to define trend shifts and structure changes.
Identifying Market Swings:
It finds local highs and lows using the ZigZag Length (zigzag_len), which defines how many bars back to check for a new swing high/low.
If the current high is the highest over zigzag_len periods, it marks it as a swing high.
If the current low is the lowest over zigzag_len periods, it marks it as a swing low.
Determining Market Structure:
Uptrend: Higher Highs (HH) & Higher Lows (HL)
Downtrend: Lower Lows (LL) & Lower Highs (LH)
The script continuously tracks the last two highs (h0, h1) and last two lows (l0, l1) to classify the current market structure.
Visual Elements:
ZigZag Line (Optional): Connects major swing highs and lows for trend visualization.
Labels (HH, HL, LH, LL):
HH (Higher High) – Price is making new highs → Uptrend Continuation.
HL (Higher Low) – Price forms a higher bottom → Uptrend Confirmation.
LL (Lower Low) – Price is making new lows → Downtrend Continuation.
LH (Lower High) – Price forms a lower top → Downtrend Confirmation.
Breakout Confirmation with Fibonacci Factor (Optional)
The indicator includes an option to confirm breakouts using the fib_factor, which ensures price moves beyond a certain retracement level.
How to Use This Indicator in Trading:
1. Identifying Trends & Trend Reversals
Uptrend: Look for a sequence of HH and HL.
Downtrend: Look for a sequence of LL and LH.
Trend Reversal: If price transitions from HH-HL to LH-LL, it signals a shift from an uptrend to a downtrend (and vice versa).
2. Confirming Entry & Exit Points
Buy Entry (Long Position)
Enter after a Higher Low (HL) is confirmed in an uptrend.
Combine with support zones or moving averages for confirmation.
Sell Entry (Short Position)
Enter after a Lower High (LH) is confirmed in a downtrend.
Combine with resistance zones or moving averages for confirmation.
Exit Strategy
Exit long trades when price fails to make a HH and forms an LH instead.
Exit short trades when price fails to make a LL and forms an HL instead.
3. Spotting Breakouts & Order Blocks
The Fib Factor setting allows traders to filter false breakouts by confirming price movement beyond a retracement threshold.
Potential Order Blocks can be identified by looking at the last major swing point before a breakout.
Benefits of This Indicator for Traders
✅ Trend Identification: Helps traders quickly determine if the market is in an uptrend or downtrend.
✅ Clear Market Structure Labels: Easily visualizes Higher Highs, Higher Lows, Lower Highs, and Lower Lows.
✅ Avoids Noise: The ZigZag algorithm removes small fluctuations and focuses on significant market movements.
✅ Assists with Entry & Exit Decisions: Provides objective signals for trend continuation or reversals.
✅ Works in All Markets: Useful for stocks, forex, crypto, and futures trading.
Would you like me to add additional features like Order Blocks, Breakout Confirmation, or Alerts to improve this indicator? 🚀

CandelaCharts - Fib Retracement (OTE) 📝 Overview
The CandelaCharts Fib Retracement (OTE) indicator is a precision tool designed to help traders identify Optimal Trade Entry (OTE) levels based on Fibonacci retracement principles, as taught in ICT (Inner Circle Trader) methodology.
This indicator automatically plots Fibonacci retracement levels between a selected swing high and swing low, highlighting the key OTE zone between the 61.8% and 78.6% retracement levels—a prime area for potential reversals in trending markets.
📦 Features
Automatic & Custom lookback modes
Customizable fib levels
Dynamic coloring
Reverse & extend
⚙️ Settings
Lookback: Controls the number of bars to look back. You can choose between **Automatic** or **Custom** mode.
Line Style: Sets the line style for the Fibonacci levels.
Levels: 0, 0.236, 0.0.382, 0.500, 0.620, 0.705, 0.790, 0.886, 1.000. Allows you to toggle the visibility of Fibonacci levels.
Dynamic Coloring: Colors Fibonacci levels according to trend direction.
Show Labels: Shows the price value at each Fibonacci level.
Reverse: Flips the Fibonacci levels in the opposite direction.
Extend Left: Extends the Fibonacci levels to the left.
⚡️ Showcase
Dynamic Coloring
Manual Coloring
Fib Retracement
Extended
Custom Length
📒 Usage
Using the CandelaCharts Fib Retracement (OTE) is pretty straightforward—just follow these steps to spot high-probability trade setups and refine your entries.
Identify the Trend – Determine whether the market is in an uptrend or downtrend.
Select Swing Points – The indicator automatically plots from the most recent swing high to swing low (or vice versa).
Wait for Price to Enter OTE Zone – Look for price action confirmation within the optimal entry zone (61.8%-78.6%).
Enter the Trade – Consider longs in an uptrend at the OTE zone, and shorts in a downtrend.
Set Stop & Target – Place stops below/above the swing low/high and target extension levels (127.2%, 161.8%).
🎯 Key takeways
The CandelaCharts Fib Retracement (OTE) is a must-have tool for traders looking to refine their entries and maximize risk-reward potential with precision-based ICT trading strategies. 🚀
🚨 Alerts
The indicator does not provide any alerts!
⚠️ Disclaimer
Trading involves significant risk, and many participants may incur losses. The content on this site is not intended as financial advice and should not be interpreted as such. Decisions to buy, sell, hold, or trade securities, commodities, or other financial instruments carry inherent risks and are best made with guidance from qualified financial professionals. Past performance is not indicative of future results.

Multi Timeframe 8x MA Support Resistance Zones [SiDec]Multi-Timeframe Moving Average Support/Resistance Zones: The Ultimate Trading Power Tool
Indicator Overview
Get ready to elevate your trading game with the Multi-Timeframe Moving Average Support/Resistance Zones indicator. This advanced tool is engineered for traders who want to maximize efficiency without constantly switching between timeframes. By dynamically plotting support and resistance zones using the 21 SMA and 21 EMA, it reveals crucial price levels where trends may pause, reverse, or accelerate—giving you actionable insights in a fraction of the time.
Imagine seeing all the relevant timeframe zones on one chart, without ever needing to flip between timeframes—saving you time and allowing you to focus on what really matters.
Core Features
Dynamic Zones That Adjust in Real-Time:
The area between the 21 EMA and 21 SMA is shaded, forming a "zone" on your chart. This dynamic zone adjusts live as price moves, keeping you in sync with current market behavior across multiple timeframes.
By showing these zones across all your selected timeframes, you can view everything you need at a glance—no time wasted jumping between charts.
All Timeframes, One View:
With the ability to view multiple timeframe zones simultaneously (from 5-minute to Monthly), this tool helps you spot key levels quickly without switching between timeframes. You’ll see how price interacts with these levels across different timeframes without ever having to change charts.
Higher timeframes show broader, more significant zones—giving you the market's big picture—while intraday zones help you fine-tune your entries.
Customisable Like Never Before:
Toggle Timeframes: Only activate the timeframes you care about—no distractions, just pure focus.
Color Your World: Assign different colors to each timeframe for instant visual cues (e.g., blue for Daily, gold for Weekly). This makes it easy to identify key zones across all timeframes at a glance.
Why You Need This Tool
Instant Trend Confirmation: Track how price interacts with multiple timeframe zones to confirm bullish or bearish momentum in real-time.
Confluence = High Confidence: When zones from multiple timeframes overlap, you’ve found a high-probability reversal area. This is where the market is likely to turn, and where your edge lies.
Efficiency at Its Best: No more switching between timeframes—everything you need is in one place, giving you more time to trade and less time spent on analysis.
Configuration Instructions
1.) Timeframe Selection:
Choose which timeframes to display using the Timeframe Selection panel.
Intraday Focus: 5m, 15m, 1H.
Swing/Long-Term Focus: 4H, 12H, Daily, Weekly, Monthly.
Color Coding: Assign a distinct color to each timeframe for instant identification—like having a personal color-coded trading roadmap.
2.) MA Settings:
MA Types:
21 EMA: Perfect for capturing short-term trends and fast price action.
21 SMA: The smooth operator for spotting longer-term trends with more consistency.
Recommended Periods: The 21-period MA works wonders for trend detection across various timeframes. You can also integrate Fibonacci-based MAs (e.g., 55, 233) for enhanced confluence.
3.) Visual Tweaks:
Opacity: Adjust the zone transparency (80-90% opacity keeps it visible yet non-intrusive).
Zone Extensions: Customize how far zones extend backward and forward, capturing the full impact of support/resistance levels.
Labels: Show real-time MA values and timeframe-specific details for further clarity.
Trading Strategies That Pack a Punch
1.) Trend Confirmation:
Uptrend: Price staying above the 21 EMA and 21 SMA suggests a bullish trend.
Downtrend: Price holding below these MAs signals a bearish market.
2.) Zone-Based Reversals:
Entry: Look for price to retrace to a higher timeframe support zone (e.g., Daily 21 SMA) with confirmation from oversold/overbought indicators like RSI.
Exit: Time to sell when price breaks through a critical zone, like the 4H 21 EMA.
3.) Confluence Trading:
Combine the zones with other indicators to amplify your trade setups:
Fibonacci Levels: When a 61.8% retracement lines up with an MA zone, you’ve found a high-confluence area.
Volume Profile: High-volume nodes near key zones strengthen their significance.
Best Practices for Maximum Profit
Focus on Higher Timeframes: Weekly and Monthly zones carry more weight, making them more significant in decision-making.
Avoid Clutter: If you’re trading higher timeframes, disable intraday timeframes like 5m and 15m to keep your chart clear and focused.
Risk Management: Zones are probabilities, not guarantees. Always use stop-loss orders to protect your trades.
Example of a Winning Setup
Scenario:
Price retraces to the 1H 21 EMA zone.
The Daily 21 SMA zone is nearby—talk about confluence!
RSI shows oversold conditions, indicating a potential reversal.
Action:
Enter long on a bullish candlestick pattern (e.g., bullish engulfing).
Set your stop-loss just below the Daily 21 SMA zone.
Target the next higher timeframe resistance.
Performance Considerations
Repainting Risk: Zones might slightly adjust with the formation of new bars, but the changes will typically be minimal.
Enhance with Oscillators: Use momentum indicators like MACD or Stochastic and volume analysis for even more confirmation.
Conclusion
The Multi-Timeframe Moving Average Support/Resistance Zones indicator isn’t just a tool—it’s a game-changer. With the ability to view all relevant timeframe zones on one chart, you can make decisions faster, spot high-confluence areas, and trade with greater precision. The time you save by not switching between timeframes can make all the difference in your trading success.
Maximise your trading edge—harness the power of multi-timeframe analysis, gain more time to trade, and dominate the market like never before. 📊🔍

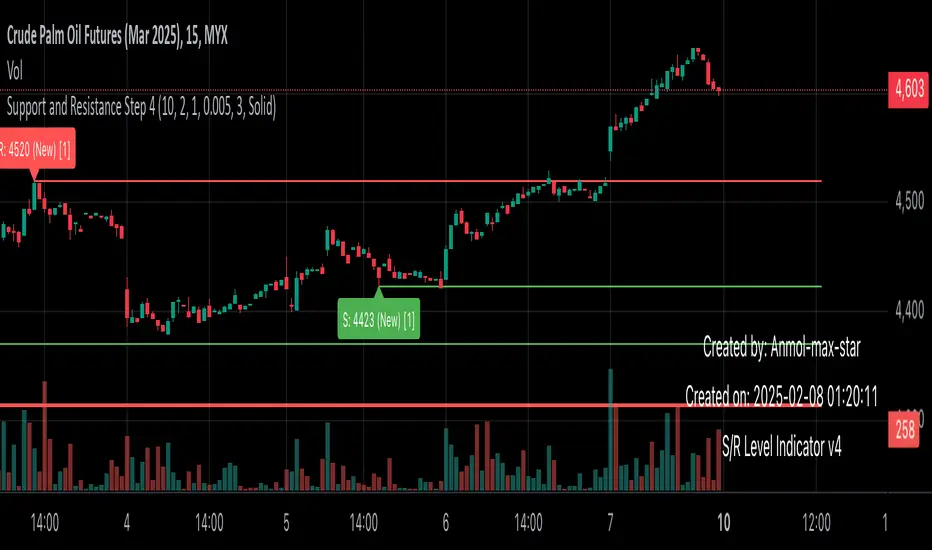
Support and Resistance all in one The Support and Resistance Indicator (v4) is designed to identify and track key price levels in financial markets. Here's how it works:
Core Functionality
Level Detection
Uses pivot points to identify significant price levels
Looks for swing highs (resistance) and swing lows (support)
Requires price action to pivot over a specified period (default 10 bars)
Dynamic Level Management
Maintains separate arrays for support and resistance levels
Limits maximum displayed levels (default 10) to prevent chart clutter
Removes oldest levels when maximum is reached
Ensures new levels are sufficiently distant from existing ones (minimum 1% separation)
Touch Detection System
Monitors price interaction with established levels
Counts when price comes within 0.1% of any level
Updates touch count and strength classification
Categories: "New" (1 touch), "Moderate" (2 touches), "Strong" (3+ touches)
Visual Representation
Draws horizontal lines at each level
Updates line width based on strength (thicker for stronger levels)
Shows labels with price and strength information
Color coding: Red (new/moderate levels), Green (strong levels)
Displays triangles (▼▲) at pivot points
Trading Applications
Support/Resistance Trading
Strong levels (3+ touches) suggest reliable trading zones
More touches indicate higher probability reversal points
Use for stop loss and target placement
Breakout Trading
Monitor breaks of strong levels
Higher touch count suggests more significant breakouts
Watch for false breakouts at weaker levels
Risk Management
Place stops beyond strong levels
Use level strength to adjust position size
Consider multiple timeframe analysis
Best Practices
Use with other indicators for confirmation
Consider market context and trend
Monitor level strength development
Don't rely solely on touch count
Watch for price reaction at levels
Customization Options
Adjust pivot length for different timeframes
Modify minimum distance between levels
Change required touches for "Strong" classification
Toggle strength labels display
Choose line style (Solid/Dashed/Dotted)
This indicator helps identify key price levels where market participants have shown interest, making it valuable for trade planning and risk management
Midgar's DikFat Dynamic Support and ResistanceMidgar Heiken-Ashi Commission Indicator
This indicator is a leading indicator designed to identify key price levels and potential support/resistance zones using Heiken-Ashi calculations. It provides visual aids such as dynamic support/resistance lines, price labels, and percentage distance tags to help traders interpret market structure more effectively.
How It Works:
1. Heiken-Ashi Calculation
- The indicator constructs Heiken-Ashi values based on standard formulas.
- The open price is smoothed using prior Heiken-Ashi values to maintain continuity.
2. Dynamic Support & Resistance (S/R) Detection
- Identifies "sandwich" Heiken-Ashi candles (specific bullish or bearish patterns).
- Plots dynamic support and resistance levels based on these key candles.
- Two sets of support/resistance lines are available:
- Primary Dynamic S/R (based on strong HA reversals).
- Companion Indicator Dynamic S/R (a secondary validation layer).
3. Customizable Visualization
- Infinite or right-extended support/resistance lines.
- Price labels at key levels (optional).
- Custom background color highlighting for detected S/R areas.
- Adjustable transparency settings for improved chart clarity.
4. Percentage Distance Calculation
- Calculates the percentage difference between detected support and resistance levels.
- Optionally displays distance tags for quick reference.
Important Notes:
- This is a leading indicator. It aims to highlight potential future support and resistance areas rather than reacting to past movements.
- Recommended for use on a candlestick chart. Using it on a other chart types may produce unintended results.
- No single indicator should be relied upon for trading decisions. Always use multiple forms of analysis and risk management strategies.
- Trading results are never guaranteed. Past performance does not predict future results, and all trading involves risk.
This indicator provides a structured view of market behavior using Heiken-Ashi principles, helping traders visualize potential support and resistance zones more effectively.
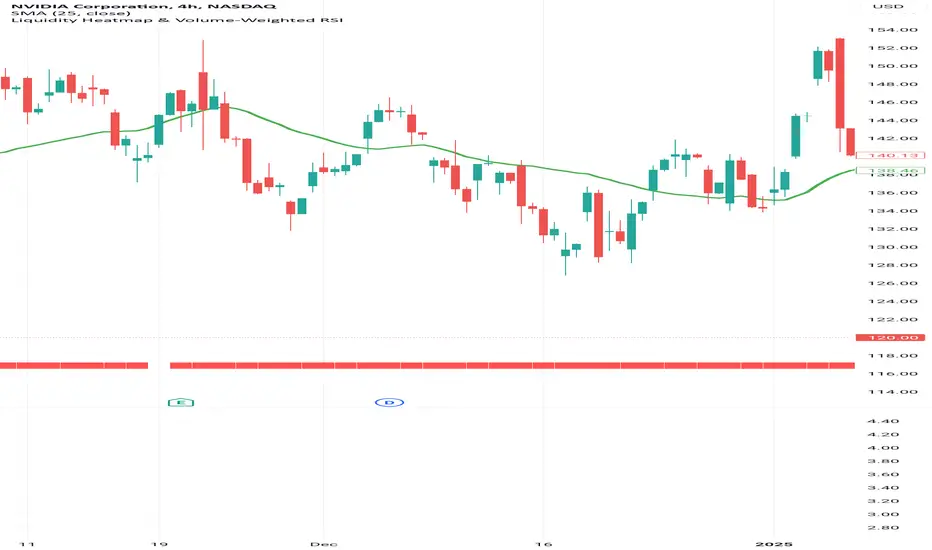
Liquidity Heatmap & Volume-Weighted RSILiquidity Heatmap Indicator with Volume-Weighted RSI
Description:
The Liquidity Heatmap Indicator with Volume-Weighted RSI (VW-RSI) is a powerful tool designed for traders to visualize market liquidity zones while integrating a volume-adjusted momentum oscillator. This indicator provides a dynamic heatmap of liquidity levels across various price points and enhances traditional RSI by incorporating volume weight, making it more responsive to market activity.
Key Features:
Liquidity Heatmap Visualization: Identifies high-liquidity price zones, allowing traders to spot potential areas of support, resistance, and accumulation.
Volume-Weighted RSI (VW-RSI): Enhances the RSI by factoring in trading volume, reducing false signals and improving trend confirmation.
Customizable Sensitivity: Users can adjust parameters to fine-tune heatmap intensity and RSI smoothing.
Dynamic Market Insights: Helps identify potential price reversals and trend strength by combining liquidity depth with momentum analysis.
How to Use:
1. Identify Liquidity Zones: The heatmap colors indicate areas of high and low liquidity, helping traders pinpoint key price action areas.
2. Use VW-RSI for Confirmation: When VW-RSI diverges from price near a liquidity cluster, it signals a potential reversal or continuation.
3. Adjust Parameters: Fine-tune the RSI period, volume weighting, and heatmap sensitivity to align with different trading strategies.
This indicator is ideal for traders who rely on order flow analysis, volume-based momentum strategies, and liquidity-driven trading techniques.
MomentumQ MS/OBMomentumQ MS/OB - Market Structure & Order Blocks Indicator
________________________________________
The MomentumQ MS/OB Indicator is a professional-grade tool designed to help traders analyze market structure, institutional order flow, and dynamic support/resistance levels.
Unlike traditional indicators, MomentumQ MS/OB leverages advanced liquidity analysis to identify key market zones, enabling traders to spot high-probability trade setups with institutional-grade precision.
A unique advantage of this indicator is its ability to generate more order blocks across all timeframes using a custom lookback setting. This feature enhances intraday order block creation, giving traders a clearer view of market liquidity shifts in lower timeframes while remaining effective in higher timeframes.
Additionally, the dynamic support and resistance plotting system automatically adjusts based on market structure, ensuring traders have a real-time, adaptive view of key price levels. Unlike static support/resistance indicators, these dynamic zones shift based on price action, helping traders identify breakouts, retests, and liquidity traps more accurately.
________________________________________
Key Features
1. Market Structure & Institutional Order Blocks
Detects institutional bullish and bearish order blocks, helping traders locate high-liquidity zones.
Real-time zone updates keep traders focused on the most relevant price levels.
Generates more order blocks in every timeframe, making it ideal for intraday and long-term trading strategies.
2. Smart Dynamic Support & Resistance Detection
Uses historical price action to identify high-impact support and resistance zones dynamically.
Updates automatically in response to price action, keeping traders focused on valid trading zones.
Helps traders anticipate breakouts, reversals, and liquidity traps in real time.
3. Institutional-Grade Price Action Analysis
Advanced algorithmic validation filters weak order blocks, ensuring only the strongest setups are displayed.
Customizable settings allow traders to adjust the indicator’s sensitivity based on their trading style.
4. Professional-Level Charting & Customization
Fully adjustable visuals – Traders can toggle features such as:
Bullish/Bearish Order Block Zones
Boundary Lines
Market Structure Levels
________________________________________
How It Works
Institutional Order Blocks
The indicator scans for swing highs/lows and detects liquidity zones based on institutional price movements.
Bullish Order Blocks indicate where institutions accumulated buy orders.
Bearish Order Blocks indicate where institutions placed aggressive sell orders.
The lookback setting enhances detection, allowing traders to see more order block formations across multiple timeframes.
Market Structure & Dynamic Support/Resistance
The algorithm continuously evaluates price action and key rejection levels, dynamically adjusting support and resistance zones.
Unlike traditional static support and resistance levels, these zones shift with real-time market conditions.
Helps traders determine trend direction and anticipate market reversals.
Order Block Validation
Only high-probability order blocks are displayed, eliminating weak signals and providing stronger trade opportunities.
The indicator produces more order blocks at lower timeframes, allowing for better intraday trade execution insights.
________________________________________
How to Use This Indicator
Confirm institutional trading areas by analyzing bullish and bearish order block zones.
Use dynamic support and resistance levels to identify high-probability trade zones for breakouts and reversals.
Adjust the lookback setting to control the frequency of order block detection, optimizing for intraday vs. long-term trading strategies.
Combine with price action strategies to validate trade entries and exits using breakouts, retests, and rejection signals.
This indicator works for all markets, including Forex, Stocks, Crypto, Futures, and Commodities.
Supports multiple timeframes, making it suitable for scalping, swing trading, and position trading.
________________________________________
Why Is This Indicator Valuable?
Unlike traditional indicators that only plot support/resistance or trend-based signals, MomentumQ MS/OB provides a complete institutional-grade trading system:
Advanced Order Block Detection – Not just generic support and resistance, but real institutional footprints.
Smart Market Structure Recognition – Tracks trend shifts before they happen.
Adjustable Lookback Feature – Generates more order blocks on lower timeframes for precise intraday trading.
Dynamic Support and Resistance Zones – Adapts in real-time, ensuring accurate trade setups.
Customizable and Professional-Grade – Suitable for traders looking for high-probability setups.
________________________________________
Example Trading Strategies
1. Order Block & Break of Structure (BoS) Confirmation
Wait for price to break structure near an institutional order block.
Enter on the first retest of the order block for a high-probability trade setup.
Set stop-loss behind the order block and target the next key level.
2. Using Dynamic Support & Resistance for Reversal Trades
If price reaches a dynamic resistance level, wait for bearish confirmation such as a rejection wick or engulfing candle.
Enter short with stop-loss above resistance and target the next dynamic support level.
Works for long trades at dynamic support levels as well.
________________________________________
Disclaimer
This indicator does not guarantee profits and should be used as part of a complete trading strategy. Past performance is not indicative of future results.

Onky's DikFat Supreme Supply and Demand
Onky's DikFat Supreme Supply and Demand (DFAT S&D)
This indicator identifies and marks potential Demand and Supply zones based on sharp price movements and volume spikes. It is designed to assist traders in recognizing areas where price could potentially reverse or move impulsively, based on the concept of supply and demand.
Key Features:
- Dynamic Demand and Supply Zones : The indicator uses historical price data and sharp price movements to detect areas where demand or supply may be concentrated. The zones are drawn as boxes on the chart for visual reference.
- Volume Spike Detection : The zones are only marked when a volume spike occurs, indicating increased market activity and potentially stronger support or resistance at those levels.
- Adjustable Parameters : Traders can adjust the Zone Size to control the lookback period for detecting supply and demand zones, and can fine-tune the Volume Multiplier to control the sensitivity of volume spikes.
- Alerts : Alerts are available for both Demand and Supply zones when they are detected, allowing traders to be notified when price enters or reacts to these areas.
How Traders Use Supply and Demand Zones:
Supply and Demand Theory suggests that prices often move in response to the balance between the amount of supply (selling pressure) and demand (buying pressure) at specific price levels. When demand exceeds supply, prices tend to rise, and when supply exceeds demand, prices tend to fall.
1. Demand Zones : These are areas where price has previously fallen to a low point and buyers have stepped in, pushing prices higher. Traders may view these zones as potential areas for price to reverse upward again.
2. Supply Zones : These are areas where price has risen to a high point and sellers have stepped in, pushing prices lower. Traders may see these zones as potential areas for price to reverse downward again.
Traders use these zones to identify potential entry points (for buying in demand zones or selling in supply zones) and exit points (if price reaches these zones in the future). The volume spike further validates the strength of these zones, as it indicates heightened market interest at those levels.
This indicator offers a flexible, visual way to identify and act upon these market dynamics. It is neutral and does not guarantee any specific outcomes, but it may assist traders in recognizing important price levels where price action could change.
Disclaimer:
This indicator is provided for informational purposes only. It is not intended to be trading advice or a recommendation to buy or sell any financial instruments. Trading involves risk, and the use of this tool does not guarantee any specific results or profits. Past performance is not indicative of future results. Users are responsible for their own decisions and should seek independent financial advice before making any investment decisions.

Price Imbalance as Consecutive Levels of AveragesOverview
The Price Imbalance as Consecutive Levels of Averages indicator is an advanced technical analysis tool designed to identify and visualize price imbalances in financial markets. Unlike traditional moving average (MA) indicators that update continuously with each new price bar, this indicator employs moving averages calculated over consecutive, non-overlapping historical windows. This unique approach leverages comparative historical data to provide deeper insights into trend strength and potential reversals, offering traders a more nuanced understanding of market dynamics and reducing the likelihood of false signals or fakeouts.
Key Features
Consecutive Rolling Moving Averages: Utilizes three distinct simple moving averages (SMAs) calculated over consecutive, non-overlapping windows to capture different historical segments of price data.
Dynamic Color-Coded Visualization: SMA lines change color and style based on the relationship between the averages, highlighting both extreme and normal market conditions.
Median and Secondary Median Lines: Provides additional layers of price distribution insight during normal trend conditions through the plotting of primary and secondary median lines.
Fakeout Prevention: Filters out short-term volatility and sharp price movements by requiring consistent historical alignment of multiple moving averages.
Customizable Parameters: Offers flexibility to adjust SMA window lengths and line extensions to align with various trading strategies and timeframes.
Real-Time Updates with Historical Context: Continuously recalculates and updates SMA lines based on comparative historical windows, ensuring that the indicator reflects both current and past market conditions.
Inputs & Settings
Rolling Window Lengths:
Window 1 Length (Most Recent) Bars: Number of bars used to calculate the most recent SMA. (Default: 5, Range: 2–300)
Window 2 Length (Preceding) Bars: Number of bars for the second SMA, shifted by Window 1. (Default: 8, Range: 2–300)
Window 3 Length (Third Rolling) Bars: Number of bars for the third SMA, shifted by the combined lengths of Window 1 and Window 2. (Default: 13, Range: 2–300)
Horizontal Line Extension:
Horizontal Line Extension (Bars): Determines how far each SMA line extends horizontally on the chart. (Default: 10 bars, Range: 1–100)
Functionality and Theory
1. Calculating Consecutive Simple Moving Averages (SMAs):
The indicator calculates three SMAs, each based on distinct and consecutive historical windows of price data. This approach contrasts with traditional MAs that continuously update with each new price bar, offering a static view of past trends rather than an ongoing one.
Mean1 (SMA1): Calculated over the most recent Window 1 Length bars. Represents the short-term trend.
Mean1=∑i=1N1CloseiN1
Mean1=N1∑i=1N1Closei
Where N1N1 is the length of Window 1.
Mean2 (SMA2): Calculated over the preceding Window 2 Length bars, shifted back by Window 1 Length bars. Represents the medium-term trend.
\text{Mean2} = \frac{\sum_{i=1}^{N_2} \text{Close}_{i + N_1}}}{N_2}
Where N2N2 is the length of Window 2.
Mean3 (SMA3): Calculated over the third rolling Window 3 Length bars, shifted back by the combined lengths of Window 1 and Window 2 bars. Represents the long-term trend.
\text{Mean3} = \frac{\sum_{i=1}^{N_3} \text{Close}_{i + N_1 + N_2}}}{N_3}
Where N3N3 is the length of Window 3.
2. Determining Market Conditions:
The relationship between the three SMAs categorizes the market condition into either extreme or normal states, enabling traders to quickly assess trend strength and potential reversals.
Extreme Bullish:
Mean3Mean2>Mean1
Mean3>Mean2>Mean1
Indicates a strong and sustained downward trend. SMA lines are colored purple and styled as dashed lines.
Normal Bullish:
Mean1>Mean2andnot in extreme bullish condition
Mean1>Mean2andnot in extreme bullish condition
Indicates a standard upward trend. SMA lines are colored green and styled as solid lines.
Normal Bearish:
Mean1Mean2>Mean1
Mean3>Mean2>Mean1
Normal Bullish:
Mean1>Mean2andnot in Extreme Bullish
Mean1>Mean2andnot in Extreme Bullish
Normal Bearish:
Mean1 Mean2 > Mean3
Visualization: All three SMAs are displayed as gold dashed lines.
Median Lines: Not displayed to maintain chart clarity.
Interpretation: Indicates a strong and sustained upward trend. Traders may consider entering long positions, confident in the trend's strength without the distraction of additional lines.
2. Normal Bullish Condition:
SMAs Alignment: Mean1 > Mean2 (not in extreme condition)
Visualization: Mean1 and Mean2 are green solid lines; Mean3 is gray.
Median Lines: A thin blue dotted median line is plotted between Mean1 and Mean2, with two additional thin blue dashed lines as secondary medians.
Interpretation: Confirms an upward trend while providing deeper insights into price distribution. Traders can use the median and secondary median lines to identify optimal entry points and manage risk more effectively.
3. Extreme Bearish Condition:
SMAs Alignment: Mean3 > Mean2 > Mean1
Visualization: All three SMAs are displayed as purple dashed lines.
Median Lines: Not displayed to maintain chart clarity.
Interpretation: Indicates a strong and sustained downward trend. Traders may consider entering short positions, confident in the trend's strength without the distraction of additional lines.
4. Normal Bearish Condition:
SMAs Alignment: Mean1 < Mean2 (not in extreme condition)
Visualization: Mean1 and Mean2 are red solid lines; Mean3 is gray.
Median Lines: A thin blue dotted median line is plotted between Mean1 and Mean2, with two additional thin blue dashed lines as secondary medians.
Interpretation: Confirms a downward trend while providing deeper insights into price distribution. Traders can use the median and secondary median lines to identify optimal entry points and manage risk more effectively.
Customization and Flexibility
The Price Imbalance as Consecutive Levels of Averages indicator is highly adaptable, allowing traders to tailor it to their specific trading styles and market conditions through adjustable parameters:
SMA Window Lengths: Modify the lengths of Window 1, Window 2, and Window 3 to capture different historical trend segments, whether focusing on short-term fluctuations or long-term movements.
Line Extension: Adjust the horizontal extension of SMA and median lines to align with different trading horizons and chart preferences.
Color and Style Preferences: While default colors and styles are optimized for clarity, traders can customize these elements to match their personal chart aesthetics and enhance visual differentiation.
This flexibility ensures that the indicator remains versatile and applicable across various markets, asset classes, and trading strategies, providing valuable insights tailored to individual trading needs.
Conclusion
The Price Imbalance as Consecutive Levels of Averages indicator offers a comprehensive and innovative approach to analyzing price trends and imbalances within financial markets. By utilizing three consecutive, non-overlapping SMAs and incorporating median lines during normal trend conditions, the indicator provides clear and actionable insights into trend strength and price distribution. Its unique design leverages comparative historical data, distinguishing it from traditional moving averages and enhancing its utility in identifying genuine market movements while minimizing false signals. This dynamic and customizable tool empowers traders to refine their technical analysis, optimize their trading strategies, and navigate the markets with greater confidence and precision.

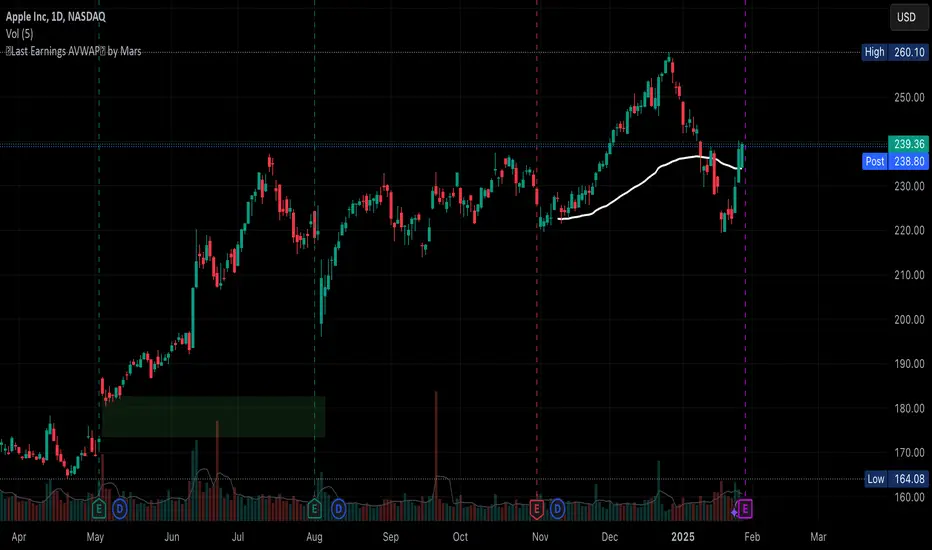
Auto Last Earnings AVWAP
This script provides an automated approach to tracking critical post-earnings price levels. You can add it to a chart and then flip through your watchlist to see the anchored AVWAPs without the need to do it manually one by one.
Core Features:
Automatically detects earnings dates and anchors VWAP calculations without manual input
Calculates volume-weighted average price specifically from the last earnings release
Identifies and visualizes significant earnings gaps between reporting periods
Volume-Based Signal Detection:
Monitors VWAP crosses with volume confirmation (requires 1.5x normal volume)
Labels high-volume breakouts with clear directional signals
Uses a 6-bar adaptive volume baseline to filter out noise
Practical Applications:
AVWAP anchored at earnings offers a great price support level that should be considered when deciding to buy/sell the stock. This script eliminates manual VWAP anchoring and reduces chart management time
Key Differentiators:
First note: coding VWAP anchoring in pine is more challenging that one would think. The source code is open to help other users and hopefully inspire different applications.
No need to manually anchor the VWAP
Draws earnings gap from earnings to earnings (if auto mode)
Detects breakouts through the AVWAP line
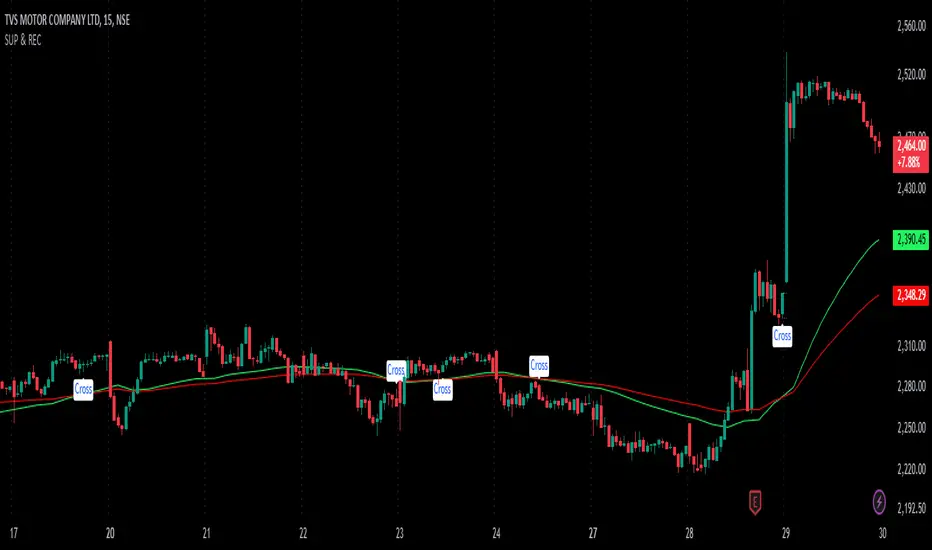
SUP & RECIdentifying Support and Resistance: An indicator (likely visual) highlights areas on a price chart where the asset's price has historically struggled to break through. These are crucial levels to watch for potential price reversals.