Checklist Fred - Ultimate Pro V6.6
🇬🇧 ENGLISH VERSION (Complete Guide)
Fred’s Checklist - Ultimate Pro V6.2
1. The Philosophy: "Quality at a Fair Price"
This indicator is not a "miracle" signal generator. It is a multi-criteria scoring system that merges the three pillars of investing: Financial Health, Valuation, and Technical Timing.
The goal is simple: To select only exceptional companies that are "taking a breather" (moderate RSI) before a potential trend resumption.
2. How the 10 Criteria Work (The Score)
Each criterion is worth 1 point. A score of 8/10 or higher indicates a favorable statistical alignment.
I. Fundamental Pillar (Quality)
Revenue/EPS Growth: Proof that the company is gaining market share and generating increasing profits.
Net Margin: Filters for profitability. Companies that retain a significant portion of their revenue are more resilient.
ROE (Return on Equity): Measures management's efficiency at generating profits from shareholders’ equity.
Debt/Equity: Ensures the company is not over-leveraged relative to its own capital.
Free Cash Flow (FCF): The company must generate "hard cash" and not just accounting profits.
II. Valuation Pillar (Price)
P/E vs. Index: The script compares the stock's P/E ratio to its market average (S&P 500, NASDAQ, or TSX). This prevents "overpaying" for a stock relative to its peers.
III. Technical Pillar (Timing)
SMA 50 & 200: The price must be above these moving averages to confirm a healthy long-term uptrend.
RSI : This is the "Comfort Zone." We look for stocks that are neither overheating (RSI > 70) nor in a freefall (RSI < 30).
3. Customizable Settings (The Gear Icon)
The tool is fully customizable via the settings panel to suit different investor profiles:
Threshold Adjustments: Modify minimum Margins or ROE targets based on sector requirements.
RSI Zones: Expand or narrow the entry window (e.g., 40-60) depending on your risk tolerance.
Index Updates: Manually enter the current average P/E for the S&P 500, Nasdaq, and TSX. The script automatically detects the stock's origin.
4. Market Context Behavior
Market State Indicator Impact Pro Tip
Bull Market Many stocks will hit 8/10 or 9/10. Be highly selective; aim for 10/10 to avoid "bubble" valuations.
Bear Market Scores drop (often < 5/10). The indicator keeps you safely on the sidelines.
Sideways (Range) RSI becomes the key factor. Look for a return to the 35-55 zone paired with strong FCF.
5. How to Read the Results
10/10 (Green): Rare. Signals a total alignment of all stars.
7/10 to 9/10 (Orange/Green): Interest Zone. Identify the missing point (often a "N/A" data point or an RSI slightly out of range).
Below 7/10: Too many compromises. It is usually better to move on to the next ticker.
Disclaimer: This indicator is for educational and informational purposes only and does not constitute financial advice. Trading involves significant risk of loss. Past performance is not indicative of future results. Always perform your own due diligence before making any investment decision.
____________________________________________________________________________________________________________________________________________________________________
Statistics

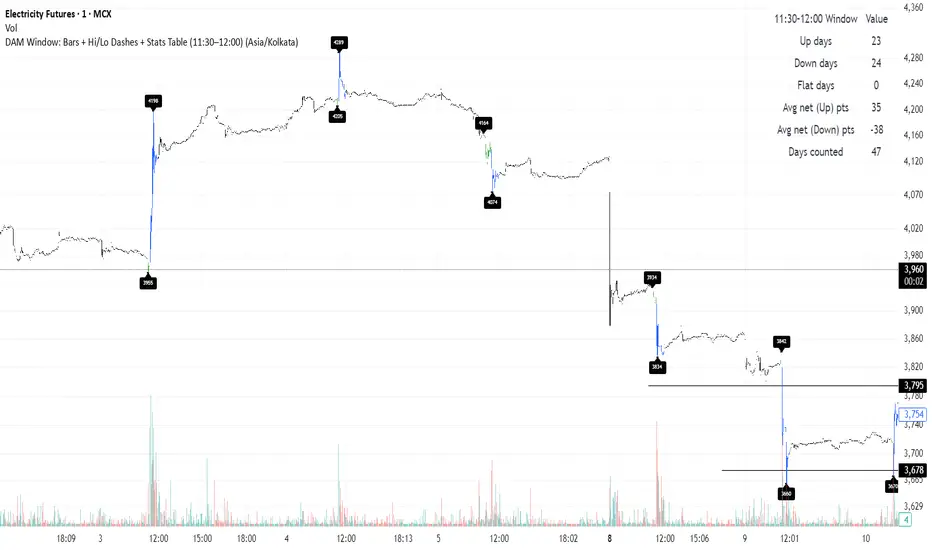
Electricity Futures x DAM Window TrackingWhat this one script does
Tracks the OHLC during 11:30–12:00 window per day
Colors bars
11:30–11:45 → Green
11:45–12:00 → Blue
Draws
A horizontal dash at the High and at the Low along with price labels.
Displays a table
Up days - count of days when prices went up post event
Down days - count of days when prices went down post event
Flat days
Avg net change (points) on up days - average of net change on up days
Avg net change (points) on down days - average of net change on down days
Works on 1m / 5m / 15m charts only.
Strategy Scanner (H4 Trend)
Here is a trend-following strategy I coded for the H4: it first filters the overall direction via the EMA 200, waits for a precise price correction in the recharge zone (between EMA 13 and 32), and only validates the entry if the Stoch RSI confirms an extreme extension (< 10 or > 90) to maximize the chances of a rebound.
aza
@aza 92i

[iQ]PRO Quantum MMXM Matrix Oscillator+++1. PRO Quantum MMXM Probability Matrix+++
2. Summary
This advanced market analysis engine combines fractal geometry with institutional liquidity models to decode complex market structure in real-time. Designed for precision traders, it utilizes a probabilistic state machine to forecast market regimes, distinguishing between accumulation, manipulation, and genuine trend expansion.
3. How It Works
The script operates on a "Theoretical Physics" approach to market data, treating price action as a dynamic system shifting between various energy states.
Probabilistic Regime Detection: Instead of relying solely on lagging price crosses, the core engine utilizes a Markov Chain model. This analyzes the probability of the market transitioning from one state (e.g., Consolidation) to another (e.g., Expansion) based on historical sequence learning.
Fractal Momentum weighting: The oscillator employs a "Quantum" momentum calculation. It weights price velocity against the market's "roughness" (using Hurst Exponent logic). This filters out low-quality volatility, ensuring that only statistically significant moves drive the signal.
Institutional Liquidity (MMXM) Curve: This component calculates the density of buying versus selling pressure relative to a dynamic equilibrium. It aims to identify "Manipulation" zones where price is artificially extended away from fair value to engineer liquidity.
Entropy & Confidence: The system measures the "disorder" of the current trend. Low entropy indicates a high-confidence, organized trend, while high entropy warns of chaotic, low-probability conditions.
4. Key Features
8-State Market Classification: Automatically detects phases including Consolidation, Manipulation, Expansion, and Distribution.
MMXM Liquidity Curve: Visualizes potential "Smart Money" reversal points and liquidity runs.
Multi-Timeframe Alignment: An on-chart dashboard displaying structural alignment across Daily, 4-Hour, and current timeframes.
Probability Density Field: Dynamic background coloring that intensifies based on the statistical confidence of the current directional bias.
Live Probability Heatmap: A real-time data table showing the percentage likelihood of the next market state.
5. How to Use
Step 1: Assess Directional Bias Check the "Probability Field" background color and the Quantum Metrics panel. A bright Green background indicates high-confidence bullish probability; Red indicates bearish.
Step 2: Confirm Structure (MTF) Consult the top-left Alignment Table. Ideal high-probability entries occur when the "HTF" (Higher Timeframe) and "MTF" (Medium Timeframe) states align in color/direction.
Step 3: Identify the Setup
Reversals: Look for the Oscillator or Price to hit the Deviation Targets (dotted lines). These represent statistically overextended zones (Fractal Deviation).
Trend Continuation: Wait for the "State" to switch from "Manipulation" to "Expansion" while the MMXM Curve crosses the equilibrium (zero) line.
Step 4: Risk Management Use the "Confidence" metric in the bottom panel. If Confidence drops below 50%, reduce position sizing or tighten stops, as the market is entering a chaotic state.
6. Settings & Configuration
Quantum Field Config: Customizes the specific timeframes used for the Multi-Timeframe alignment (HTF1, HTF2, MTF).
Fractal Parameters: Adjust the Hurst Exponent and Fractal Dimension to tune how the script filters noise versus trend.
MMXM Settings: Toggle the sensitivity of the liquidity curve and choose the equilibrium reference (VWAP, EMA, or Session Open).
Visualization: Individual toggles to show/hide the Oscillator, Probability Field, Heatmaps, and Deviation lines to keep your chart clean.
Access & Proprietary Terms
This is a Closed-Source, Invite-Only proprietary tool. The underlying algorithms are obfuscated to protect the integrity of the PRO methodology and its private user base.
Computational Optimization: Engineered for high-frequency data processing with minimal terminal lag.
Membership: Access is strictly reserved for private members.
Disclaimer: Trading involves significant risk. The PRO Matrix is an advanced analytical tool and does not guarantee profits. Past performance within the probability engine is not necessarily indicative of future results.

Print Bar DataThis script print out the recent bar data. You can configure the position, bar numbers, of the data

Session Opening Bar RangeSession Opening Bar Range (OBR) - Advanced Opening Range Indicator with Statistical Analysis
Overview
The Session First Bar Range (FBR) indicator is a comprehensive tool that captures and projects key levels based on the first bar of a user-defined trading session. Unlike traditional daily opening range indicators, this script allows traders to focus on specific session windows (New York RTH, London, Asia, etc.) and analyze price behavior relative to the initial momentum established in that session's opening bar.
What makes this indicator unique is its combination of three distinct projection methodologies: statistical analysis based on historical range data, Fibonacci extensions, and fixed-point rotation levels commonly used by institutional traders. To our knowledge, this is the only opening range indicator that incorporates statistical standard deviation levels calculated from historical first bar ranges, making it both a technical and probabilistic tool.
Core Concept
The opening range concept is based on the principle that the initial price action of a trading session often sets the tone for the remainder of that session.
Professional traders have long observed that:
The first bar's high and low act as key reference points
Price often respects or breaks these levels with significance
Expansion beyond the opening range tends to occur in measurable increments
This indicator takes these observations and enhances them with:
Historical probability analysis - "Based on the last 60 sessions, price typically extends X standard deviations beyond the opening range"
Proportional projections - Fibonacci-based extensions showing where measured moves typically target
Fixed-point rotations - Institutional rotation levels (e.g., 65 points for NQ, 15 points for ES)
How It Works
Session Detection & First Bar Capture
The indicator uses Pine Script's time() function with timezone support to precisely detect when a trading session begins. When the first bar of the selected timeframe occurs within the session window, the script captures:
High (H): The high of the first bar
Low (L): The low of the first bar
Mid (M): The midpoint (hl2) of the first bar
Critical Detail: These levels are fixed from the first bar only - they do not update as the session progresses. This differs from many "opening range" indicators that use a time period (e.g., first 30 minutes). Here, you select the bar timeframe (default 5-minute), and only that single first bar's range is captured.
Statistical Level Calculation
The indicator maintains a rolling array of the last N session's first bar ranges (default: 60 sessions). For each new session, it calculates:
Average Range: Mean of historical first bar ranges
Standard Deviation: Volatility of those ranges
Projection Levels: High/Low ± (Average Range + Std Dev × Multiplier)
This provides probability-based levels. For example, a +2σ level suggests: "Historically, price extending this far beyond the opening range is a 2-standard-deviation event (approximately 95th percentile)."
Fibonacci Extensions
Using the first bar range as the base unit (100%), the indicator projects Fibonacci levels:
100% extension: One full range above the high / below the low
1.618x extension: (Default) Golden ratio projection
2.618x, 3.618x extensions: Additional Fibonacci levels
Calculation: Range = H - L, then Target = H + (Range × Multiplier) for upside projections.
OR Rotation Levels
These are fixed-point increments from the first bar's high and low. Unlike percentage-based methods, rotations use absolute point values:
NQ traders often use 65-point increments
ES traders often use 15-point increments
Gold/bonds use different values
The indicator draws 5 levels above the high (R+1 through R+5) and 5 below the low (R-1 through R-5), each separated by your specified point increment.
Features:
Session Options
Pre-configured Sessions:
New York RTH (9:30am - 4:00pm)
New York Futures (8:00am - 5:00pm)
London (2:00am - 8:00am)
Asia (7:00pm - 2:00am)
Midnight to 5pm
ZB/Gold/Silver OR (8:20am - 4:00pm)
CL OR (9:00am - 4:00pm)
Custom Session: Define your own start/end times in HHMM format
Timezone Support: All sessions respect the selected timezone (default: America/New_York)
Customizable Timeframe
Select any timeframe for the first bar (1min, 5min, 15min, etc.)
Default: 5-minute bars
Important: This is the timeframe for the first bar capture, independent of your chart's timeframe
Display Options
Historical Ranges: Show/hide past session ranges (with configurable limit to manage performance)
Line Styles: Choose between Solid, Dashed, or Dotted for range lines and midline
Label Position: Left or Right side of range
Show Prices: Optionally display actual price values on labels
Custom Colors: Fully customizable colors for all components
Statistical Levels
Lookback Period: Number of historical sessions to analyze (default: 60)
Two Multiplier Levels: Default 1σ and 2σ, fully adjustable
Separate styling: Different line styles (dashed vs dotted) for each sigma level
Optional Labels: Show/hide sigma notation labels
Fibonacci Extensions
Four Extension Levels: 100%, 1.618x, 2.618x, 3.618x (all customizable)
Bidirectional: Projections both above and below the opening range
Optional Labels: Toggle percentage/multiplier labels
OR Rotation Levels
Configurable Increment: Set the point value for your instrument
Five Levels Each Direction: R±1 through R±5
Dynamic Labels: Show both rotation number and point value (e.g., "R+1 (65)")
Three Line Styles: Solid, Dashed, or Dotted
How to Use
Setup
Add the indicator to your chart
Select your trading session from the dropdown
Set the timeframe for first bar capture (typically 5-15 minutes)
Configure which projection methods you want to see (Statistical, Fibonacci, and/or Rotations)
For Day Traders
Scenario: Trading NQ during New York RTH
Session: Select "New York RTH (9:30am - 4:00pm)"
Timeframe: 5-minute (captures 9:30-9:35 bar)
Enable: OR Rotations with 65-point increments
Strategy:
Watch for acceptance/rejection at rotation levels
Use R+1/R-1 as initial profit targets
R+2/R-2 as extended targets
Statistical levels show when price is in "outlier" territory
and rotation levels
Performance Notes
The indicator limits objects to stay within TradingView's constraints (500 max)
If you enable all features, reduce "Maximum Historical Ranges" to prevent slowdown
Typical configuration: 10-20 historical ranges with all features enabled works well
Settings Guide
Session Settings
Session: Choose from pre-configured sessions or "Custom"
Custom Session Start/End: HHMM format (e.g., "0930" for 9:30am)
Timezone: Critical for accurate session detection
Opening Bar Format
Timeframe: The bar size for capturing the first bar's range
Show Midline: Toggle the mid-point line
Show Historical Ranges: Display previous sessions (recommended: leave ON)
Maximum Historical Ranges: Limit history to manage performance (1-500)
Range Style / MidLine Style: Solid, Dashed, or Dotted
Position: Label placement (Left or Right)
Show Prices: Include actual price values on labels
Statistical Levels
Lookback Periods: How many historical first bar ranges to analyze (default: 60)
Std Dev Multiplier 1/2: The sigma levels to project (default: 1.0 and 2.0)
All visual settings (colors, line width, label size)
Fibonacci Extensions
Show Fib Extensions: Enable/disable Fibonacci projections
Measured Move Extensions 1-4: The multipliers (default: 1.618, 2.618, 3.618, 4.618)
Visual customization options
OR Rotations
Rotation Increment: The point value for your instrument
NQ: 65 points
ES: 15 points
Adjust for other instruments based on their typical rotation behavior
Show Rotation Labels: Display level numbers and point values
Visual customization options
Use Cases
Gap Trading: When price gaps away from previous day's close, the first bar range shows the initial gap acceptance/rejection zone
Breakout Confirmation: Price breaking and holding above the first bar high with volume suggests trend day potential. Rotation levels provide measured targets.
Reversal Identification: Price reaching +2σ statistical level = rare event, potential exhaustion
Range Bound Days: Price oscillating between first bar high/low suggests range-bound session; trade reversals at extremes
Institutional Level Awareness: OR Rotations at 65 points (NQ) align with levels professional traders watch
Technical Notes
The indicator uses request.security() with lookahead=barmerge.lookahead_on to ensure the first bar levels are captured correctly
All drawing objects (lines, labels, fills) are managed in arrays with automatic cleanup to prevent memory issues
The statistical calculations use array.avg() and array.stdev() for accurate probability estimates
Rotation levels use individual line variables (like Fibonacci) rather than loops for reliability
Summary
This indicator is original in its combination of three distinct methodologies for projecting levels from a session's opening range:
Statistical Analysis - No other opening range indicator (to our knowledge) calculates standard deviation projections from historical first bar ranges
Time-Based Session Flexibility - Most OR indicators use only daily or fixed time periods; this allows any custom session window
Multiple Projection Methods - Traders can use statistical, Fibonacci, AND rotation levels together or separately

High/Low Tracker ARDR/ADR V4High and lows in 2 timeframes
16:00 -> 03:55
19:30 -> 02:55
Toggle on/off of
- Auto extending untill 09:25
- Live updating during price action
Configure linestyles, box styles
It is now displaying correctly for both CL and ES

NexTrade Concept NTC Strategy v3.3 BTCNexTrade Concept NTC – Strategy v3.2 BTC
NexTrade Concept NTC – Strategy v3.2 BTC is a rule-based trading strategy developed for educational and analytical purposes, focused on BTC market behavior under structured, volatility-aware conditions.
This strategy is not a signal service and does not guarantee profitability. Its objective is to provide a systematic framework to study how market structure, volatility regimes, and risk-defined execution interact in Bitcoin environments.
Core Concept
The strategy is built around clean structural logic, prioritizing:
Directional bias via recent market structure (BOS / CHoCH logic)
Volatility filtering to avoid low-quality conditions
Risk-controlled execution using ATR-based stop validation
Premium / Discount contextual positioning
Displacement confirmation to avoid weak price movement
All entries are generated only when multiple independent conditions align, reducing noise and over-trading.
Key Components
Market Structure
Swing-based structure detection
Trend direction tracking
Recency filter to avoid outdated breaks
Volatility Regime Control
ATR mean comparison
Optional blocking of low-volatility environments
Cooldown system after position exits
Displacement Validation
Optional requirement of real price expansion
Body-to-ATR proportional confirmation
Risk & Execution Logic
Fixed percentage risk per trade
Dynamic position sizing based on stop distance
Predefined Risk-to-Reward framework
One-position-at-a-time logic (no pyramiding)
Important Notes
This script is intended for backtesting, research, and learning purposes only.
It does not provide financial advice.
Performance results depend on market conditions, execution settings, and user configuration.
Always validate any strategy in a simulated environment before considering real-world use.
Recommended Use
BTC-focused analysis
Intraday to swing timeframes
Study of volatility-adjusted structure-based trading
Strategy optimization and parameter research

Dynamic EMA Trend Table [Customizable]Overview
The Dynamic EMA Trend Table is a comprehensive dashboard designed to give traders an instant overview of the market trend across five distinct Exponential Moving Averages (EMAs). Instead of cluttering your chart with multiple lines, this script organizes the data into a clean, customizable table, allowing you to assess trend alignment at a glance.
How It Works
This indicator calculates five user-defined EMAs (defaulting to the popular 5, 20, 50, 100, and 200 periods). It then compares the Current Price against each EMA value to determine the immediate trend status:
Bullish State: When the current price is above the specific EMA, the table cell turns Green (customizable).
Bearish State: When the current price is below the specific EMA, the table cell turns Red (customizable).
This logic allows swing traders and scalpers to instantly see if the asset is in a strong uptrend (all cells Green), a strong downtrend (all cells Red), or a consolidation phase (mixed colors).
Key Features
Fully Customizable Periods: Change the length of all 5 EMAs to fit your specific strategy (e.g., Fibonacci numbers or standard Swing Trading settings).
Dynamic UI: Position the table anywhere on the screen (Top/Bottom/Left/Right) and adjust the size to fit your screen resolution.
Visual Cleanliness: You can choose to show the table only, or toggle the "Show EMAs on Chart" option to plot the actual lines on your chart.
Smart Coloring: The lines on the chart (if enabled) inherit the same color logic as the table—turning Green when price is above them and Red when price is below.
Settings & Configuration
Price Source: Select Close, High, Low, etc. (Default is Close).
Table Position & Size: Customize where the dashboard appears.
EMA Lengths: Set your 5 preferred lookback periods.
Color Theme: Fully adjustable colors for Bullish, Bearish, Neutral, and Background elements to match your chart theme (Dark/Light mode friendly).
Use Case Example
Trend Confirmation: A trader looking for a "Buy" entry might wait for the short-term EMAs (5 and 20) and the medium-term EMA (50) to all turn Green in the table before entering.
Support/Resistance Watch: By quickly glancing at the values in the table, you can see exactly where the 200 EMA sits without needing to scroll back on your chart to find the line.

Universal Moving Average🙏🏻 UMA (Universal Moving Average) represents the most natural and prolly ‘the’ final general universal entity for calculating rolling typical value for any type of time-series. Simply via different weighting schemes applied together, it encodes:
Location of each datapoint in corresponding fields (price, time, volume)
Informational relevance of each datapoint via using windowing functions that are fundamental in nature and go beyond DSP inventions & approximations
Innovation in state space (in our case = volatility)
The real beauty of this development: being simply a weighting scheme that can be applied to anything: be it weighted median , weighted quantile regression, or weighted KDE , or a simple weighted mean (like in this script). As long as a method accepts weights, you can harness the power of this entity. It means that final algorithmic complexity will match your initial tool.
As a moving ‘average’ it beats ALMA, KAMA, MAMA, VIDYA and all others because it is a simple and general entity, and all it does is encoding ‘all’ available information. I think that post might anger a lot of people, because lotta things will be realized as legacy and many paywalls gonna be ignored, specially for the followers of DSP cult, the ones who yet don’t understand that aggregated tick data is not a signal omg, it’s a completely different type of time series where your methods simply don’t fit even closely. I am also sorry to inform y’all, that spectral analysis is much closer to state-space methods in spirit than to DSP. But in fact DSP is cool and I love it, well for actual signals xD
...
Weights explained & how to use them: as I already said, the whole thing is based on combining different set of weights, and you can turn them on/off in script settings. Btw I've set em up defaults so you can use the thing on price data out of the box right away.
Price, Time, Volume weights: encode location of every datapoint in Price & TIme & Volume field
Howtouse: u have to disable one weight that corresponds to the field you apply UMA to. E.g if you apply UMA to prices, you turn off price weighting And turn on time and volume weighting. Or if you apply UMA to volume delta, you turn off volume weighting And turn on price and time weighting.
Higher prices are more important, this asymmetry is confirmed and even proved by the fact that prices can’t be negative (don’t even mention that incorrect rollover on CL contract in 2k20...).
Signal weights: encode actuality/importance/relevance of datapoints.
Howtouse: in DSP terms, it provides smoothing, but also compensates for the lag it introduces. This smoothness is useful if you use slope reversals for signal generation aka watching peaks and valleys in a moving average shape. It's also better to perturb smoothed outputs with this , this way you inject high freq content back, But in controlled way!
Signal = information.
The fundamental universal entity behind so-called “smoothing” in DSP has nothing to do with signals and goes eons beyond DSP. This is simply about measuring the relevance of data in time.
First, new datapoints need some time to be “embedded” into the timeline, you can think of it as time proof, kinda stuff needs time to be proved, accepted; while earliest datapoints lose relevance in time.
Second, along with the first notion, at the same time there’s the counter notion that simply weights new data more, acting as a counterweight from the down-weighting of the latest datapoints introduced by the first notion.
The first part can be represented as PDF of beta(2, 2) window (a set of weights in our case). It’s actually well known as the Welch window, that lives in between so called statistical and DSP worlds, emerges in multiple contexts. Mainstream DSP users tho mostly don’t use this one, they use primitive legacy windowing function, you can find all kinds on this wiki page.
Now the second part, where DSP adepts usually stop, is to introduce the second compensating windowing function. Instead they try to reduce window size, or introduce other kinds of volatility weights, do some tricks, but it ain’t provides obviously. The natural step here is to simply use the integral of the initial window; if the initial window is beta(2, 2) then what we simply need is CDF of beta(2, 2), in fact the vertically inverted shape of it aka survival function . That’s it bros. Simply as that.
When both of these are applied you have smth magical, your output becomes smooth and yet not lagging. No arbitrary windowing functions, tricks with data modification etc
Why beta(2, 2)? It naturally arises in many contexts, it’s based on one of the most fundamental functions in the universe: x^2. It has finite support. I can talk more bout it on request, but I am absolutely sure this is it.
^^ impulse response of the resulting weighs together (green) compared with uniform weights aka boxcar (red). Made with this script .
Weighing by state: encodes state-space innovation of each datapoint, basically magnitude of changes, strength of these changes, aka volatility.
Howtouse: this makes your moving average volatility aware in proper math ways. The influence of datapoints will be stronger when changes are stronger. This is weighting by innovations, or weighting by volatility by using squared returns.
Why squared returns? They encode state‑space innovations properly because the innovation of any continuous‑time semimartingale is about its quadratic variation, and quadratic variation is built from squared increments, not absolute increments.
Adaptive length is not the right way to introduce adaptivity by volatility xD. When you weight datapoints by squared returns you’re already dynamically varying ‘effective’ data size, you don’t need anything else.
...
It’s all good, progress happens, that’s how the Universe works, that's how Universal Moving Average works. Time to evolve. I might update other scripts with this complete weighting scheme, either by my own desire or your request.
...
∞

Seasonality Monthly v2.0-SanjayMonthly seasonality refers to recurring patterns or fluctuations in data that repeat every month due to predictable factors like weather, holidays, or business cycles. For example, retail sales often peak in December due to holiday shopping, while utility usage may rise in summer because of air conditioning. Identifying monthly seasonality helps businesses forecast demand, allocate resources, and plan operations more accurately.
Seasonality significantly impacts forecasting because it introduces predictable, recurring patterns into data that must be accounted for to improve accuracy. If seasonal effects—such as higher sales during holidays or increased energy demand in summer—are ignored, forecasts can be misleading, leading to overproduction or stockouts. Incorporating seasonality into models (e.g., using seasonal decomposition or SARIMA) helps capture these cyclical variations, ensuring that predictions reflect real-world trends rather than just overall averages.


NeuralFlow Forecast Levels - User InputsThis is a companion indicator that plots AI-adaptive market equilibrium and expansion mapping levels directly on the SPY chart.
NeuralFlow Forecast Levels are generated through a Artificial Intelligence framework trained to identify:
Where price is statistically inclined to re-balance
Where expansion zones historically exhaust rather than extend
This is structure mapping, not prediction.
......................................................................................
What the Bands Represent?
AI Equilibrium (white core)
Primary weekly balance zone where price is most likely to mean-revert.
Predictive Rails (aqua / purple)
High-confidence corridor of institutional flow containment.
Outer Zones (green / red)
Expansion limits where continuation historically begins to decay.
Extreme Zones (top / bottom)
Rare deviation envelope where auction completion is statistically favored.
.The engine updates only when underlying structure changes —
not when candles fluctuate intraday.
.................................................................................................................
Usage Context
These levels are contextual reference zones, not entry signals. They are designed to answer:
Where does price matter?
Where does continuation weaken?
Where does balance statistically reassert itself?
Risk Disclaimer
Educational and analytical use only. Not financial advice.

AI Market Weather Forecast ProAI Market Weather Forecast Pro - Advanced Trading Indicator
Overview
AI Market Weather Forecast Pro is an innovative multi-timeframe trading system that uses global meteorological metaphors to visualize market conditions. By analyzing dimensional latitude regions, it transforms complex market data into intuitive global weather forecasts and temperature readings, helping traders quickly assess market sentiment and trend strength.
Core Features
🌍 Global Weather System
- Temperature Scale: -51°C to +51°C market temperature readings
- Weather Classifications: 9 distinct weather conditions from Freezing Cold to Scorching Heat
- Multi-Latitude Analysis: 5 climate zones representing different regional AI parameters
- Dynamic Temperature Engine: AI-powered algorithm calculates market "temperature" in real-time
- Trend Direction Indicator: Clear bullish/bearish/neutral classification
🌡️ Temperature-Based Signals
Hot Weather (Bullish Conditions):
- 🌡️ Scorching (35°C+): Strong Bull - Extreme bullish conditions
- ☀️ Hot (25°C-35°C): Bullish - Strong upward momentum
- 🌤️ Sunny (15°C-25°C): Mild Bull - Moderate bullish trend
- ⛅ Partly Cloudy (5°C-15°C): Weak Bull - Light bullish bias
Neutral Weather:
- ☁️ Overcast (-5°C to 5°C): Neutral - Consolidation/ranging market
Cold Weather (Bearish Conditions):
- 🌧️ Light Rain (-15°C to -5°C): Weak Bear - Light bearish bias
- 🌨️ Sleet (-25°C to -15°C): Mild Bear - Moderate bearish trend
- ❄️ Blizzard (-35°C to -25°C): Bearish - Strong downward momentum
- 🧊 Freezing Cold (-35°C-): Strong Bear - Extreme bearish conditions
📊 Five Latitude Climate Zones
Detects market conditions across 5 distinct "latitude zones", each representing progressively longer timeframes:
Each zone displays real-time weather status: ☀️ Clear (bullish), ❄️ Snow (bearish), or ☁️ Cloudy (neutral)
🎨 Advanced Visualization
Color-Coded Background:
- Orange/Yellow spectrum for bullish temperatures
- Gray for neutral conditions
- Blue spectrum for bearish temperatures
- Intensity increases with temperature extremes
Smart Weather Labels:
- Emoji-based weather icons for instant recognition
- Temperature readings in degrees
- Auto-positioned to avoid chart clutter
- Updates dynamically with trend changes
Comprehensive Weather Panel:
- Current weather condition
- Market temperature (°C)
- Trend direction classification
- Real-time status of all 5 latitude zones
- Current price and percentage change
Configuration Options
Display Settings
- Panel Position: 9 position options (corners, edges, center)
- Show Weather Panel: Toggle weather information panel on/off
- Show Background Color: Toggle background coloring on/off
- Show Weather Labels: Toggle weather labels on/off
- Background Display Days: Control how many days of coloring to display (1-30 days)
Alert System
Pre-configured alerts include:
- Weather Warming: Alert when temperature rises above 15°C
- Weather Cooling: Alert when temperature falls below -15°C
- Strong Trend Change: Alert when trend shifts to "Strong Bull" or "Strong Bear"
Information Panel Metrics
Real-time display includes:
- Current Weather: Visual weather condition with emoji
- Market Temperature: Numerical temperature reading (°C)
- Trend Direction: Clear classification (Strong Bull/Bullish/Mild Bull/Weak Bull/Neutral/Weak Bear/Mild Bear/Bearish/Strong Bear)
- Latitude Status: Weather conditions across all 5 climate zones
- Price & Change: Current price and percentage change
How to Interpret
Temperature Readings
- Above +25°C: Strong bullish conditions, consider long positions
- +15°C to +25°C*: Moderate bullish, good for trend following
- +5°C to +15°C: Mild bullish, cautious long bias
- -5°C to +5°C*: Neutral range, wait for clarity or range trade
- -15°C to -5°C: Mild bearish, cautious short bias
- -25°C to -15°C: Moderate bearish, good for short positions
- Below -25°C: Strong bearish conditions, consider short positions
Best Practices
1. Temperature Extremes: Focus on temperatures above +25°C or below -25°C for clear signals
2. Temperature Trend: Watch for rising/falling temperature trends, not just absolute values
3. Combine with Barometer*: Use alongside AI Market Barometer Pro for comprehensive analysis
4. Background Color: Quick visual assessment of overall market climate
Recommended Timeframes
- Scalping: 1-minute charts
- *Day Trading: 5-minute, 15-minute charts
Technical Requirements
- TradingView Pro, Pro+, or Premium account (required for multi-timeframe functionality)
- Compatible with all markets: Forex, Crypto, Stocks, Indices, Commodities
- Works on all timeframes from 1-minute to Monthly
Disclaimer
This indicator is a tool to assist with trading decisions. Past performance does not guarantee future results. Trading involves substantial risk of loss. Always use proper risk management and never risk more than you can afford to lose. The AI algorithms and temperature calculations are based on historical price patterns and technical analysis, not predictive guarantees.
What Makes This Different?
Unlike traditional indicators, AI Market Weather Forecast Pro:
- ✅ Uses intuitive meteorological metaphors for instant comprehension
- ✅ Analyzes multiple timeframe combinations simultaneously
- ✅ Calculates dynamic market "temperature" readings
- ✅ Provides 5-zone latitude system for confirmation
- ✅ Offers clear visual weather classifications
- ✅ Features unique temperature-based trend strength measurement
- ✅ Complements AI Market Barometer Pro for complete market analysis
Transform complex multi-timeframe analysis into simple weather forecasts. Know the market climate before you trade.
Perfect Companion to AI Market Barometer Pro
When used together with AI Market Barometer Pro:
- Barometer provides directional signals with AI confidence scores
- Weather provides overall market climate and temperature readings
- Combined gives you both precise entry signals AND broader market context
- Result: More informed trading decisions with better timing
© 2024 AI Market Weather Forecast Pro. All rights reserved. Proprietary algorithms and methodologies protected.

NQ Hourly Retracements - 12y Stats with LevelsHour Stats with Levels - TradingView Indicator Description
IMPORTANT: NQ FUTURES ONLY
This indicator is specifically designed for and calibrated to NQ (Nasdaq-100 E-mini) futures only. The statistical data is derived exclusively from 13 years of NQ price action (2013-2025). Do not use this indicator on any other asset, ticker, or market as the statistics will not be applicable and may lead to incorrect trading decisions.
Overview
"Hour Stats with Levels" is a statistical analysis indicator that provides real-time probability-based insights into hourly price behavior patterns. The indicator combines historical pattern recognition with live price action to help traders anticipate potential sweep and reversal scenarios within each trading hour.
Originality and Core Concept
This indicator is based on a comprehensive statistical analysis of 12y years of 1-minute NQ futures data, examining a specific price pattern: when an hourly candle opens inside the previous hour's range. Unlike generic support/resistance indicators, this tool provides hour-specific, context-aware probabilities based on 30,000+ historical occurrences of this pattern.
The originality lies in three key areas:
Pattern-Specific Statistics: Rather than applying generic technical analysis, the indicator only activates when the current hour opens within the previous hour's range, providing relevant statistics for this exact scenario.
Context-Aware Probabilities: Statistics are differentiated based on whether the current hour opened above or below the previous hour's open, recognizing that bullish and bearish opening contexts produce different behavioral patterns.
Comprehensive Retracement Tracking: The indicator tracks four independent retracement levels after a sweep occurs, showing the probability of price returning to: the swept level itself (90+% probability), the 50% level, the current hour's open, and the opposite extreme.
How It Works
The Core Pattern
The indicator monitors a specific price structure:
Setup Condition: The current hourly candle opens inside (between) the previous hour's high and low
Sweep Event: Price then breaks above the previous high (high sweep) or below the previous low (low sweep)
Retracement Analysis: After a sweep, the indicator tracks whether price retraces to key levels
Statistical Foundation
The underlying analysis processed 1-minute bar data from 2013-2025, identifying every instance where an hourly candle opened inside the previous hour's range. For each occurrence, the system tracked:
Whether the high, low, or both were swept during that hour
The distance of the sweep measured as a percentage of the previous hour's range
Whether price retraced to four key levels: the swept level, the 50% point, the current open, and the opposite extreme
These measurements were aggregated for all 24 hours of the trading day, with separate statistics for bullish contexts (opening above previous open) and bearish contexts (opening below previous open), creating 48 unique statistical profiles.
Sweep Distance Percentiles
The "reversal levels" are drawn based on historical sweep distance distributions:
25th Percentile: 75% of historical sweeps were larger than this distance. This represents a conservative reversal zone where smaller, contained sweeps typically reverse.
Median (50th Percentile): The midpoint of all historical sweep distances. Half of all sweeps reversed before reaching this level, half extended beyond it.
75th Percentile: Only 25% of sweeps extended beyond this distance. This represents an extended sweep zone where price has historically shown exhaustion.
For example, if the previous hour's range was 20 points and the median high sweep distance is 40% of range, the median reversal level would be placed 8 points above the previous high.
How to Use the Indicator
Sweeps were calculated using 1m data - as such, it's recommended to use the indicator on a 1min chart
Visual Components
Hour Delimiter (Gray Vertical Line)
Marks the start of each new hour
Helps identify when new statistics become active
Sweep Markers
Green "H" label: High sweep has occurred this hour
Red "L" label: Low sweep has occurred this hour
Markers appear on the exact bar where the sweep happened
Target Levels (Blue Lines)
Prev Open: Previous hour's opening price
Prev High: Previous hour's highest price (sweep target)
Prev Low: Previous hour's lowest price (sweep target)
Prev 50%: Midpoint of previous hour's range
Current Open: Current hour's opening price (key retracement target)
Reversal Levels (Purple Dashed Lines)
Positioned beyond the previous high/low based on historical sweep percentiles
Three levels above previous high (for high sweeps)
Three levels below previous low (for low sweeps)
These represent statistically-derived zones where sweeps typically exhaust
The Statistics Table
The table dynamically updates each hour and displays different statistics based on whether the current hour opened above or below the previous hour's open.
Status Row
Shows current state: waiting for sweep, or which sweep(s) have occurred
If waiting, indicates which sweep is more probable based on historical data
SWEEP PROBABILITIES Section
High Sweep: Historical probability (%) that price will sweep the previous high this hour
Low Sweep: Historical probability (%) that price will sweep the previous low this hour
Both Sweeps: Historical probability (%) that price will sweep both levels this hour
These probabilities are derived from counting how many times each pattern occurred in similar historical contexts. For example, "High Sweep: 73.18%" means that in 73.18% of historical occurrences where the hour opened in this same context (same hour of day, same position relative to previous open), price swept the previous high before the hour closed.
AFTER HIGH SWEEP → Section
These statistics activate only after a high sweep has occurred. They show the probability of price retracing to various levels:
→ Prev High: Probability that price returns to (or below) the level it just swept. This is typically 90%+ because sweeps often act as "false breakouts" or liquidity grabs before reversal.
→ 50% Level: Probability that price retraces at least halfway back into the previous hour's range. This represents a moderate retracement.
→ Current Open: Probability that price retraces all the way back to where the current hour opened. This indicates a complete reversal of the sweep move.
→ Prev Low: Probability that price retraces entirely through the previous range to touch the opposite extreme. This represents a full reversal pattern.
AFTER LOW SWEEP → Section
Mirror of the above, but for low sweeps:
→ Prev Low: Retracement to the swept low level (90%+ probability)
→ 50% Level: Retracement to middle of range
→ Current Open: Full retracement to current hour's open
→ Prev High: Complete reversal to opposite extreme
Important Note on Retracement Statistics: These percentages are tracked independently. A 90% probability of returning to the swept level doesn't mean there's only a 10% chance of deeper retracement. Price can (and often does) retrace through multiple levels sequentially. The percentages show how many times price reached at least that level, not where it stopped.
Trading Applications
Anticipating Sweeps
When an hour opens inside the previous range, check the probabilities. If "High Sweep: 70%" and "Low Sweep: 30%", you know there's a 70% historical likelihood of an upside sweep occurring this hour. This doesn't guarantee it will happen, but provides statistical context for potential setups.
Reversal Trading
The most reliable pattern in the data is the 90%+ retracement probability to swept levels. When a sweep occurs, traders can anticipate a retracement back to at least the swept level in the vast majority of cases. The reversal level percentiles help identify where sweeps may exhaust.
Position Management
The retracement probabilities help manage existing positions. For example, if you're long and a high sweep occurs, you know there's a 90%+ chance of at least some retracement to the swept level, which might inform profit-taking or stop-loss decisions.
Confluence with Current Open
The "Current Open" retracement statistics (typically 60-70%) highlight the magnetic quality of the hour's opening price. After a sweep, price frequently returns to test this level.
Customization Options
The indicator offers extensive visual customization:
Toggle on/off: hour delimiters, sweep markers, target levels, reversal levels, statistics table
Customize colors, line widths, and styles for all visual elements
Adjust label sizes and table position
Show/hide individual target levels and reversal percentiles
Limitations and Considerations
Pattern-Specific: The indicator only provides statistics when the current hour opens inside the previous hour's range. If the hour opens outside this range (gaps up or down), the statistics are not applicable.
Historical Probabilities: The percentages represent historical frequencies, not predictions. A 70% probability means it happened 70% of the time historically, not that it will definitely happen 7 out of 10 times going forward.
NQ-Specific Calibration: All statistics are derived from NQ futures data. Market behavior, volatility, and patterns differ across assets.
Hour-Specific Behavior: Different hours show dramatically different statistics. For example, the 9 AM EST hour (market open) shows much higher sweep probabilities (80%+) than the 5 PM EST hour (30-50%) due to differing liquidity and volatility conditions.
No Guarantee of Execution: While a 90% retracement probability is high, it means 10% of the time, price did NOT retrace. Always use proper risk management.
Technical Notes
The indicator uses hourly timeframe data via request.security() to determine previous hour values
Sweep detection occurs in real-time on the chart's timeframe
Statistics are hardcoded from the comprehensive backtested analysis (not calculated on-the-fly)
The indicator stores static values at the start of each hour to ensure consistency as the hour progresses
All percentage values are rounded to one decimal place for clarity
This indicator provides a statistically-grounded framework for understanding hourly price behavior in NQ futures. By combining real-time pattern detection with comprehensive historical analysis, it offers traders probabilistic insights to inform decision-making process within the specific context of each trading hour.

NeuralFlow Forecast Levels | SPY WeeklyThis is a companion script that plots AI-adaptive market equilibrium & expansion mapping levels for SPY on chart.
NeuralFlow Forecast levels are generated though a Artificial Intelligence framework trained to identify where price is statistically inclined to re-balance and where expansion zones historically exhaust rather than extend.
What the Bands Represent
Band Layer Meaning
AI Equilibrium (white core) Primary weekly balance zone where price is most likely to mean-revert
Predictive Rails (aqua / purple) High-confidence corridor of institutional flow containment
Outer Zones (green / red) Expansion limits where continuation historically decays
Extreme Zones (top/bottom) Rare deviation envelope where auction completion is statistically favored
NeuralFlow operates Artificial Intelligence models trained specifically to map statistical re-balancing behavior, not trader predictions or sentiment. No discretionary drawing. No correlations. No lagging overlays.
This engine updates only when underlying structure changes — not when candles fluctuate intraday.
Risk:
Educational & analytical use only. Not financial advice

NeuralFlow Forecast Levels| NIFTY WeeklyThis is a companion script that plots AI-adaptive market equilibrium & expansion mapping levels on chart.
NeuralFlow Forecast levels are generated though a Artificial Intelligence framework trained to identify where price is statistically inclined to re-balance and where expansion zones historically exhaust rather than extend.
What the Bands Represent
Band Layer Meaning
AI Equilibrium (white core) Primary weekly balance zone where price is most likely to mean-revert
Predictive Rails (aqua / purple) High-confidence corridor of institutional flow containment
Outer Zones (green / red) Expansion limits where continuation historically decays
Extreme Zones (top/bottom) Rare deviation envelope where auction completion is statistically favored
NeuralFlow operates Artificial Intelligence models trained specifically to map statistical re-balancing behavior, not trader predictions or sentiment. No discretionary drawing. No correlations. No lagging overlays.
This engine updates only when underlying structure changes — not when candles fluctuate intraday.
Risk:
Educational & analytical use only. Not financial advice

Infinity Algo Dashboard█ OVERVIEW
Infinity Algo Dashboard combines 4 powerful modules into one clean overlay: Multi-Timeframe Analysis, Order Blocks, Market Structure (BOS/CHoCH), and Adaptive Cloud Bands.
Monitor 8 timeframes simultaneously, spot supply/demand zones with volume metrics, track structure shifts in real-time, and assess volatility — all without cluttering your chart.
Includes 16+ built-in alert conditions and 17 color themes.
█ KEY FEATURES
✅ Multi-Timeframe Dashboard (8 TFs) — trend + volatility at a glance
✅ Algorithmic Order Blocks / Supply & Demand Zones with volume analysis
✅ Market Structure Labels (BOS / CHoCH) for regime detection
✅ Adaptive Cloud Bands for dynamic support/resistance
✅ 16+ Built-in Alert Conditions for automation
✅ 17 Color Themes including colorblind-friendly options
✅ Designed for crypto, forex, stocks, indices, and commodities
█ WHAT MAKES THIS INDICATOR DIFFERENT
📊 Multi-Timeframe Analysis
Most MTF dashboards just show moving average direction. This one shows trend state + volatility regime + volatility trend across 8 timeframes simultaneously. Spot alignment instantly.
🧱 Smart Order Blocks
Not just rectangles on a chart. These zones include volume metrics (Buy/Sell split), midlines, break detection, and automatic pruning of invalid zones.
📐 Market Structure That Makes Sense
BOS (Break of Structure) and CHoCH (Change of Character) labels derived from actual swing highs/lows — not arbitrary price levels.
☁️ Adaptive Cloud Bands
Volatility-aware envelope that auto-adjusts its period based on your timeframe. Expands in trending markets, contracts in consolidation.
█ MODULES EXPLAINED
1) Multi-Timeframe Dashboard
Monitors up to 8 user-selected timeframes simultaneously
Trend State: Bullish / Bearish / Overbought / Oversold
Volatility State: High / Low / Normal
Volatility Trend: Rising / Falling / Stable
Two visual styles: Pro Neutral (clean) or Semantic Heatmap (color-coded)
AVG row shows overall market bias across all timeframes
2) Order Blocks / Buy-Sell Zones
Algorithmic detection of swing-based supply/demand zones
Volume Metrics: Total volume + Buy/Sell % split inside each zone
Midline: Key level within the zone for precision entries
Break Labels: "Break Up" / "Break Down" when zones are invalidated
Exit Markers: Signals when price leaves a zone (Close or Wick trigger)
Smart Filtering: Show nearest only, hide overlaps, limit history
3) Market Structure (BOS/CHoCH)
BOS (Break of Structure): Trend continuation signal — confirms momentum
CHoCH (Change of Character): Early reversal warning — first sign of regime shift
Derived from pivot highs/lows using configurable sensitivity
Optional candle coloring based on structure bias
4) Cloud Bands (Adaptive Envelope)
Smoothed, volatility-aware channel (Keltner-style with enhancements)
Auto Mode: Period adjusts automatically based on your chart timeframe
Manual Mode: Set your own period for full control
Dynamic midline for trend bias assessment
Edge dots highlight when price touches band boundaries
Great for identifying breakouts vs. mean-reversion setups
█ USE CASES
📈 Trend Confirmation
Check the MTF Dashboard for alignment. When 6+ timeframes agree (Strong Bullish/Bearish), you have confluence. Use Order Blocks as entry zones in the direction of the trend.
📉 Reversal Hunting
Watch for CHoCH labels — they signal potential regime change before the crowd sees it. Combine with Order Blocks for well-defined reversal entries.
🎯 Precision Entries
Use Order Block midlines as entry targets. When price retraces to the midline of an unbroken zone aligned with higher-TF bias, you have a more selective setup.
⚡ Volatility Assessment
Cloud Bands show you the current volatility regime. Price outside bands = trending (ride it). Price inside bands = consolidation (fade the edges or wait).
🤖 Alert Automation
Set alerts for zone breaks, BOS/CHoCH events, MTF alignment shifts, or cloud breakouts. React to opportunities even when away from the screen.
█ HOW TO USE
Apply to your chart (any timeframe, any market)
Configure your 8 dashboard timeframes (e.g., 1m/5m/15m/1h/4h/1D/1W/1M)
Watch for MTF alignment — strong alignment = cleaner directional bias
Use Order Blocks as "areas of interest" — prefer zones aligned with HTF bias
Monitor BOS/CHoCH for structure shifts — CHoCH = warning, BOS = confirmation
Use Cloud Bands to assess volatility — outside = trending, inside = ranging
Set alerts for the events that matter to your strategy
█ ALERTS
16+ built-in alert conditions:
Order Blocks: Zone breaks, zone entries, zone exits
Market Structure: Bullish/Bearish BOS, Bullish/Bearish CHoCH
MTF Alignment: Strong bullish/bearish (6+), Full alignment (8/8)
MTF Bias Flip: When average bias crosses bullish/bearish threshold
Cloud Events: Breakout up/down, Midband cross up/down
█ WORKS ON
Crypto
Forex
Stocks
Indices
Commodities
█ REALISTIC EXPECTATIONS
Order Blocks are algorithmic approximations — not true order flow data
BOS/CHoCH labels update on confirmed swings — some lag is expected
MTF alignment doesn't guarantee direction — it shows current state
Always combine dashboard insights with your own analysis and risk management
█ LIMITATIONS
Order Blocks are derived from swing behavior + volume — not actual institutional order flow
Zones/labels can update on the realtime candle until the swing is confirmed
Performance may slow with max history on low timeframes — reduce settings if needed
MTF data updates on higher-TF bar closes — slight delay is normal
█ DISCLAIMER
This indicator is provided for educational and informational purposes only and does not constitute financial advice. Trading involves substantial risk of loss, and you are solely responsible for your own trading decisions.


ORB Fusion Adaptive🎯 ORB Fusion Adaptive Strategy
Professional Opening Range Breakout Trading System
═══════════════════════════════════════════════════════════════════════════════
The first fully-automated, multi-instrument ORB strategy on TradingView.
💡 WHAT IT DOES:
Automatically trades Opening Range breakouts and failed breakout reversals with intelligent position sizing, professional risk management, and complete trade lifecycle tracking. Built for serious backtesting and live trading.
⚡ KEY FEATURES:
✓ Automated Entry & Exit (breakouts + reversals)
✓ Adaptive Position Sizing (3 modes: Fixed, Risk-Based, Risk-Based Initial)
✓ Multi-Instrument Support (Futures, Forex, Crypto, Stocks)
✓ Advanced Risk Management (daily limits, drawdown protection)
✓ ML-Powered Breakout Filtering (pContinue/pFail scoring)
✓ Failed Breakout Detection (high-probability reversals)
✓ Native Trailing Stops (Pine Script v5)
✓ Multi-Target Management (T1, T2, T3)
✓ Real-Time Performance Dashboard
✓ Comprehensive Backtesting (5+ years tested)
🎯 STRATEGY LOGIC:
Entry Signals
The strategy enters trades on two high-probability setups:
1. ORB Breakouts
• Detects when price breaks above/below Opening Range
• Confirms with volume (configurable threshold)
• ML filter scores probability of continuation
• Enters within 3 bars of breakout (no late entries)
• Stop placed at ORB midpoint or ATR-based
• Targets at Fibonacci extensions (1.0x, 1.618x, 2.5x ORB range)
2. Failed Breakout Reversals
• Monitors for breakouts that fail and reverse
• Confirms failure after price returns inside ORB
• Automatic reversal entry with tight stops
• Three profit targets (0.5x, 1.0x, 1.5x ORB range)
• Historical 65-75% win rate on reversals
Exit Management
• Stop Loss: Multiple methods (ATR, ORB Mid, ORB Opposite, Hybrid)
• Native Trailing Stop: Activates after configurable R-multiple profit
• Profit Targets: Single target or scaled exits at T1/T2/T3
• Daily Stop: Halts trading after max daily loss
• Drawdown Protection: Circuit breaker at max drawdown threshold
🔧 ADAPTIVE POSITION SIZING:
The strategy's most powerful feature - intelligent position sizing that adapts to your instrument and account:
Mode 1: Fixed
• Simple contract/lot size
• Best for: Testing, stable position sizing
• Use case: "Always trade 2 contracts"
Mode 2: Risk-Based (Current Equity)
• Size = (Current Equity × Risk%) / (Stop Distance × Point Value)
• Compounds with wins, reduces with losses
• Best for: Aggressive compounding
• Use case: Maximize geometric growth
Mode 3: Risk-Based (Initial Capital)
• Size = (Initial Capital × Risk%) / (Stop Distance × Point Value)
• No compounding - consistent risk exposure
• Best for: Professional risk management
• Use case: Live trading with stable risk
Multi-Instrument Intelligence
Auto-detects and calculates correctly for:
• Futures: Uses contract point value (ES $50/pt, NQ $20/pt, MES $5/pt, MNQ $2/pt)
• Forex: Uses pip value per lot (Standard/Mini/Micro/Nano)
• Crypto: Uses contract multiplier (1.0 BTC, 0.001 BTC, etc)
• Stocks: Uses $1 per share
Manual override available if auto-detect fails.
📊 RISK MANAGEMENT:
Multi-Layer Protection
• Per-Trade Risk: 0.5-2% of capital (configurable)
• Daily Risk Limit: Max 4% loss per day (halts trading)
• Max Drawdown Pause: Circuit breaker at 12% drawdown
• Position Size Limits: Min/max contracts enforced
• Max Stop Distance: ATR-based hard limit (prevents catastrophic losses)
Trailing Stop System
• Uses Pine Script's native trail_price and trail_offset
• Activates after configurable R-multiple profit (default 0.5R)
• Trail distance: ATR-based (tight 0.5 ATR to loose 2.0 ATR)
• Works reliably in backtesting AND live trading
• No manual stop management needed
🌍 GLOBAL MARKET SUPPORT:
Configurable Sessions
Unlike basic ORB indicators, this strategy works globally:
• US Equities: 9:30 AM ET default
• Forex London: Custom session 08:00-08:30 GMT
• Forex NY: Custom session 13:30-14:00 GMT
• Asian Markets: Custom session with Tokyo timezone
• Crypto: 24/7 support with custom ORB windows
Timezone support includes:
America/New_York, Europe/London, Asia/Tokyo, Asia/Hong_Kong, UTC, and more.
Session ORBs
• Asian Session ORB (Tokyo open)
• London Session ORB (Forex primary)
• NY Session ORB (US market hours)
Critical for Forex traders working multiple sessions.
📈 BACKTESTING CAPABILITIES:
Realistic Simulation
• Commission: Configurable (default $1 per order)
• Slippage: 2 ticks default (adjustable)
• Volume Confirmation: Prevents unrealistic fills
• RTH Filtering: Optional Regular Trading Hours only
• Bar Magnifier: Improved intrabar execution
Performance Metrics Dashboard
Real-time statistics displayed:
• Total Trades & Win Rate
• Net P&L & Profit Factor
• Current Drawdown
• Daily P&L tracking
• Position details (if in trade)
• Position sizing mode & current size
Historical Testing
• Supports 5000+ bars of history
• Test across multiple market conditions
• Bull markets, bear markets, range-bound periods
• Optimize by day type (trend vs rotation)
🎛️ CUSTOMIZATION OPTIONS:
ORB Settings
• Timeframe: 5, 15, 30, or 60 minutes
• Confirmation: Close, Wick, or Body
• Volume: On/off with multiplier threshold
• LTF Precision: Sub-minute high/low detection
• RTH Filter: Regular Trading Hours only option
Breakout Detection
• ML Filtering: Enable/disable with thresholds
• Failed Breakout: Sensitivity (2-10 bars)
• Failure Buffer: ATR-based confirmation
• Entry Window: Bars after signal (prevents late entries)
Stop Methods
• ATR: Tight dynamic stops (recommended)
• ORB Mid: Structural stop at midpoint
• ORB Opposite: Wide stop at opposite boundary
• Hybrid: Best of ATR and structural
Target Methods
• Single: One target, full exit
• Scaled: Partial exits at T1/T2/T3 (recommended)
• Trail Only: No fixed targets, trail to exit
🔬 OPTIMIZATION GUIDE:
For Futures (ES, NQ, MNQ, MES)
• ORB: 30 min
• Confirmation: Close
• Volume: ON (1.5x)
• Stop Method: ATR (1.0x multiplier)
• Position Mode: Risk-Based (Initial)
• Risk Per Trade: 1.5%
• Failed Breakouts: ENABLE
For Forex Majors
• ORB: 60 min (or 15 min at London open)
• Confirmation: Close
• Volume: OFF (tick volume unreliable)
• Stop Method: ATR (1.5x multiplier)
• Position Mode: Risk-Based (Initial)
• Risk Per Trade: 1.0%
• Custom Session: 0800-0900 GMT
• Timezone: Europe/London
For Crypto (BTC, ETH)
• ORB: 60 min
• Confirmation: Close
• Volume: OFF or ON (1.2x)
• Stop Method: ATR (2.0x wider stops)
• Position Mode: Fixed or Risk-Based
• Risk Per Trade: 2.0% (higher volatility)
• Custom Session: Define your preferred window
For Stocks/ETF
• ORB: 15-30 min
• Confirmation: Body (most conservative)
• Volume: ON (2.0x threshold)
• Stop Method: Hybrid
• Position Mode: Risk-Based (Initial)
• Risk Per Trade: 1.0%
• RTH Only: ENABLED
• Gap Analysis: ENABLED
💎 ADVANCED FEATURES:
Initial Balance Analysis
• First hour range tracking (A + B periods)
• IB extensions at 0.5x, 1.0x, 1.5x, 2.0x
• Day type classification (Trend/Normal/Rotation)
• Adjusts strategy behavior by day type
ORB Extensions
• Fibonacci targets: 1.272x, 1.5x, 1.618x, 2.0x, 2.618x, 3.0x
• Dynamic monitoring for take-profit zones
• Extension tracking in statistics
VWAP Integration
• Institutional benchmark reference
• Standard deviation bands (1σ and 2σ)
• Breakout alignment scoring
• Context for trade quality
Gap Analysis
• Overnight gap detection
• Gap fill target projection
• Gap fill rate statistics
• Direction bias from gap type
Comprehensive Statistics
• Bull/Bear breakout win rates
• Reversal win rate (typically 65-75%)
• Day type distribution
• Extension statistics
• Gap fill rate
• Real-time performance tracking
🎨 VISUAL FEEDBACK:
Enhanced Plots
• ORB levels (High/Low/Mid continuous lines)
• Entry markers (L for long, S for short, 🔥 for reversals)
• Extension levels with labels
• Session ORBs (Asian/London/NY)
• IB levels and extensions
• VWAP with bands
• Failed breakout markers
Color-Coded Momentum Boxes
• Blue: Inside ORB (consolidation)
• Green: Above ORB (bullish momentum)
• Red: Below ORB (bearish momentum)
• Orange: Failed breakout zones
• Variable intensity based on distance
Dynamic Dashboards
• Main Dashboard: ORB status, breakout info, setup details, market context
• Strategy Dashboard: Trades, Win%, P&L, Profit Factor, Daily P&L, Drawdown, Position info
• Narrative Dashboard: Plain-language market interpretation
Three Display Modes
• Simple: Clean chart, essential ORB only
• Standard: ORB + IB + Sessions + VWAP (recommended)
• Advanced: All features + statistics
🔔 ALERT SYSTEM:
Strategy Alerts
• Breakout Entry (with ML probabilities)
• Failed Breakout Entry (with targets)
• Stop Hit (position closed)
• Target Hit (T1, T2, T3 partials)
• Extension Reached (profit zone)
• IB Break (potential trend day)
All alerts include:
• Direction and setup type
• Entry price and position size
• Stop and target levels
• ML scores (if enabled)
• Setup grade (A+ to D)
• Win rate context
⏱️ TIMEFRAMES: 1m-15m optimal (works on all)
💎 INSTRUMENTS: Futures, Forex, Crypto, Stocks, Indices
🎓 SKILL LEVEL: Intermediate to Advanced
📚 WHAT'S INCLUDED:
Comprehensive Documentation
• 200+ lines of detailed tooltips
• Every setting fully explained
• Optimization guides by market
• Position sizing calculator explanations
• Risk management framework
• Best practices and common pitfalls
Ready-to-Use Configurations
• Default settings optimized for ES/NQ
• Recommended settings for each instrument type
• Conservative vs Aggressive profiles
• Scalping vs Swing configurations
Full Transparency
• All calculations shown in dashboard
• Position sizing visible in real-time
• Strategy performance metrics live
• No black boxes or hidden logic
🚨 RISK DISCLAIMERS:
CRITICAL INFORMATION - PLEASE READ:
• This is a trading strategy that executes real trades in backtesting
• Past performance does NOT guarantee future results
• All trading involves substantial risk of loss
• Never risk money you cannot afford to lose
• This is NOT financial advice - for educational purposes only
• Requires understanding of ORB methodology and risk management
• Test thoroughly on paper/demo account before live trading
• Position sizing must be configured correctly for your account
• Stop losses are NOT guaranteed in all market conditions
• Slippage and commissions will affect live results
• Volatile markets may trigger circuit breakers (drawdown pause)
Strategy-Specific Risks:
• Opening range breakouts can fail (hence the reversal system)
• Volume confirmation may limit signals in low-volume instruments
• Custom sessions must match your market's actual hours
• Multi-instrument support requires correct point value configuration
• Trailing stops may exit early in volatile conditions
• Daily limits may prevent recovery trades
• Backtesting results may not match live execution
Position Sizing Warnings:
• Risk-Based modes can size large positions if stops are tight
• Always set max position size limits appropriate for your account
• Verify point values are correct for your instrument
• Test with small size first
• Monitor position size in dashboard before every trade
🎓 WHO THIS IS FOR:
Best Suited For:
• Traders with ORB methodology knowledge
• Those seeking a fully-automated system
• Backtesting enthusiasts
• Multi-instrument traders
• Risk-conscious systematic traders
• Traders who understand position sizing
Not Recommended For:
• Complete beginners to trading
• Those seeking "set and forget" with zero monitoring
• Traders unwilling to backtest first
• Those who don't understand risk management
• Accounts under $5,000 (position sizing too small)
💡 PRO TIPS:
Backtesting Best Practices
• Start with 2+ years of data
• Include both bull and bear markets
• Test on same timeframe you'll trade (5-min for 5-min ORB)
• Account for commissions/slippage realistically
• Verify win rate >45% and profit factor >1.3
Position Sizing
• Use Risk-Based (Initial Capital) for most consistent results
• Start with 1% risk per trade, increase to 1.5-2% if comfortable
• Set max position size to prevent oversizing
• Verify point values are correct before live trading
• Monitor dashboard for actual size before each trade
Risk Management
• NEVER disable daily loss limit
• Keep max drawdown pause at 12% or lower
• Use ATR stop method for best R:R
• Enable trailing stops for trend capturing
• Take partial profits at T1 (at least 30-40%)
Failed Breakout Trading
• These are your highest win-rate setups (65-75%)
• Always enable this feature
• Use tighter stops on reversals than breakouts
• Don't chase if you miss the entry window
• Three targets allow you to scale out profitably
ML Filtering
• Dramatically improves breakout quality
• Reduce signals but increase win rate
• Start with default thresholds (pCont≥0.55, pFail≤0.35)
• Lower signals = higher quality in choppy markets
• Can disable for more signals in strong trends
⚙️ TECHNICAL DETAILS:
Strategy Engine
• Pine Script v5
• Native strategy.entry() and strategy.exit()
• Trailing stops use trail_price/trail_offset (no repainting)
• Proper position sizing with strategy.position_size
• Realistic fills with commission and slippage
• Bar magnifier for improved intrabar execution
Performance
• Optimized for 1-minute to 15-minute charts
• Supports 5000+ bars of history
• Efficient calculations (no arrays in hot loops)
• Max 500 visual objects (boxes/lines/labels)
• No repainting - all signals confirmed on bar close
Position Sizing Engine
• Auto-detects Futures, Forex, Crypto, Stocks
• Uses syminfo.pointvalue when available
• Falls back to manual configuration
• Proper rounding to exchange increments
• Min/max limits enforced
Risk System
• Per-trade risk percentage enforced
• Daily P&L tracking
• Drawdown from peak equity
• Circuit breakers halt trading when limits hit
• Resets daily for fresh start
🔄 VERSION HISTORY:
Current Version: 1.0 (Initial Release)
• Complete ORB breakout + reversal strategy
• Adaptive position sizing (3 modes)
• Multi-instrument support
• Advanced risk management
• Native trailing stops
• ML filtering integration
• Comprehensive backtesting
• Real-time performance dashboard
Planned Updates:
• Additional session templates (Tokyo, Sydney)
• More stop methods
• Enhanced ML model training
• Volatility regime detection
• Trade journal export
═══════════════════════════════════════════════════════════════════════════════
Trade the opening range with institutional precision.
Automated entries. Intelligent sizing. Professional risk management.
Test first. Trade smart. Scale safely.
Taking you to school. — Dskyz, Trade with insight. Trade with anticipation.

Bullish/Bearish Movement SumThis indicator calculates and displays the cumulative sum of bullish and bearish price movements over a specified period.
Features:
- Green line: Cumulative sum of all bullish movements
- Red line: Cumulative sum of all bearish movements (absolute value)
- Blue area: Net difference (bullish - bearish)
- Information table showing current values and bull/bear ratio
Settings:
- Calculation Period: Choose rolling window size (default: 100 bars) or 0 for cumulative from start
- Calculation Mode: Choose between "Points" (absolute price changes) or "Percentage" (% changes)
Use Cases:
- Identify market directional strength
- Compare bullish vs bearish pressure
- Spot divergences between price and directional momentum
- Ratio > 1 indicates more bullish than bearish movement
Developed with assistance from Claude (Anthropic)

Statistical Deviation per AssetINDICATOR: STATISTICAL DEVIATION PER ASSET (SDPA)
1. Overview
The Statistical Deviation per Asset (SDPA) is a quantitative analysis tool designed to measure the strength and exhaustion of price movements. Unlike standard oscillators (like RSI ), the SDPA calculates the actual percentage deviation from the most recent pivot point (High or Low) and compares it against historical performance averages specific to each asset.
---
2. Core Logic & Calculation
The script operates on a Mean Reversion principle. It assumes that every asset (Gold, Bitcoin, Ethereum, etc.) has a unique "volatility signature" depending on the timeframe.
* Dynamic Pivot Detection : The indicator identifies recent Swing Highs and Swing Lows using an adaptive lookback period.
* Real-Time Return Calculation : Once a pivot is confirmed, the script calculates the real-time percentage gain (from a Low) or loss (from a High).
* Zero-Indexed Histogram : This return is plotted as an oscillator centered around a Zero Line , representing the current trend's progress since the last reversal.
---
3. Adaptive Intelligence (Multi-Asset & Multi-TF)
The SDPA is pre-loaded with a statistical database. It automatically adjusts its sensitivity and thresholds based on:
1. The Selected Asset : Whether trading XAUUSD , Bitcoin , or Solana , the deviation thresholds adapt to the specific volatility of that instrument.
2. The Timeframe (TF) : The calculation period ( period ) and performance targets ( hausse_perf / baisse_perf ) change dynamically. For example, a 1-minute scalping setup uses a longer lookback (200) compared to a Daily swing setup (10).
---
4. Visual Anatomy
The interface is designed for instant "at-a-glance" interpretation:
* The Histogram :
* Green : Price is trending up since the last Swing Low .
* Red : Price is trending down since the last Swing High .
* Threshold Lines (The Statistical Averages) :
* Thick Line (60% Opacity) : Represents the Average Historical Deviation . When the histogram hits this line, the move is considered "statistically mature."
* Thin Line (70% Opacity) : Represents the Strong Deviation Zone (1.5x the average), indicating extreme momentum or potential exhaustion.
* Background Highlighting : The chart background colors automatically when the price exceeds historical averages, signaling a High-Probability Reversal Zone .
---
5. How to Trade with SDPA
* Trend Maturity : If the histogram exceeds the Bullish Average (Green line), the current move has reached its typical historical limit. Traders should look for take-profit opportunities or wait for a reversal.
* Impulse Strength : A rapid move from the Zero Line toward the thresholds confirms strong institutional interest.
* Mean Reversion : When the histogram reaches the Strong Zone (1.5x), the price is "overextended" statistically, offering a high reward-to-risk ratio for counter-trend setups.
---
6. Technical Parameters
* Asset Choice : Dropdown menu to select the specific asset.
* Colors : Customizable Bullish and Bearish colors to match any UI theme.
* Precision : Set to 4 decimal places to ensure accuracy across all asset types.
