Position TrackerEnter your purchase price & the quantity.
It'll display a line at that value, with a label indicating the current gain/loss
Pesquisar nos scripts por "track"

Volatility Gap TrackerThe Volatility Gap Tracker ( *VGT ) indicator calculates the historical volatility of an asset using the standard deviation of the natural logarithm of the closing price relative to the previous period's closing price. *VGT visualizes the HV with gap lines to highlight when the current HV has increased or decreased significantly compared to the previous period, and adds labels to show the HV value for each of those bars.
Low HV calculated by *VGT can potentially signify a potential move up or down in the price of an asset. When HV is low, it indicates that the price of the asset has been relatively stable or range-bound over the specified period of time. This can sometimes be a precursor to a significant move in either direction, as the price may be building up energy to break out of its range.
*VGT can be used for any market that TradingView supports, including stocks, forex, and cryptocurrencies. It is especially useful for traders who want to identify periods of high volatility or sudden changes in volatility , which can indicate potential trading opportunities or risks. However, it's important to note that HV is a historical measure and may not always accurately predict future volatility .
The indicator can be used under various market conditions, but is especially useful during periods of high volatility , such as market crashes or major news events. It can also be useful for traders who want to monitor the volatility of specific stocks or assets over a longer period of time.
*VGT is provided for informational purposes only and is not a guarantee of future performance or accuracy. Traders should use multiple indicators and analysis methods to make informed trading decisions. Trading involves risks and traders should always conduct their own research and analysis before making any investment decisions.

Volatility Trackerhi there, fellows.
this is a very simple and quite straightforward indicator.
so far the simplest we've built.
on what it does
in regard to current chart and timeframe it plots
a. Open - Close as a percentage of the Open (we regard open as more relevant than close, for as you can use latest estimates in current candle) in daily change coloring (so one may have an idea if there is a trend or sideways move unfolding)
b. High - Low as a percentage of the Open, so one may compare extreme moves with final ones in the period
c. Volume as a percentage distance from its WMA200 (always this one, a way better reference for normalcy). (e. g. a positive value x means Volume is x% above its WMA200)
on what it means
to the best of our imperfect and incomplete understanding, we believe that low volatility periods lead to high volatility periods, so one might want to enter the market in low volatility periods to enjoy wild rides afterwards. such a trade of course would be, for the sake of making sense, a long volatility one.
the timing for entrance could be once that the volatility waves fades to chart minimums.
we're open to critics, suggestions and comments.
best regards.

STD Stepped Ehlers Optimal Tracking Filter MTF w/ Alerts [Loxx]STD Stepped Ehlers Optimal Tracking Filter MTF w/ Alerts is the traditional Ehlers Optimal Tracking Filter but with stepped price levels, access to multiple time frames, and alerts.
What is Ehlers Optimal Tracking Filter?
From "OPTIMAL TRACKING FILTERS" by John Ehlers:
"Dr. R.E. Kalman introduced his concept of optimum estimation in 1960. Since that time, his technique has proven to be a powerful and practical tool. The approach is particularly well suited for optimizing the performance of modern terrestrial and space navigation systems. Many traders not directly involved in system analysis have heard about Kalman filtering and have expressed an interest in learning more about it for market applications. Although attempts have been made to provide simple, intuitive explanations, none has been completely successful. Almost without exception, descriptions have become mired in the jargon and state-space notation of the “cult”.
Surprisingly, in spite of the obscure-looking mathematics (the most impenetrable of which can be found in Dr. Kalman’s original paper), Kalman filtering is a fairly direct and simple concept. In the spirit of being pragmatic, we will not deal with the full-blown matrix equations in this description and we will be less than rigorous in the application to trading. Rigorous application requires knowledge of the probability distributions of the statistics. Nonetheless we end with practically useful results. We will depart from the classical approach by working backwards from Exponential Moving Averages. In this process, we introduce a way to create a nearly zero lag moving average. From there, we will use the concept of a Tracking Index that optimizes the filter tracking for the given uncertainty in price movement and the uncertainty in our ability to measure it."
Included:
-Standard deviation stepping filter, price is required to exceed XX deviations before the moving average line shifts direction
-Selection of filtering based on source price, the moving average, or both; you can also set the Filter deviations to 0 for no filtering at all
-Toggle on/off bar coloring
-Toggle on/off signals
-Long/Short alerts

Profit Loss TrackerIt's a simple profit loss tracker for up to 10 symbols. A concise panel displays all your positions, whether if they're in profit or loss, and what percentage.
Text size and box position can be adjustable.
BenTrading bullish trend continuation trackerThis script uses simple features to indicate where a trend may continue.
It uses market structures and monitors breaks of swing highs and swing lows.
If there is a break upwards, the alert will give signal when swing points forms (see chart - alert 1) or when sweeps form (see chart - alert 2).
For it to send alerts you must right click the indicator and apply alert - "once per bar".
This indicator only shows bullish signals, while there is another indicator that can be used alongside it to indicate berish trend continuation with the same features.

Stochastic Optimized Trend Tracker *Strategy*Stochastic OTT is Anıl Özekşi's latest derived version of Optimized Trend Tracker on Stochastic Oscillator.
He tried to solve the fake signals of Stochastic Oscillator by adopting OTT on the indicator.
He advised users to set the stochastic smoothing parameters to 500 and 200 on his latest video about SOTT.
He personally uses 1 min charts on stock market so the parameters of the indicator might have to be optimized for other time frames nad markets.
He exaggerated the Stochastic to 1000's to have better signals of percent values of OTT .
Also hes used VIDYA in both calculations of OTT and Stochastic smoothing.
Said, Kıvanç Özbilgiç.
I just made a Strategy version of the script so that we lads can backtest it. The codes for that are yet again from Kıvanç Özbilgiç :) I just copy-pasted a few and did some adjustments. Hope you enjoy!
#betonyetmez
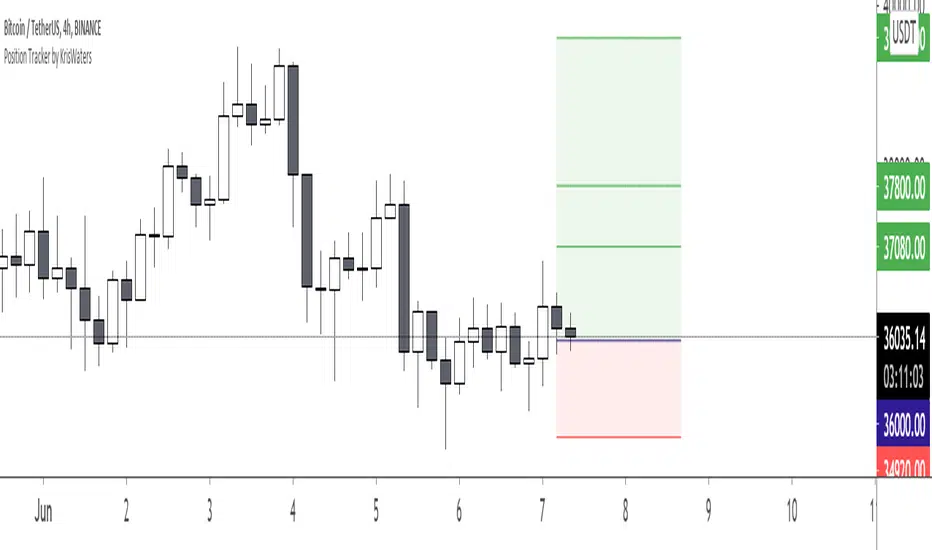
Position Tracker by KrisWatersPosition tracker helps you to know "Stop" and "Take Profit" prices with provided "Entry Price" data. You can use on Long and Short setups.
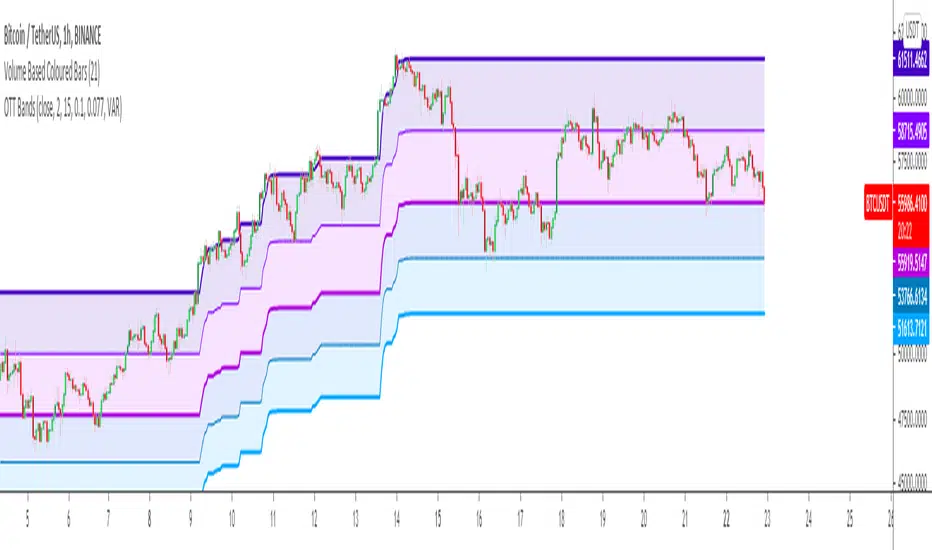
Optimized Trend Tracker BandsDerived from Anıl Özekşi's Optimized trend tracker Indicator OTT:
by himself on his last youtube video with subtitles.
OTT Bands tries to determine accurate support and resistance levels after users manually set the 2 optimization coefficients (for UPPER AND LOWER BANDS) just by having the highest and lowest price levels inside the OTT Bands.
After that user can enjoy the fibonacci coefficiented levels just by selecting from indicator settings.
A message from the developer Anıl Özekşi to all traders:
"Hope you are always on the winning side ..."
Kıvanç Özbilgiç
[blackcat] L2 Price Envelope TrackerLevel: 2
Background
Price envelopes sare shown at a set percentage above and below a moving average. They are used to indicate overbought and oversold levels and can be traded individually or in conjunction with a momentum indicator.
Function
L2 Price Envelope Tracker is an innovative indicator that use customized envelope of price to disclose overbought and oversold periods. With this function, long and short entries can be further developped in this pine script.
Key Signal
sma5 --> typical price moving average line
resistance --> upper envelope as resistance line
support ---> lower envelope as support line
Pros and Cons
Pros:
1. easy observe overbought and oversold zone
2. disclose exact long and short entries in overbought and oversold zones
Cons:
1. Only applicable for the trading pairs that support financial() functions. crypto/xau/xag/indice are not applicable
2. Need to tune r1 and s1 for different trading pairs
Remarks
NA
Readme
In real life, I am a prolific inventor. I have successfully applied for more than 60 international and regional patents in the past 12 years. But in the past two years or so, I have tried to transfer my creativity to the development of trading strategies. Tradingview is the ideal platform for me. I am selecting and contributing some of the hundreds of scripts to publish in Tradingview community. Welcome everyone to interact with me to discuss these interesting pine scripts.
The scripts posted are categorized into 5 levels according to my efforts or manhours put into these works.
Level 1 : interesting script snippets or distinctive improvement from classic indicators or strategy. Level 1 scripts can usually appear in more complex indicators as a function module or element.
Level 2 : composite indicator/strategy. By selecting or combining several independent or dependent functions or sub indicators in proper way, the composite script exhibits a resonance phenomenon which can filter out noise or fake trading signal to enhance trading confidence level.
Level 3 : comprehensive indicator/strategy. They are simple trading systems based on my strategies. They are commonly containing several or all of entry signal, close signal, stop loss, take profit, re-entry, risk management, and position sizing techniques. Even some interesting fundamental and mass psychological aspects are incorporated.
Level 4 : script snippets or functions that do not disclose source code. Interesting element that can reveal market laws and work as raw material for indicators and strategies. If you find Level 1~2 scripts are helpful, Level 4 is a private version that took me far more efforts to develop.
Level 5 : indicator/strategy that do not disclose source code. private version of Level 3 script with my accumulated script processing skills or a large number of custom functions. I had a private function library built in past two years. Level 5 scripts use many of them to achieve private trading strategy.

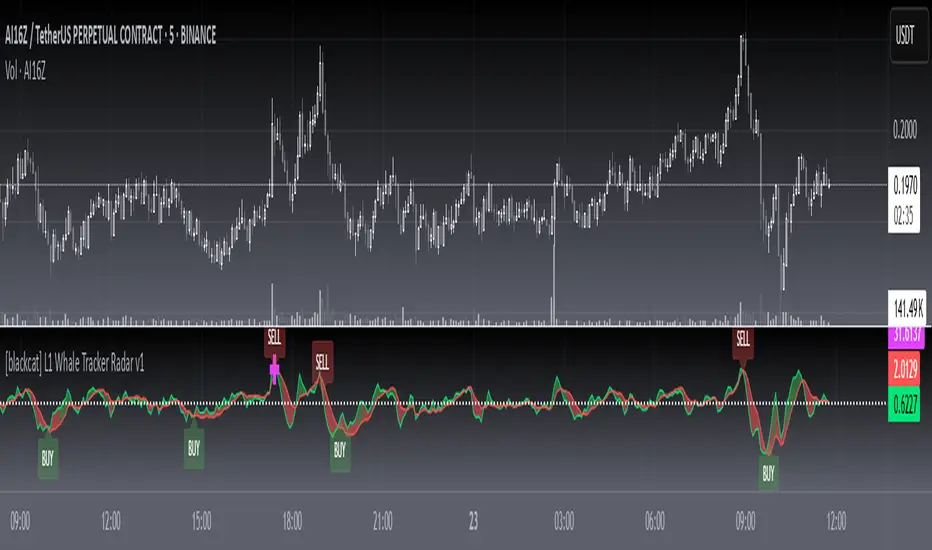
L1 Whale Tracker Radar v1Level: 1
Background
One of the biggest differences between cryptocurrency and traditional financial markets is that cryptocurrency is based on blockchain technology. Individual investors can discover the direction of the flow of large funds through on-chain transfers. These large funds are often referred to as Whale. Whale can have a significant impact on the price movements of cryptocurrencies, especially Bitcoin . Therefore, how to monitor Whale trends is of great significance both in terms of fundamentals and technical aspects.
Function
By modeling the behavior of Whale and individuals, L1 Whale Tracker Radar script can not only simply describe the behavior trends of Whale and individuals, but also generate some simple buying and selling points.
Key Signal
selradar indicates top region is reached.
buyradar indicates bottom region is reached.
buy is the long/xshort entry point suggested.
sell is the short/xlong entry point suggested.
Pros and Cons
Pros:
1. Detect Whale pump and trend.
2. Not a mature and accurate buy and sell script but provide alerts of Whale movements.
3. When it resonante with Buy signal, it has higher confidence level.
Cons:
1. Only use simple moving average to depict Whale behaviors so some info may be missing.
2. It is sensitive and may have noise inside and generate fake signal. BINANCE:BTCUSDT
Remarks
You can use this to confirm blockchain large fund transfer activities. E.g. Large amount of USDT flows into large exchanges.
Readme
In real life, I am a prolific inventor. I have successfully applied for more than 60 international and regional patents in the past 12 years. But in the past two years or so, I have tried to transfer my creativity to the development of trading strategies. Tradingview is the ideal platform for me. I am selecting and contributing some of the hundreds of scripts to publish in Tradingview community. Welcome everyone to interact with me to discuss these interesting pine scripts.
The scripts posted are categorized into 5 levels according to my efforts or manhours put into these works.
Level 1 : interesting script snippets or distinctive improvement from classic indicators or strategy. Level 1 scripts can usually appear in more complex indicators as a function module or element.
Level 2 : composite indicator/strategy. By selecting or combining several independent or dependent functions or sub indicators in proper way, the composite script exhibits a resonance phenomenon which can filter out noise or fake trading signal to enhance trading confidence level.
Level 3 : comprehensive indicator/strategy. They are simple trading systems based on my strategies. They are commonly containing several or all of entry signal, close signal, stop loss, take profit, re-entry, risk management, and position sizing techniques. Even some interesting fundamental and mass psychological aspects are incorporated.
Level 4 : script snippets or functions that do not disclose source code. Interesting element that can reveal market laws and work as raw material for indicators and strategies. If you find Level 1~2 scripts are helpful, Level 4 is a private version that took me far more efforts to develop.
Level 5 : indicator/strategy that do not disclose source code. private version of Level 3 script with my accumulated script processing skills or a large number of custom functions. I had a private function library built in past two years. Level 5 scripts use many of them to achieve private trading strategy.
[A618] Trend Tracker using Chandelier StopTrend Tacker
Works on ATR concepts and uses "Chandelier Stop by pipCharlie" as its main engine
How it is calculated
> 2 ATR stop plots are plotted
> #one ATR stop is of current time frame
> other one is the 5 times multiple of the current timeframe
> Their crossovers are analysed with the close of Current Timeframe
> This sort of methodology can help one with generating consistent entry signals over a particular timeframe
> My timeframe of choice is : 5 mins
> I have used resolution of 25, for 5 mins (see 5*5 =25)
Credits:
Chandelier Stop by pipCharlie
Hope this helps!!!

Optimized Trend Tracker - Strategy VersionA brand new indicator from the developer of MOST (Moving Stop Loss) indicator Anıl Özekşi.
Optimized Trend Tracker OTT is an indicator that provides traders to find an existing trend or in another words to ser which side of the current trend we are on.
The original indicator was coded and published by Kıvanç Özbilgiç. You can access it from this link:
I transformed the indicator into a strategy and made some changes:
- You can run two different strategies. In the Settings section, you can test two different strategies, "Support Line Crossing Signals" and "Price / OTT Crossing Signals".
- Fixed the issue where BUY/SELL labels from the indicator script would hang in the air.
- I added a setting where you can hide BUY/SELL labels if you want.
- I painted the bars for BUY/SELL states, you can open and close in the settings section.
- As I do with every strategy script, I added a start and end date for the strategy test. You can specify the range you want to see working in the Settings section.
In addition, there were cases when the OTT line was reduced to zero in non-voluminous symbols; I changed this situation by making a small change in the code. I asked Kıvanç about the subject, I can update according to his answer.
Note : Strategy BUY / SELL tags and indicator BUY / SELL tags do not operate in the same bar because indicator tags are added when the next bar occurs. If you replay bars, you can observe label formations.
TÜRKÇE AÇIKLAMA
Orjinal indikatör Kıvanç Özbilgiç tarafından kodlanmış ve yayımlanmıştır. Bu linkten erişebilirsiniz:
İndikatörü strateji dönüştürdüm ve bazı değişiklikler yaptım:
- İki farklı strateji çalıştırabilirsiniz. Ayarlar kısmında Condition bölümünde "Support Line Crossing Signals" ve "Price/OTT Crossing Signals" olarak iki farklı stratejiyi test edebilirsiniz.
- İndikatör scriptinden gelen BUY/SELL etiketlerinin havada durması sorununu düzelttim.
- İsterseniz BUY/SELL etiketleri gizleyebileceğiniz bir ayar ekledim.
- BUY/SELL durumları için barları boyadım, ayarlar bölümünden açıp kapatabilirsiniz.
- Her strateji scriptinde yaptığım gibi, strateji testi için başlangıç ve bitiş tarihi ekledim. Ayarlar bölümünden çalışmasını görmek istediğiniz aralığı belirleyebilirsiniz.
- Ek olarak hacimsiz sembollerde OTT çizgisinin sıfıra indiği durumlar mevcuttu; kodda ufak bir değişiklik yaparak bu durumu değiştirdim. Kıvanç Bey'e konu ile ilgili soru sordum, cevabına göre güncelleme yapabilirim.
Not : Strateji BUY/SELL etiketleri ile indikatör BUY/SELL etiketleri aynı barda işlem yapmamaktadır çünkü indikatör etiketleri kendisinden sonraki bar oluşunca eklenmektedir. Barları replay yaptırırsanız oluşumlarını gözlemleyebilirsiniz.

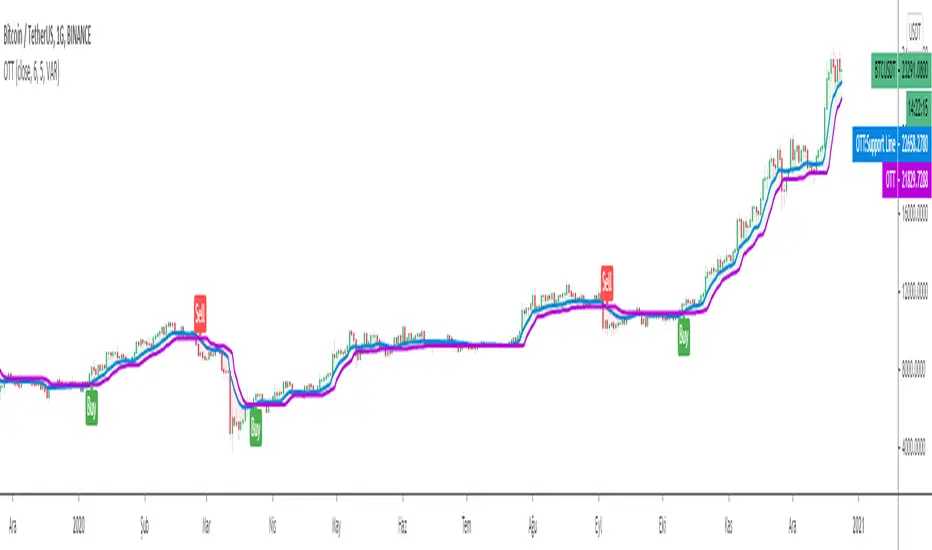
Optimized Trend TrackerA brand new indicator from the developer of MOST (Moving Stop Loss) indicator Anıl Özekşi.
Optimized Trend Tracker OTT is an indicator that provides traders to find an existing trend or in another words to ser which side of the current trend we are on.
We are under the effect of the uptrend in cases where the prices are above OTT ,
under the influence of a downward trend, when prices are below OTT
it is possible to say that we are.
The first parameter in the OTT indicator set by the two parameters is the period/length.
OTT will be much sensitive to trend movements if it is smaller. And vice versa, will be less sensitive when it is longer.
As the period increases it will become less sensitive to little trends and price actions.
In this way, your choice of period, will be closely related to which of the sort of trends you are interested in.
The OTT percent parameter in OTT is an optimization coefficient. Just like in the period
small values are better at capturing short term fluctuations, while large values
will be more suitable for long-term trends.
In addition, when OTT is used with the support line in it, buy and sell signals
it will become a producing indicator.
You can use OTT default alarms and Buy Sell signals like:
1-
BUY when Prices are above OTT
SELL when Prices are below OTT
2-
BUY when OTT support Line crosses over OTT line.
SELL when OTT support Line crosses under OTT line.
3-
BUY when OTT line is Green and makes higher highs.
SELL when OTT line is Red and makes lower lows.
Note: A small coverage with English subtitles will be available on my Youtube Channel soon.
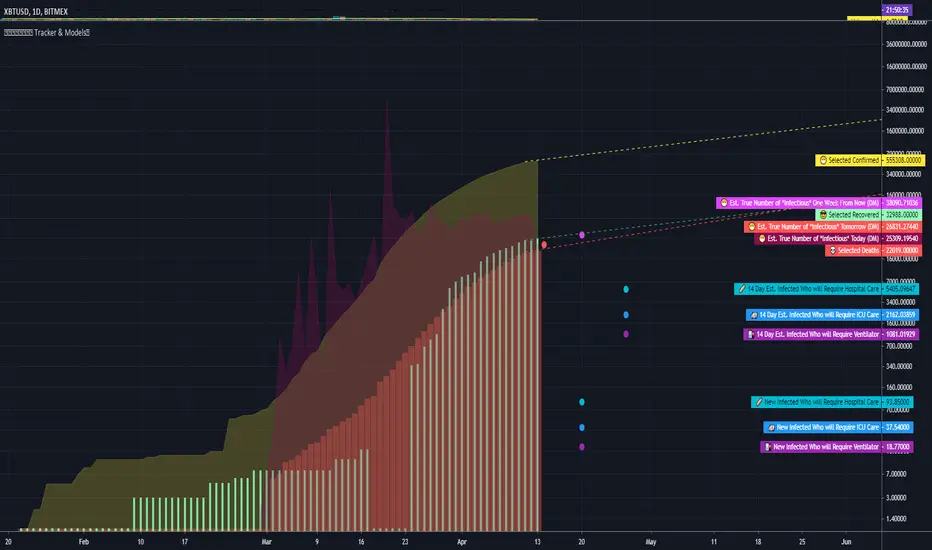
COVID Statistics Tracker & Model Projections by Cryptorhythms😷 COVID-19 Coronavirus Tracker & Statistics Tools by Cryptorhythms 😷
📜Intro
I wanted to put some more meaning behind the numbers for 2020's Covid pandemic. I hope this tool can help people analyze and deal with these hard times. With these metrics I hope to give greater depth and dimension to whats available. While also at the same time creating something that looks decently presentable and gives actionable information.
I had planned on including a few forecasting models and letting the user play with values to see how social distancing works. But alas I couldnt complete those in the scope of time I gave myself for the indicator. If you are interested in collaborating on it, I will share what I have with you and we can further work on it.
📋Description
The script contains 3 main parts you will interact with. I suggest you enable the chart labels for "indicator name" and "indicator last value" to make the charts more readable (right click on the scale of your chart and goto the "labels" pop out menu). Depending on what plots and data you choose to chart, logarithmic and regular scales can both be applied in different situations. To get similar visuals to the examples I will show below, you can goto the indicator options > style tab. I then play with the line styles, colors and transparencies to achieve the nice looking charts. Please also note there is a distinction between "Infected" and "Infectious". A model telling you the number of infected doesnt designate whether that person can still pass the virus on to others (infectious). So Infectious numbers are usually lower than total confirmed, but this isnt always the case if for example a country wasnt testing very much during the early phase or something else.
🚧Disclaimer
I am not a medical professional and none of this should be considered medical advice. All of the models, numbers and math I sourced from professional places but this is not a guarantee of the future only an approximation based on current information. Numbers change daily and so can these models!
🌐PART ONE
In this area you select a region to read the proper statistics data from tradingview. You can do global totals, country totals, or for a few places (AU, CA, CN, US) you can see state/province totals. Remember to SELECT ONLY ONE region.
🧮PART TWO
The Plots/Stats/Data section includes:
1. ) Plot the Days to Double Number of Confirmed
2. ) Plot the Infection Growth Ratio
3. ) Plot Fatality Risk Rate (Total Deaths / Total Outcomes)
4. ) Plot Overall Fatality Rate / Recovery Rate
5. ) Plot % of World Infected & % of USA Infected
6. ) Plot Daily New Deaths, Confirmed & Recovered
7. ) Plot Daily Change Percentages
🎱PART THREE
Forecasting Models and Settings:
1 .) Plot the % of Custom Population Infected (Vs. the Region Selected in Part 1 of Settings)
2 .) Plot the True Num. of Infectious (Death Model / DM)
3 .) Plot the Current and Next Weeks Cumulative Infection Projection (DM)
4 .) Plot Estimated Infection Rates? (DM)
5 .) Enable Basic Trajectory Projection?
6 .) Plot the Likelihood of > 0 **Infectious** in a Group (DM) for Today, Tomorrow and Next Week
7 .) Plot the True Num. of Infected (Confirmed/Tested Model)
8 .) Plot the Estimated Epidemiology for 7 and 14 Days Out (Hospital Beds, ICU Beds, Ventilator Units)
Planned But not completed
9.) SIR Epidemiology Model
10.) Exponential Growth Plot & Correlation
To use the Estimator for likelihood of Infected in N group of people you need to do 2 things. Select and use "Custom Population" as the population source for part 3. Then you need to enable "Custom Infected" as the source for the model. Then you enter your geographical area's population and confirmed cases. Its best to goto the smallest / most granular level of data available to accurately estimate the likelihood. So for instance in the order of least effective to most effective data source: global, country, state, county, city...etc.
If you do not understand what these terms or numbers represent, please read the source materials I have linked in the code, or use google. I dont have the time or expertise to explain all the various specific methods and terms included here. This entire project was a learning journey for me and I have zero experience in epidemiology so please excuse any errors I may have made. (and tell me, so I can change it!)
🔮Future Additions
If anyone has a model or stat they would like included I will be happy to add your code to this toolbox to make it more effective and give you credit here in the description. If you want to collaborate please message me.
📊Some Example Charts:
The Cryptorhythms Team wish you and your families all the absolute best of health!
P.S. Stay safe and act smart I dont think this will be the EOTW.
Market TrackerThis is a market tracker that gives you indications of trends and high volatility. It also helps you notate the occurrences of divergences. It is made to replicate Market Cipher B.

Whale TrackerThis is a market tracker that gives you indications of trends and high volatility . It is made to replicate Market Cipher A.

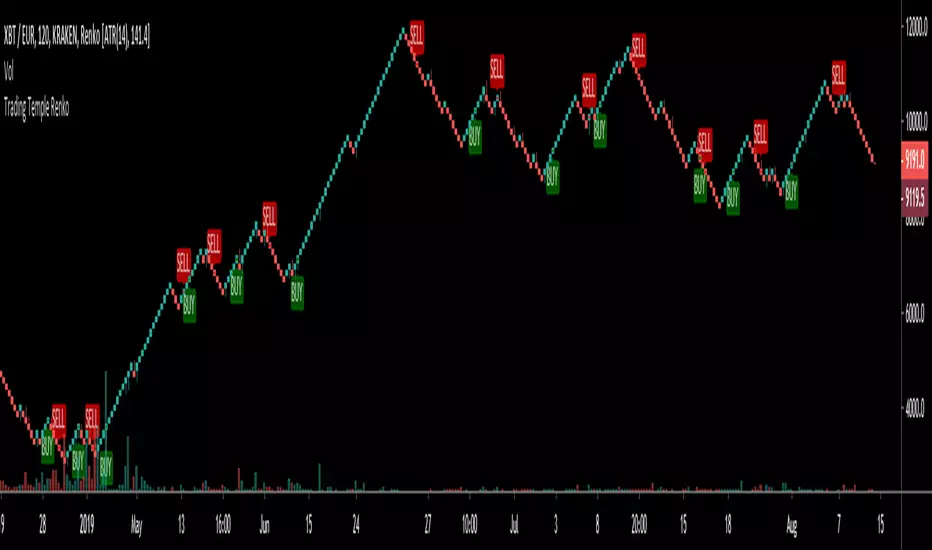
Trading Temple Trend Tracker Renko v1Trend Tracker to be used for trades following the current trend.
To be used with Renko bricks based on ATR and intraday charts (below 1D)
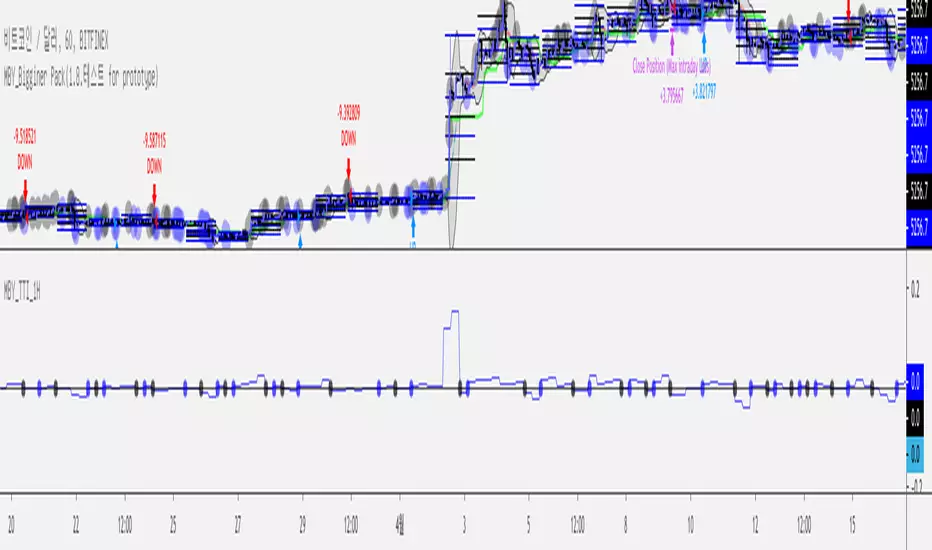
MBY_Trend Tracker Indicator(ver. 1H test)Hi, This is MBY.
This indicator has own price prediction skills on 1H time frame Charts.
Trial for 2Weeks.
evenmore, give your massages.
--
How to use?
Blue line (tracker) > Base line : Price will be going up.
Blue line < Base line : Price will be going down.
* warning.
JUST USING 1H Frame.
enjoy it.!

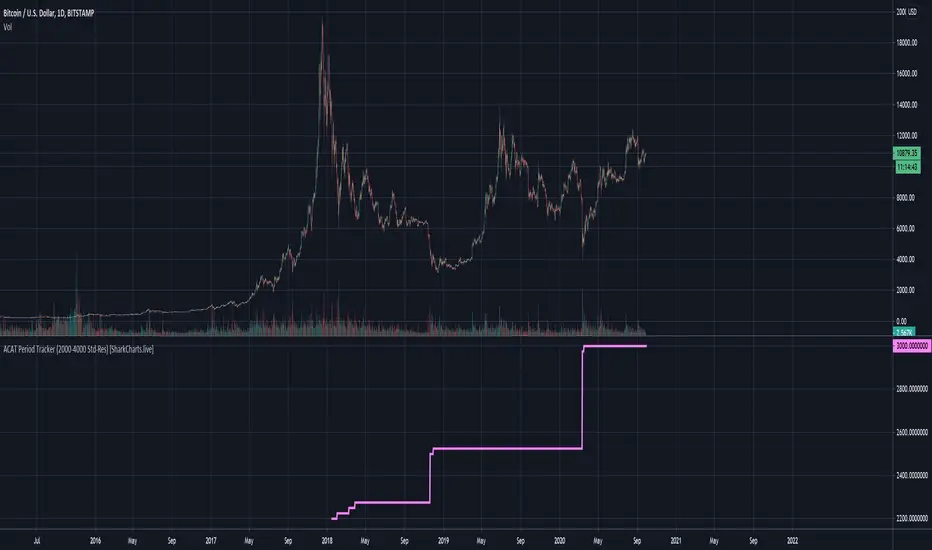
ACAT Period Tracker (2000-4000 Std-Res) [acatwithcharts]This is the corresponding period length tracker for ACAT (2000-4000 Std-Res). The constraints of Pinescript make it necessary to plot a separate indicator in a separate window to actually read out the period numbers without massively skewing the chart by default.
My volatility indicators are available by subscription in several packages through SharkCharts.live - and this is planned to be the first new one ready to add. I plan to release a video explaining how to use this indicator coinciding with launch, as there's a lot to talk about. Videos on my other indicators are currently hosted on DadShark's YouTube channel.
Current pricing and subscription details will be kept up-to-date on SharkCharts.live
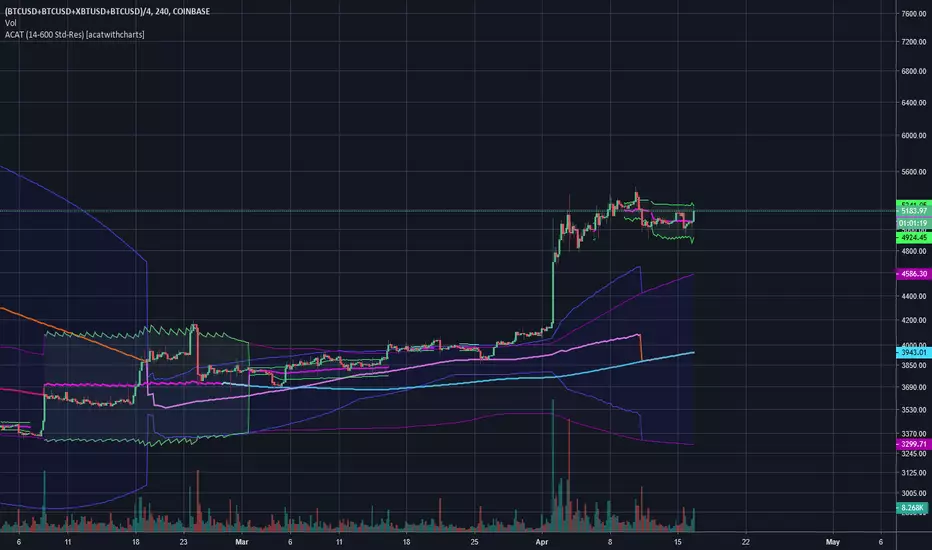
Adaptive Comprehensive Average Tracker (ACAT) [acatwithcharts]Adaptive Comprehensive Average Tracker is a 2 in 1 version of Mean Reversion MA and Compression MA. The slightly odd name is a backronym that spells "ACAT" - suffice it to say, I'm pretty proud of what these two indicators have developed into.
At the moment, it is limited to the 600-period cap; just using the logic of the two indicators in one hits runs into the limits of Pinescript. I've got some ideas to try, but for most practical purposes, the 600 cap was generally enough and the longer lookbacks are very prone to timing out anyway.
The hope is to replace two indicators that have periodic issues timing out with one, which should be substantially more convenient to use and on average mean dealing with fewer refreshes.
This is still a work in progress at the time of posting as I attempt to try to add more functionality and improve the intuitiveness of the combined menu, but assuming all goes well, I may be able to mostly deprecate the individual indicators and replace them with this combined version when I'm satisfied that it's ready to release to subscribers.
My volatility indicators are available by subscription in several packages through SharkCharts.live - and this is planned to be the first new one ready to add. I plan to release a video explaining how to use this indicator coinciding with launch, as there's a lot to talk about. Videos on my other indicators are currently hosted on DadShark's YouTube channel.
Current pricing and subscription details will be kept up-to-date on SharkCharts.live