Volume FVG | Liquidity Gaps + (Z-Core Edition)📘 Indicator Description — Volume FVG Pro+
Volume FVG Pro+ is a technical analysis tool designed to automatically detect and visualize Fair Value Gaps (FVG) on the chart. It incorporates volume-based and ATR-based filtering to highlight only meaningful zones while reducing market noise.
⚙️ How It Works:
FVG Detection:
Identifies gaps between candles that may indicate institutional activity or imbalance.
Supports two types:
Regular FVG — all price gaps.
Volume FVG — gaps with abnormally high volume, calculated via Z-Score (relative to volume average).
ATR Filtering:
Filters out insignificant price gaps using Average True Range (ATR).
Helps show only zones with strong volatility behavior.
Mitigation Logic:
Zones are marked as mitigated (deactivated) when price retraces into them.
Mitigation can be detected by wick or close, with configurable depth percentage.
Zone Extension:
Active zones automatically extend forward until they are mitigated.
Display Options:
Fully customizable:
Bullish/Bearish coloring.
Opacity and box length.
Toggle labels and outlines.
🛠️ Settings Overview:
Z-Score Thresholds — for volume-based FVG detection.
ATR Multiplier — volatility sensitivity.
Mitigation Depth (%) — defines how deep price must retrace to deactivate a zone.
Display Options — full control over how zones appear on the chart.
📌 Why Use Volume FVG:
These gaps often represent footprints of large participants.
They are statistically more likely (15–20%) to hold price and act as reaction zones compared to regular FVGs (based on internal analysis).
Useful for identifying entry/exit areas and refining market structure analysis.
👤 Best For:
Smart Money / Order Flow / Liquidity-based traders.
Intraday and swing traders using price reaction and volume cues.
Anyone seeking clear and efficient FVG detection with filtering.
Pesquisar nos scripts por "gaps"

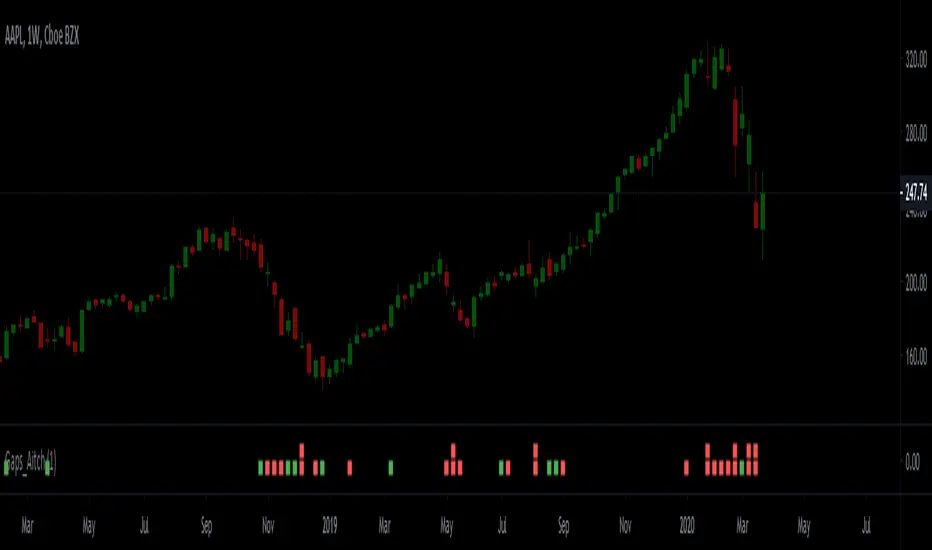
Gap Finder - Aitch-TGap finder finds the following types of gaps:
- Full Gap Up (open price is higher than the previous day's high)
- Partial Gap Up (open price is higher than the previous day's close)
- Full Gap Down (open price is lower than the previous day's low)
- Partial Gap Down (open price is lower that the previous day's close)
The script is fully customizable and can be applied to Forex, futures, stocks and crypto.
How to use it:
Once you have added the script to your chart, go to the script's settings and type in the size of the gap, then move to the style tab and check the types of gaps that you want the script to find. If you wish, you can also edit the rest of the settings to your liking.
Hit the Ok button when your done.
Green and red squares will appear on top and bottom of the indicator pointing out the location of the sharp move.
By default, full gap signals appear on top of the indicator while partial gap signals appear on the bottom of the indicator.
Defaul gap size is 1%.
[BMAX] Daily Gaps(ENGLISH)
This indicator was built to allow traders to observe the open gaps between sessions in the Market. It can be used either on daily or weekly timeframes. Also it incluses a standard deviation band (such as bollinger band) in order to verify the gaps variance. This indicator can be used to check what is the variance on the session open gaps and prepare to protect the positions against market volatility when swing or position trading.
(PORTUGUÊS)
Este indicador foi construído para permitir que traders observem os gaps de abertura de seção no Mercado. Ele pode ser utilizado no tempo gráfico Diário ou Semanal. Também inclui uma banda de desvio padrão (assim como usado nas Bandas de Bolinger) que permite verifcar a variância dos gaps. Este indicador pode ser usado para se preparar para proteger uma posição em swing ou position trading onde o mercado pode abrir com forte gap em situações de alta volatilidade.

Fair Value Gaps [Fax Academy]FVG — Precision Fair Value Gap Detection for Professional Traders
Overview
Identifies and draws Fair Value Gaps (FVGs) using a refined 3-bar displacement model on the selected timeframe.
Optimized for Forex and Gold, but fully compatible with all instruments and timeframes.
Non-repainting, fast, and engineered to filter only meaningful imbalances.
ATR% or Points-based thresholds ensure cleaner charts; optional “latest only” mode and automatic gap removal on fill.
Detection Logic
Bullish FVG :
Current low > high from two bars ago, and the prior bar closes above that high at a source-timeframe boundary.
Bearish FVG :
Current high < low from two bars ago, and the prior bar closes below that low at a source-timeframe boundary.
All boxes anchor using xloc.bar_time for precise alignment with the source timeframe.
Inputs
Source Timeframe : Chart timeframe or any higher TF (1H, 4H, D, etc.)
Show Bullish / Show Bearish : Direction toggles.
Threshold Mode : Points or ATR % filter (dynamic). ATR length is internal; set your preferred percentage.
Min Gap (points) : Used when Threshold Mode = Points.
Extend Bars : How many bars the box extends to the right.
Show Latest Only : Only show the most recent gap.
Delete On Fill : Automatically remove gaps once price fully mitigates them.
Colors & Border Width : Fully adjustable styling.
How To Use
Select a Source Timeframe to map higher-TF FVGs onto lower-TF charts (e.g., 4H → 1H/15m).
Use ATR % filtering (10–20% recommended) to eliminate small, irrelevant gaps.
Enable “Latest Only” for a clean chart, or keep full history for multi-mitigation analysis.
Combine with:
EMA for trend + pullback structure.
Sessions for timing and volatility alignment.
Reading FVGs
Unmitigated FVGs can behave like magnets or supply/demand pockets.
In trending markets, fresh FVGs aligned with higher-TF bias offer high-quality continuation entries.
Filled gaps are automatically deleted when “Delete On Fill” is enabled.
Defaults
Bullish = ON, Bearish = ON
Threshold Mode: ATR % (10%)
Extend Bars: 1
Latest Only: OFF
Delete On Fill: ON
Colors: Dark Green (bullish), Dark Red (bearish)
Notes
Non-repainting — all detection occurs only when the source timeframe bar closes.
Works on any chart timeframe with perfect timestamp alignment.
If your chart lacks enough higher-TF bars, extend history or select a lower Source TF.
Brand
Developed by Fax Academy to bring precision, clarity, and professional-grade imbalance analysis to modern trading.
For educational and analytical purposes only — always combine with sound risk management and verification.

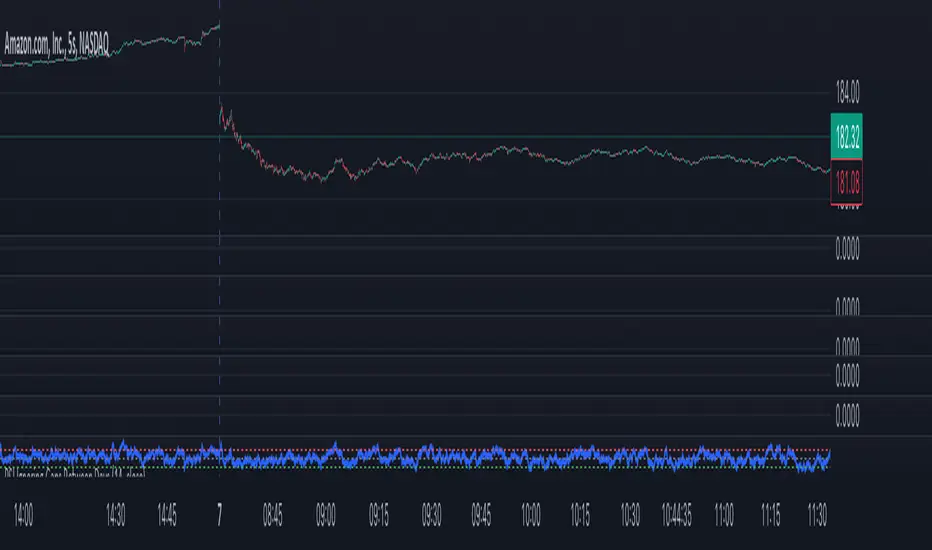
RSI Ignoring Gaps Between DaysThe RSI Ignoring Gaps Between Days indicator is an advanced modification of the traditional Relative Strength Index (RSI) designed to exclude price gaps that occur between the last bar of one trading day and the first bar of the next. This ensures that the RSI calculations remain focused on the actual price action during the trading session, avoiding distortions caused by overnight price gaps.
Key Features:
Gap Ignoring Mechanism: The indicator detects when a new day begins and skips the price change between the last bar of the previous day and the first bar of the current day. This ensures that only the intra-day price changes are included in the RSI calculation.
Intra-day Price Movement: The RSI calculations are based on real price changes within each trading day, providing a clearer reflection of momentum without interference from overnight events.
Dynamic RSI Calculation: The traditional RSI formula is preserved, but gains and losses are recalculated based on price changes from bar to bar within the same day.
Overbought/Oversold Levels: The indicator retains standard RSI overbought (70) and oversold (30) levels, allowing traders to easily identify potential reversal zones.
Alerts for Crossovers: Built-in alert conditions trigger when the RSI crosses key levels (30 or 70), signaling potential buying or selling opportunities.
This indicator is particularly useful for traders looking to focus on intra-day price action and avoid the influence of gaps caused by overnight market activity. It is suitable for intraday trading strategies where consistency in price movement measurement is crucial.
Fair Value Gaps (FVG)This indicator automatically detects Fair Value Gaps (FVGs) using the classic 3-candle structure (ICT-style).
It is designed for traders who want clean charts and relevant FVGs only, without the usual clutter from past sessions or tiny, meaningless gaps.
Key Features
• Bullish & Bearish FVG detection
Identifies imbalances where price fails to trade efficiently between candles.
• Automatic FVG removal when filled
As soon as price trades back into the gap, the box is deleted in real time – no more outdated zones on the chart.
• Only shows FVGs from the current session
At the start of each new session, all previous FVGs are cleared.
Perfect for intraday traders who only care about today’s liquidity map.
• Flexible minimum gap size filter
Avoid noise by filtering FVGs using one of three modes:
Ticks (based on market tick size)
Percent (relative to current price)
Points (absolute price distance)
• Right-extension option
Keep gaps extended forward in time or limit them to the candles that created them.
Why This Indicator?
Many FVG indicators overwhelm the chart with zones from previous days or tiny imbalances that don’t matter.
This version keeps things clean, meaningful, and real-time accurate, ideal for day traders who rely on market structure and liquidity.

TradeScope: MA Reversion • RVOL • Trendlines • GAPs • TableTradeScope is an all-in-one technical analysis suite that brings together price action, momentum, volume dynamics, and trend structure into one cohesive and fully customizable indicator.
An advanced, modular trading suite that combines moving averages, reversion signals, RSI/CCI momentum, relative volume, gap detection, trendline analysis, and dynamic tables — all within one powerful dashboard.
Perfect for swing traders, intraday traders, and analysts who want to read price strength, volume context, and market structure in real time.
⚙️ Core Components & Inputs
🧮 Moving Average Settings
Moving Average Type & Length:
Choose between SMA or EMA and set your preferred period for smoother or more reactive trend tracking.
Multi-MA Plotting:
Up to 8 customizable moving averages (each with independent type, color, and length).
Includes a “window filter” to show only the last X bars, reducing chart clutter.
MA Reversion Engine:
Detects when price has extended too far from its moving average.
Reversion Lookback: Number of bars analyzed to determine historical extremes.
Reversion Threshold: Sensitivity multiplier—lower = more frequent signals, higher = stricter triggers.
🔄 Trend Settings
Short-Term & Long-Term Trend Lookbacks:
Uses linear regression to detect the slope and direction of the short- and long-term trend.
Results are displayed in the live table with color-coded bias:
🟩 Bullish | 🟥 Bearish
📈 Momentum Indicators
RSI (Relative Strength Index):
Adjustable period; displays the current RSI value, overbought (>70) / oversold (<30) zones, and trending direction.
CCI (Commodity Channel Index):
Customizable length with color-coded bias:
🟩 Oversold (< -100), 🟥 Overbought (> 100).
Tooltip shows whether the CCI is trending up or down.
📊 Volume Analysis
Relative Volume (RVOL):
Estimates end-of-day projected volume using intraday progress and compares it against the 20-day average.
Displays whether today’s volume is expected to exceed yesterday’s, and highlights color by strength.
Volume Trend (Short & Long Lookbacks):
Visual cues for whether current volume is above or below short-term and long-term averages.
Estimated Full-Day Volume & Multiplier:
Converts raw volume into “X” multiples (e.g., 2.3X average) for quick interpretation.
🕳️ Gap Detection
Automatically identifies and plots bullish and bearish price gaps within a defined lookback period.
Gap Lookback: Defines how far back to search for gaps.
Gap Line Width / Visibility: Controls the thickness and display of gap lines on chart.
Displays the closest open gap in the live table, including its distance from current price (%).
🔍 ATR & Volatility
14-day ATR (% of price):
Automatically converts the Average True Range into a percent, providing quick volatility context:
🟩 Low (<3%) | 🟨 Moderate (3–5%) | 🟥 High (>5%)
💬 Candlestick Pattern Recognition
Auto-detects popular reversal and continuation patterns such as:
Bullish/Bearish Engulfing
Hammer / Hanging Man
Shooting Star / Inverted Hammer
Doji / Harami / Kicking / Marubozu / Morning Star
Each pattern is shown with contextual color coding in the table.
🧱 Pivot Points & Support/Resistance
Optional Pivot High / Pivot Low Labels
Adjustable left/right bar lengths for pivot detection
Theme-aware text and label color options
Automatically drawn diagonal trendlines for both support and resistance
Adjustable line style, color, and thickness
Detects and tracks touches for reliability
Includes breakout alerts (with optional volume confirmation)
🚨 Alerts
MA Cross Alerts:
Triggers when price crosses the fast or slow moving average within a tolerance band (default ±0.3%).
Diagonal Breakout Alerts:
Detects and alerts when price breaks diagonal trendlines.
Volume-Confirmed Alerts:
Filters breakouts where volume exceeds 1.5× the 20-bar average.
🧾 Live Market Table
A fully dynamic table displayed on-chart, customizable via input toggles:
Choose which rows to show (e.g., RSI, ATR, RVOL, Gaps, CCI, Trend, MA info, Diff, Low→Close%).
Choose table position (top-right, bottom-left, etc.) and text size.
Theme selection: Light or Dark
Conditional background colors for instant visual interpretation:
🟩 Bullish or Oversold
🟥 Bearish or Overbought
🟨 Neutral / Moderate
🎯 Practical Uses
✅ Identify confluence setups combining MA reversion, volume expansion, and RSI/CCI extremes.
✅ Track trend bias and gap proximity directly in your dashboard.
✅ Monitor relative volume behavior for intraday strength confirmation.
✅ Automate MA cross or breakout alerts to stay ahead of key price action.
🧠 Ideal For
Swing traders seeking confluence-based setups
Intraday traders monitoring multi-factor bias
Analysts looking for compact market health dashboards
💡 Summary
TradeScope is designed as a single-pane-of-glass market view — combining momentum, trend, volume, structure, and reversion into one clear visual system.
Fully customizable. Fully dynamic.
Use it to see what others miss — clarity, confluence, and confidence in every trade.

Imbalance (FVG)Indicator Description
This script is designed to automatically identify and visualize Fair Value Gaps (FVGs), also known as Imbalances, on your chart. An FVG is a key price action concept that highlights areas where the price moved swiftly, leaving a gap behind. This indicator is simple to use and fully customizable, making it an excellent tool for both novice and experienced traders.
Key Features
Automatic Detection: The indicator scans the market in real-time, automatically drawing FVG zones for both Bullish and Bearish moves.
Mitigation Tracking: When the price returns to an FVG zone, the indicator automatically marks it as "mitigated" (filled) by changing its color and style. This provides a clear signal that the imbalance has been neutralized.
Extend Zones Into the Future: Unmitigated FVG zones are automatically extended into the future, allowing them to be used as potential future support or resistance levels.
Full Customization: The user has complete control over the indicator's appearance. You can change the colors for bullish, bearish, and mitigated zones, as well as toggle their visibility on and off.
Performance Optimization: A built-in limit for the number of drawn objects prevents chart clutter and avoids errors from TradingView's drawing limits, ensuring smooth performance.
How to Use?
FVG zones can be used in various ways, including:
Price Magnets: Markets often tend to revert to "fill" these gaps.
Potential Entry Points: Price entering an FVG zone can present an opportunity to open a position, especially if confirming signals appear.
Support/Resistance Zones: Unfilled gaps can act as strong, dynamic levels of support or resistance.

[AN] GapierA colored gap finder.
It colors a gap until it gets closed. It displays an info for the current opened gaps (range).
Allows to change the gap timeframe
Allows you to overlay gaps of other symbol on the current one
There are some assets that really like to fill the gaps. Using this indicator you can have a better understanding on where the price is heading (on the current trend).

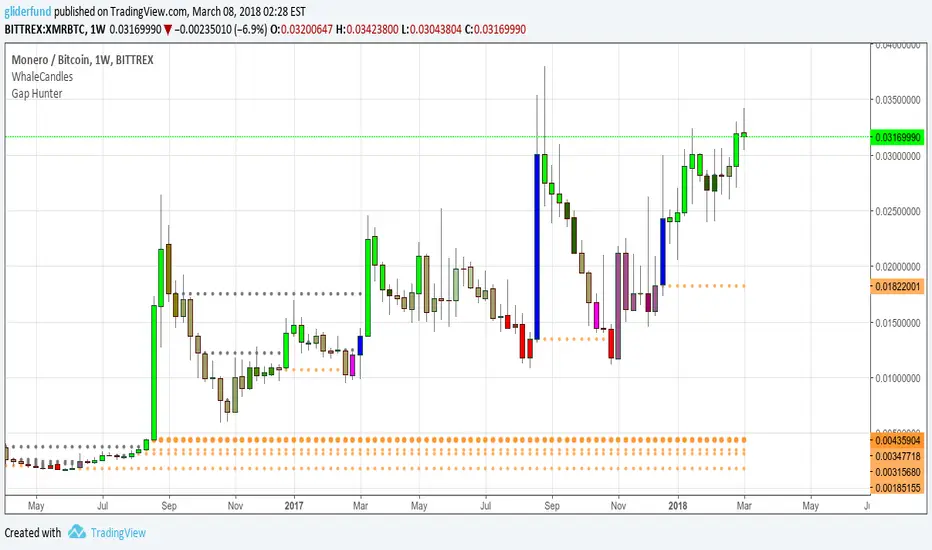
Gap HunterThis tool allows us to visually hunt for price gaps.
Here we consider 3 types of gaps in order to adapt the tool to diversity of trading styles:
Strict Gaps : A gap not filled with Candle Shadows.
Shadow Overlap and Close Price NOT Taken : A gap where shadows overlap and don't take previous close.
Shadow Overlap and Close Price Taken : A gap where shadows overlap and take previous close.
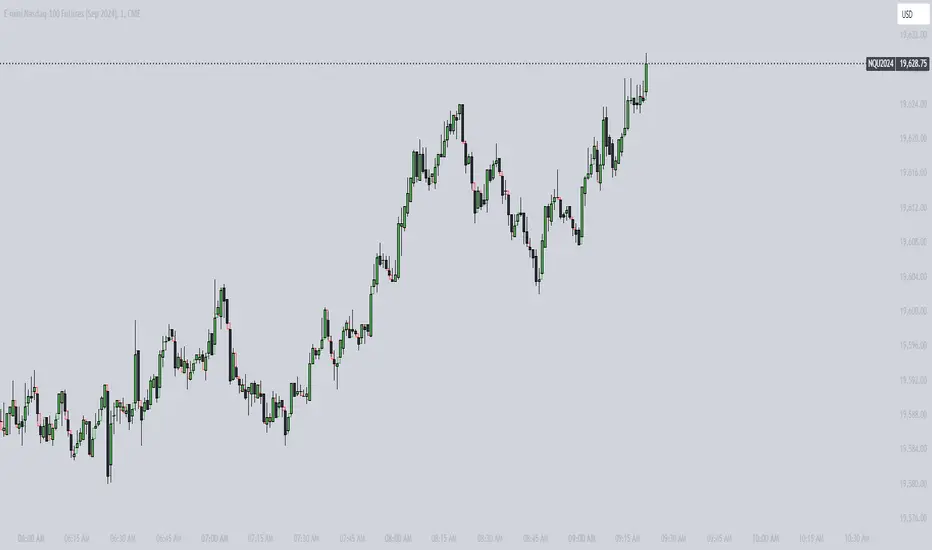
CM_Gap_Indicator_Intra-Day_V2.1CM_Gap_Indicator_Intra-Day_V2.1
Updated Intra-Day Gap Indicator.
Version 2.1…Many Additional Features To Come.
***Designed for Intra-Day Charts.
***Great for Stocks…Forex and Futures Sunday Night Gaps.
***Plots Green Lines If Gap Up (See Added Features Below)
***Plots Red Lines If Gap Down
MAJOR Feature Added:
***Added Check Boxes In Inputs Tab That Let’s You Choose if You Want To See All Gaps, Or Only Gaps That Open Above/Below Previous Days High/Low
Other Features Added:
***Gap Mid Lines
***Color Fill Based On Gap Up Or Down
Additional Features Coming!!!

ICT Vacuum BlocksThe indicator draws a box between the closing price of one candle and the opening price of the next whenever a gap occurs, helping traders easily spot potential areas of interest where the market has skipped over price levels. The boxes do not extend beyond the gap itself, keeping the chart clean and focused on the price action.
Features:
Detects both upward and downward gaps.
Non-extending boxes that accurately represent the size of each gap.
Customizable colors for up and down gaps to match your chart style.
Customizable Gap FinderThis is a fully customizable gap finder. You can change the color of just about anything, on top of hiding filled/old gaps. This is so you can spot those tiny gaps on something such as futures. Be sure to play around with the settings.

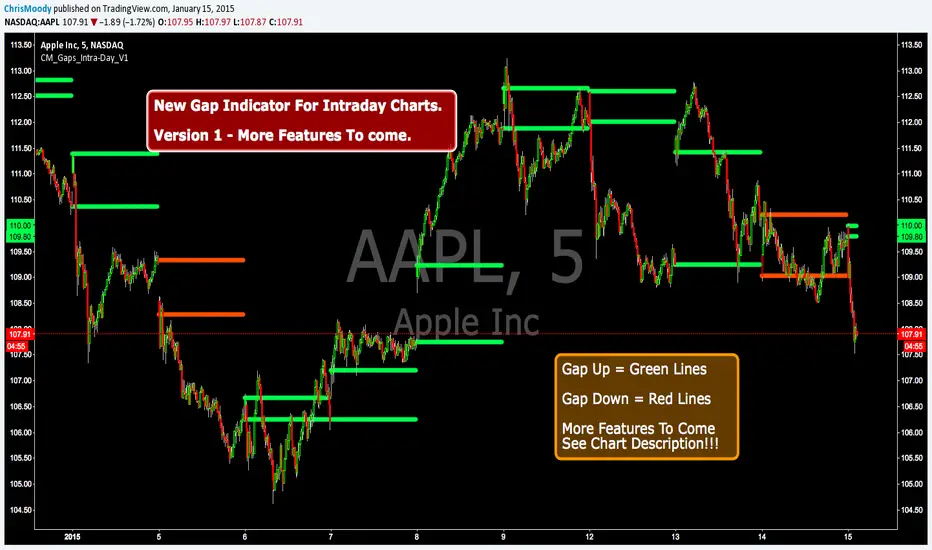
CM_Gap_Indicator_Intra-Day_V1CM_Gap_Indicator_Intra-Day_V1
This is a Simple Gap Indicator.
Version 1…Many Additional Features To Come.
***Designed for Intra-Day Charts.
***Great for Stocks…Forex and Futures Sunday Night Gaps.
***Plots Green Lines If Gap Up
***Plots Red Lines If Gap Down
Additional Filters Coming Soon:
***Minimum Gap% Filter
***Gap Mid Lines
***Color Coding On Filled Gaps
Wirmchen 2nd Day StatsThis is a stats script for calculating gaps and opportunities to trade them in the market
requested by user felhvbn

Efficiency GapsPaints inefficient candles ( where candles on both sides of a candle don't meet in the middle. )
Average True Range period and multiplier from 0.01 to 1 can be used to filter out small gaps.
Price is likely to return to these areas and they are possible support / resistance levels.
Combine with volume profile to detect low volume areas.

GapGap
I've seen many trade decisions based on the CME Bitcoin Futures gap, so this indicator will let you know if that strategy is good or not, so use it as another confirmation 👍🏻.
- Shows when a gap is created, when it is filled and if not filled if a new gap is created.
- You can also use another security as a reference.
- Multi Timeframe , by default it will search the daily gaps.


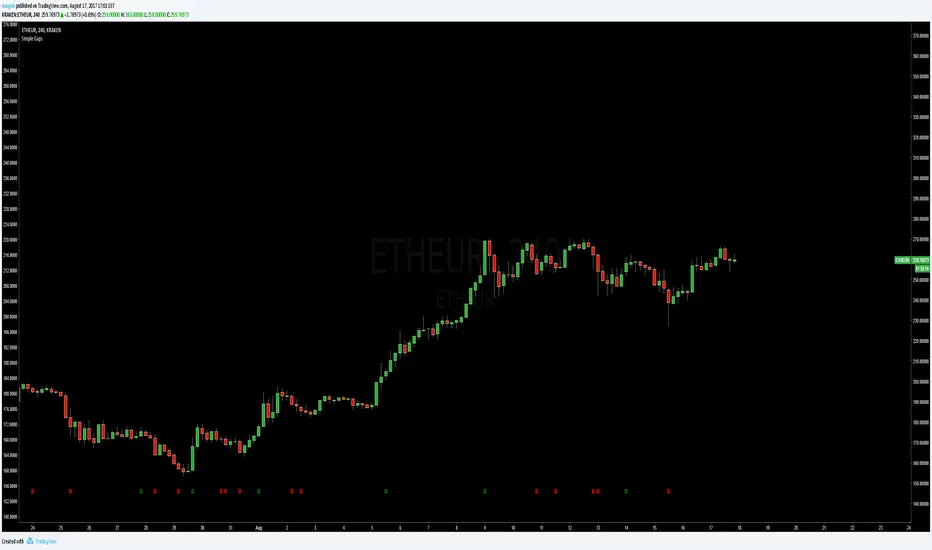
Simple GapsAuthor: maqpie
Date: 17th of August, 2017
Simple overlay showing gaps.
I am open to critique and improvement proposals for all my scripts.
If you like it give it a thumbs up and remember:
"It's nice to be important but ...
... more important to be nice!"
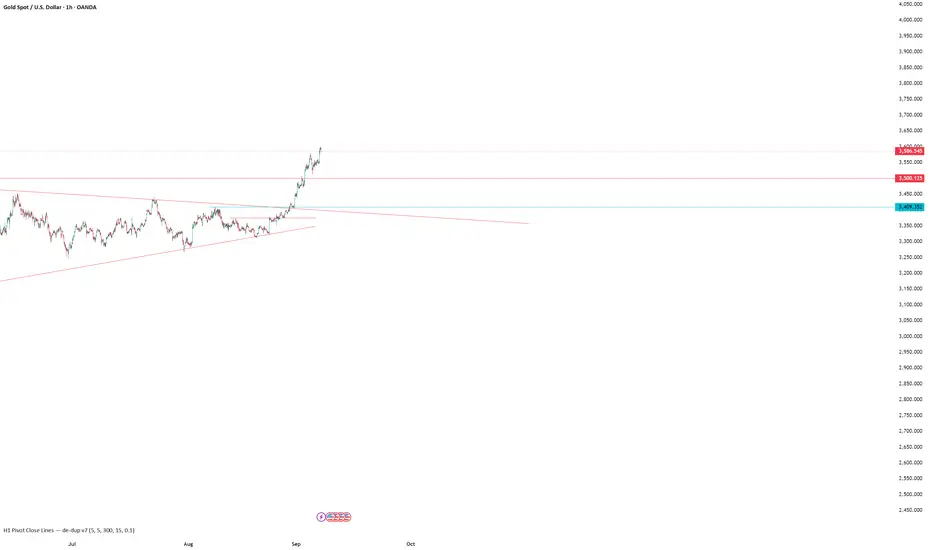
H1 Pivot Close Lines (Blue) — gaps_on v4H1 Pivot Close Lines (Blue) — gaps_on v4
Auto draw line for close price in pivot
Bitcoin CME gaps multi-timeframe auto finder1. Overview
The Bitcoin CME Gap Multi-Timeframe Detector automatically identifies price gaps in the Bitcoin CME (Chicago Mercantile Exchange) futures market and visually displays them on the TradingView chart.
Because the CME futures market closes for about an hour after each weekday session and remains closed over the weekend, price gaps frequently appear when trading resumes on Monday.
This indicator analyzes gaps across six major timeframes, from 5-minute to 1-day charts, allowing traders to easily identify structural imbalances and potential support/resistance zones.
It is the most accurate and feature-rich CME gaps indicator available on TradingView.
2. Key Features
■ Multi-Timeframe Gap Detection
Analyzes 5m, 15m, 30m, 1h, 4h, and 1D charts simultaneously.
This enables traders to observe both short-term volatility and mid-to-long-term structure, providing a multi-dimensional view of market dynamics.
■ Gap Direction Classification
Up Gap: When the next candle’s open is higher than the previous candle’s high (default color: green tone)
Down Gap: When the next candle’s open is lower than the previous candle’s low (default color: red tone)
Gaps are color-coded to intuitively visualize potential support and resistance zones.
■ Highlight Function
Gaps exceeding a user-defined threshold (%) are highlighted (default color: yellow).
This helps quickly identify zones with abnormal volatility or sharp price dislocations.
■ Labels and Box Extension
Each gap displays a percentage label indicating its relative size and significance.
Gap zones are extended to the right as boxes, allowing traders to visually track when and how the gap gets filled over time.
■ Alert System
When a gap forms on the selected timeframe (or across all timeframes), a TradingView alert is triggered.
This enables real-time response to significant gap events.
3. Trading Strategies
■ Gap Fill Behavior
CME gaps statistically tend to get filled over time.
Gap boxes help distinguish between filled and unfilled gaps at a glance.
Up Gap: Price tends to decline to fill the previous high–next open zone.
Down Gap: Price often rises later to fill the previous low–next open zone.
■ Support & Resistance Levels
Gap zones frequently act as strong support or resistance.
When price retests a gap area, observing the reaction of buyers and sellers can provide valuable trading insights.
Overlapping gap boxes across multiple timeframes indicate high-confidence support/resistance zones.
■ Market Sentiment & Volatility Analysis
Large gaps usually result from shifts in market sentiment or major news events.
This indicator allows traders to detect volatility spikes early and prepare for potential trend reversals.
■ Combination with Other Technical Tools
While fully functional on its own, this indicator works even better when combined with tools like moving averages (MA), RSI, MACD, or Fibonacci retracements.
For example, if the bottom of a gap coincides with the 0.618 Fibonacci level, it may signal a strong rebound zone.
4. Settings Options
Minimum Gap % | Sets the minimum percentage movement required to detect a gap (lower values show smaller gaps)
Display Timeframes | Choose which timeframes to display (5m, 15m, 30m, 1h, 4h, 1D)
Box Colors | Assign colors for up and down gaps
Box Extension (Bars) | Number of bars to extend gap boxes to the right
Show Labels | Toggle display of gap percentage labels
Label Position / Size | Adjust label position and size
Highlight Gap ≥ % | Highlight gaps exceeding a specified percentage
Highlight Colors | Set highlight color for labels and boxes
Enable Alerts | Enable or disable alerts
Alert Timeframe | Select timeframe(s) for alerts (“All” = all timeframes)
5. Summary
This indicator is a professional trading tool that provides quantitative and visual analysis of price gaps in the Bitcoin CME futures market.
By combining multi-timeframe detection, highlighting, and alert systems, it helps traders clearly identify zones of market imbalance and potential reversal areas.

Momentum-Based Fair Value Gaps [BackQuant]Momentum-Based Fair Value Gaps
A precision tool that detects Fair Value Gaps and color-codes each zone by momentum, so you can quickly tell which imbalances matter, which are likely to fill, and which may power continuation.
What is a Fair Value Gap
A Fair Value Gap is a 3-candle price imbalance that forms when the middle candle expands fast enough that it leaves a void between candle 1 and candle 3.
Bullish FVG : low > high . This marks a bullish imbalance left beneath price.
Bearish FVG : high < low . This marks a bearish imbalance left above price.
These zones often act as magnets for mean reversion or as fuel for trend continuation when price respects the gap boundary and runs.
Why add momentum
Not all gaps are equal. This script measures momentum with RSI on your chosen source and paints each FVG with a momentum heatmap. Strong-momentum gaps are more likely to hold or propel continuation. Weak-momentum gaps are more likely to fill.
Core Features
Auto FVG Detection with size filters in percent of price.
Momentum Heatmap per gap using RSI with smoothing. Multiple palettes: Gradient, Discrete, Simple, and scientific schemes like Viridis, Plasma, Inferno, Magma, Cividis, Turbo, Jet, plus Red-Green and Blue-White-Red.
Bull and Bear Modes with independent toggles.
Extend Until Filled : keep drawing live to the right until price fully fills the gap.
Auto Remove Filled for a clean chart.
Optional Labels showing the smoothed RSI value stored at the gap’s birth.
RSI-based Filters : only accept bullish gaps when RSI is oversold and bearish gaps when RSI is overbought.
Performance Controls : cap how many FVGs to keep on chart.
Alerts : new bullish or bearish FVG, filled FVG, and extreme RSI FVGs.
How it works
Source for Momentum : choose Returns, Close, or Volume.
Returns computes percent change over a short lookback to focus on impulse quality.
RSI and Smoothing : RSI length and a small SMA smooth the signal to stabilize the color coding.
Gap Scan : each bar checks for a 3-candle bullish or bearish imbalance that also clears your minimum size filter in percent of price.
Heatmap Color : the gap is painted at creation with a color from your palette based on the smoothed RSI value, preserving the momentum signature that formed it.
Lifecycle : if Extend Unfilled is on, the zone projects forward until price fully trades through the far edge. If Auto Remove is on, a filled gap is deleted immediately.
How to use it
Scan for structure : turn on both bullish and bearish FVGs. Start with a moderate Min FVG Size percent to reduce noise. You will see stacked clusters in trends and scattered singletons in chop.
Read the colors : brighter or stronger palette values imply stronger momentum at gap formation. Weakly colored gaps are lower conviction.
Decide bias : bullish FVGs below price suggest demand footprints. Bearish FVGs above price suggest supply footprints. Use the heatmap and RSI value to rank importance.
Choose your playbook :
Mean reversion : target partial or full fills of opposing FVGs that were created on weak momentum or that sit against higher timeframe context.
Trend continuation : look for price to respect the near edge of a strong-momentum FVG, then break away in the direction of the original impulse.
Manage risk : in continuation ideas, invalidation often sits beyond the opposite edge of the active FVG. In reversion ideas, invalidation sits beyond the gap that should attract price.
Two trade playbooks
Continuation - Buy the hold of a bullish FVG
Context uptrend.
A bullish FVG prints with strong RSI color.
Price revisits the top of the gap, holds, and rotates up. Enter on hold or first higher low inside or just above the gap.
Invalidation: below the gap bottom. Targets: prior swing, measured move, or next LV area.
Reversion - Fade a weak bearish FVG toward fill
Context range or fading trend.
A bearish FVG prints with weak RSI color near a completed move.
Price fails to accelerate lower and rotates back into the gap.
Enter toward mid-gap with confirmation.
Invalidation: above gap top. Target: opposite edge for a full fill, or the gap midline for partials.
Key settings
Max FVG Display : memory cap to keep charts fast. Try 30 to 60 on intraday.
Min FVG Size % : sets a quality floor. Start near 0.20 to 0.50 on liquid markets.
RSI Length and Smooth : 14 and 3 are balanced. Increase length for higher timeframe stability.
RSI Source :
Returns : most sensitive to true momentum bursts
Close : traditional.
Volume : uses raw volume impulses to judge footprint strength.
Filter by RSI Extremes : tighten rules so only the most stretched gaps print as signals.
Heatmap Style and Palette : pick a palette with good contrast for your background. Gradient for continuous feel, Discrete for quick zoning, Simple for binary, Palette for scientific schemes.
Extend Unfilled - Auto Remove : choose live projection and cleanup behavior to match your workflow.
Reading the chart
Bullish zones sit beneath price. Respect and hold of the upper boundary suggests demand. Strong green or warm palette tones indicate impulse quality.
Bearish zones sit above price. Respect and hold of the lower boundary suggests supply. Strong red or cool palette tones indicate impulse quality.
Stacking : multiple same-direction gaps stacked in a trend create ladders. Ladders often act as stepping stones for continuation.
Overlapping : opposing gaps overlapping in a small region usually mark a battle zone. Expect chop until one side is absorbed.
Workflow tips
Map higher timeframe trend first. Use lower timeframe FVGs for entries aligned with the higher timeframe bias.
Increase Min FVG Size percent and RSI length for noisy symbols.
Use labels when learning to correlate the RSI numbers with your palette colors.
Combine with VWAP or moving averages for confluence at FVG edges.
If you see repeated fills and refills of the same zone, treat that area as fair value and avoid chasing.
Alerts included
New Bullish FVG
New Bearish FVG
Bullish FVG Filled
Bearish FVG Filled
Extreme Oversold FVG - bullish
Extreme Overbought FVG - bearish
Practical defaults
RSI Length 14, Smooth 3, Source Returns.
Min FVG Size 0.25 percent on liquid majors.
Heatmap Style Gradient, Palette Viridis or Turbo for contrast.
Extend Unfilled on, Auto Remove on for a clean live map.
Notes
This tool does not predict the future. It maps imbalances and momentum so you can frame trades with clearer context, cleaner invalidation, and better ranking of which gaps matter. Use it with risk control and in combination with your broader process.

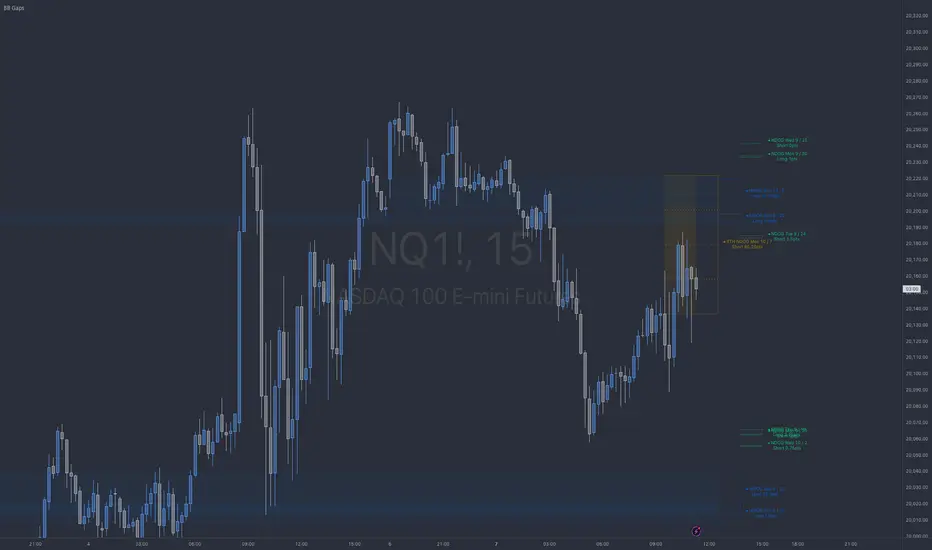
BB NWOG - NDOG - RTH NDOGThe BB Gaps Indicator is a comprehensive tool designed for traders looking to track and visualize significant opening gaps within various market sessions, including:
• New Day Opening Gaps (NDOGs): These gaps form between the closing price of the previous day and the opening price of the new day, providing insight into potential liquidity pools or imbalances.
• RTH New Day Opening Gaps (RTH NDOGs): This focuses on gaps that occur during Regular Trading Hours (RTH), capturing gaps between session closures and the next day’s open, ideal for intraday traders.
• New Week Opening Gaps (NWOGs): These gaps track the price differential between the last candle of the week and the first candle of the new trading week, providing a broader market perspective for swing traders.
Key Features:
• Dynamic Plotting: Visualize gaps with customizable extensions, box fills, and mid-range (50%) or quarter-range (25%, 75%) levels.
• Sidecar Labels: Handy sidecar labels display the gap information right on the chart for easy reference.
• Multiple Session Support: Track gaps across different trading sessions (Daily, RTH, Weekly) with adjustable plot extensions and fill styles.
• Configurable Limits: Set a maximum number of gaps to plot, ensuring your chart remains clean and clutter-free.