GODMODE V2.3 ULTIMATE══════════════════════════════════════════════════════════════
⚡ GODMODE V2.3 ULTIMATE ⚡
══════════════════════════════════════════════════════════════
Institutional-grade precision. Unmatched power.
The most advanced trading system ever built.
══════════════════════════════════════════════════════════════
█░█ █░░ ▀█▀ █ █▀▄▀█ ▄▀█ ▀█▀ █▀▀
█▄█ █▄▄ ░█░ █ █░▀░█ █▀█ ░█░ ██▄
────────────────────────────────
⚡ SMART MONEY CONCEPTS (SMC)
────────────────────────────────
✦ Order Block Detection
Auto-identifies bullish & bearish order blocks
Institutional buying/selling zones revealed
✦ Fair Value Gaps (FVG)
Automatically plots imbalance zones
High-probability reversal areas highlighted
✦ Break of Structure (BOS)
Real-time structure break detection
Trend continuation confirmation
✦ Change of Character (CHoCH)
Trend reversal early warning system
Catch reversals before they happen
✦ Liquidity Levels
Equal Highs/Lows detection (EQH/EQL)
Know where liquidity pools form
✦ Premium/Discount Zones
Daily range equilibrium plotted
Buy in discount, sell in premium
────────────────────────────────
📊 MULTI-TIMEFRAME ANALYSIS
────────────────────────────────
✦ 4-Timeframe Trend Dashboard
Current TF + 3 higher timeframes
Instant trend alignment visibility
✦ MTF Confluence Scoring
Signals only fire when timeframes align
Dramatically reduces false signals
✦ MTF Filter Toggle
Enable/disable for different strategies
Full control over signal filtering
✦ Custom Timeframe Selection
Choose your own MTF combination
Adapt to any trading style
────────────────────────────────
🎯 ADVANCED SIGNAL ENGINE
────────────────────────────────
✦ Multi-Confluence Buy/Sell Signals
5+ conditions must align to trigger
Institutional-quality entries
✦ RSI Confluence Filter
Eliminates overbought/oversold traps
Adjustable thresholds
✦ Volume Confirmation Filter
Validates signals with volume spikes
Customizable sensitivity
✦ MTF Trend Filter
Only trades with higher TF trend
Dramatically improves win rate
✦ Session Filter
Optional: Only signal during active hours
Avoid low-liquidity traps
✦ Signal Strength Score (0-100%)
Know exactly how strong each setup is
10+ factors calculated in real-time
✦ Anti-Repaint Mode
Signals only confirm on bar close
What you see is what you get
────────────────────────────────
🔮 PREDICTION SYSTEM
────────────────────────────────
✦ AI-Powered Prediction Line
Linear regression projection
Glowing trajectory visualization
✦ Dynamic Target Calculation
Updates with every tick
Adapts to volatility
✦ Directional Confidence
Bullish/Bearish/Neutral status
Clear actionable signals
────────────────────────────────
💰 MULTI-TARGET SYSTEM
────────────────────────────────
✦ TP1 / TP2 / TP3 Zones
Three take-profit levels
Scale out for maximum profit
✦ ATR-Based Calculations
Volatility-adjusted targets
Works on any market/timeframe
✦ Holographic Zone Display
Glowing TP/SL bands
Visually stunning presentation
✦ Customizable Multipliers
Set your own R:R preferences
Full control over risk
────────────────────────────────
🧮 POSITION SIZE CALCULATOR
────────────────────────────────
✦ Account Size Input
Enter your account balance
✦ Risk Percentage Setting
Define risk per trade (0.1-10%)
✦ Auto Position Sizing
Calculates exact position size
Based on SL distance
✦ Risk Amount Display
Shows dollar amount at risk
No more manual calculations
────────────────────────────────
📈 PERFORMANCE STATISTICS
────────────────────────────────
✦ Live Win Rate Tracker
Real-time accuracy percentage
Based on TP/SL hits
✦ Total Signals Counter
Track signal frequency
✦ Wins/Losses Display
Running W/L tally
✦ Current Streak
Track hot/cold streaks
Positive and negative
✦ Average R:R
Overall risk-reward performance
Measure your edge
────────────────────────────────
📊 KEY LEVELS
────────────────────────────────
✦ Previous Day High/Low (PDH/PDL)
Critical institutional levels
✦ Previous Week High/Low (PWH/PWL)
Swing trading reference points
✦ VWAP (Volume Weighted Average)
Institutional benchmark price
✦ Equilibrium Line
Daily range midpoint
Premium/Discount reference
────────────────────────────────
⏰ SESSIONS & KILLZONES
────────────────────────────────
✦ 4 Major Sessions
London • New York • Tokyo • Sydney
Color-coded backgrounds
✦ Killzone Highlighting
High-probability trading windows
London/NY overlap emphasized
✦ Session Dashboard Display
Current session shown in panel
Never miss prime trading hours
✦ Customizable Times
Adjust session hours to your zone
Full UTC time control
────────────────────────────────
🎨 5 PREMIUM COLOR THEMES
────────────────────────────────
✦ NEON (Default)
Cyan & Purple
Electric, vibrant aesthetic
✦ STEALTH
Grayscale tones
Minimal, professional look
✦ OCEAN
Blue spectrum
Cool, calming visuals
✦ SUNSET
Orange & Pink
Warm, energetic feel
✦ MATRIX
Green monochrome
Hacker aesthetic
────────────────────────────────
⚙️ 3 TRADING MODES
────────────────────────────────
✦ SCALP MODE
Fast MAs (9/21)
1m - 15m timeframes
Quick entries & exits
✦ SWING MODE
Balanced MAs (50/100)
1H - 4H timeframes
Ride the trends
✦ POSITION MODE
Slow MAs (100/200)
Daily+ timeframes
Long-term holds
────────────────────────────────
🎚️ 3 SIGNAL STYLES
────────────────────────────────
✦ AGGRESSIVE
More signals, faster triggers
For active traders
✦ BALANCED (Default)
Optimal signal frequency
Best risk/reward balance
✦ CONSERVATIVE
Fewer signals, higher quality
For patient traders
────────────────────────────────
💎 PREMIUM VISUALS
────────────────────────────────
✦ Neon Glow Moving Averages
Multi-layer glowing effect
Stunning trend visualization
✦ Breathing Gradient Ribbon
Opacity pulses with trend strength
Alive, dynamic display
✦ Trend Zone Background
Subtle chart tinting
Instant trend recognition
✦ Signal Burst Effects
Expanding rings on signals
Satisfying visual feedback
✦ Price Comet Trail
Fading dots follow price
Elegant motion effect
✦ Trend-Colored Candles
Candles match trend direction
Immersive chart experience
✦ Stealth Mode
Hide all visuals instantly
Clean chart when needed
────────────────────────────────
📱 TRIPLE DASHBOARD SYSTEM
────────────────────────────────
✦ MAIN DASHBOARD
12-row comprehensive panel
Trend, Power, RSI, Volume
Momentum, Session, Zone
Structure, Signal, Target
✦ MTF PANEL
4-timeframe trend arrows
Instant confluence check
✦ STATS PANEL
Win rate, W/L, Streak
Average R:R tracking
────────────────────────────────
🔔 ADVANCED ALERTS
────────────────────────────────
✦ Buy Signal Alert
✦ Sell Signal Alert
✦ Strong Buy (80%+ Power)
✦ Strong Sell (80%+ Power)
✦ BOS Bullish Alert
✦ BOS Bearish Alert
✦ CHoCH Bullish Alert
✦ CHoCH Bearish Alert
✦ Killzone Signal Alert
✦ MTF Confluence Alert
All alerts webhook-ready.
Compatible with trading bots.
────────────────────────────────
🛡️ SAFETY FEATURES
────────────────────────────────
✦ Anti-Repaint Mode
Signals confirm on bar close only
Guaranteed accuracy
✦ Stealth Mode
Instant minimal UI toggle
Clean charts when needed
✦ Customizable Everything
Every feature can be toggled
Make it yours
────────────────────────────────
🎬 ACTIVATION EXPERIENCE
────────────────────────────────
✦ Cinematic Startup Animation
"GODMODE V2.3 ULTIMATE ACTIVATED"
Pulsing gold & cyan text
✦ Mode & Theme Display
Shows your configuration
Premium onboarding experience
✦ Watermark Branding
Subtle bottom-left signature
Professional appearance
══════════════════════════════════════════════════════════════
█░█░█ █▀█ █▀█ █▄▀ █▀ █▀█ █▄░█
▀▄▀▄▀ █▄█ █▀▄ █░█ ▄█ █▄█ █░▀█
✓ All Markets (Forex, Crypto, Stocks, Futures, Indices)
✓ All Timeframes (1m to Monthly)
✓ TradingView Desktop & Mobile
✓ Works on Free & Paid TV accounts
══════════════════════════════════════════════════════════════
█▀▀ █▀█ █▀▄▀█ █▀█ ▄▀█ █▀█ █ █▀ █▀█ █▄░█
█▄▄ █▄█ █░▀░█ █▀▀ █▀█ █▀▄ █ ▄█ █▄█ █░▀█
┌─────────────────────────────────────────────────────────────┐
│ FEATURE │ PRO $50 │ ULTIMATE $99 │
├─────────────────────────────────────────────────────────────┤
│ Neon Glow Visuals │ ✓ │ ✓ │
│ Breathing Ribbon │ ✓ │ ✓ │
│ Signal Bursts │ ✓ │ ✓ │
│ Buy/Sell Signals │ ✓ │ ✓ │
│ RSI + Volume Filters │ ✓ │ ✓ │
│ TP/SL Zones │ Single │ TP1/TP2/TP3 │
│ Sessions │ Basic │ + Killzones │
│ Key Levels │ PDH/PDL │ + PWH/PWL │
│ Dashboard │ Standard │ Triple │
│ Modes │ 2 │ 3 │
│ Signal Styles │ — │ 3 │
│ Color Themes │ 1 │ 5 │
│ Smart Money (SMC) │ ✗ │ ✓ │
│ Order Blocks │ ✗ │ ✓ │
│ Fair Value Gaps │ ✗ │ ✓ │
│ BOS / CHoCH │ ✗ │ ✓ │
│ Liquidity Levels │ ✗ │ ✓ │
│ Premium/Discount │ ✗ │ ✓ │
│ Multi-Timeframe Analysis │ ✗ │ 4 TFs │
│ MTF Confluence Filter │ ✗ │ ✓ │
│ Position Size Calculator │ ✗ │ ✓ │
│ Performance Stats │ ✗ │ ✓ │
│ Win Rate Tracking │ ✗ │ ✓ │
│ VWAP │ ✗ │ ✓ │
│ Anti-Repaint Mode │ ✗ │ ✓ │
│ Stealth Mode │ ✗ │ ✓ │
│ MTF Panel │ ✗ │ ✓ │
│ Stats Panel │ ✗ │ ✓ │
│ Advanced Alerts │ 5 │ 10 │
│ Lifetime Updates │ ✗ │ ✓ │
│ Priority Support │ ✗ │ ✓ │
└─────────────────────────────────────────────────────────────┘
══════════════════════════════════════════════════════════════
█░█░█ █░█ ▄▀█ ▀█▀ █▄█ █▀█ █░█ █▀▀ █▀▀ ▀█▀
▀▄▀▄▀ █▀█ █▀█ ░█░ ░█░ █▄█ █▄█ █▄█ ██▄ ░█░
⚡ Lifetime access to GODMODE V2.3 ULTIMATE
⚡ All current features unlocked
⚡ All future updates FREE forever
⚡ Works on unlimited charts/symbols
⚡ Full customization control
⚡ Priority support via DM
⚡ Private Discord community access
⚡ Early access to V3.0
══════════════════════════════════════════════════════════════
█▀▀ ▄▀█ █▀█
█▀░ █▀█ ▀▀█
Q: Does this repaint?
A: No. Anti-Repaint Mode confirms signals on bar close only.
Q: What markets does this work on?
A: All markets — Forex, Crypto, Stocks, Futures, Indices, Commodities.
Q: What timeframe is best?
A: Scalp Mode for 1m-15m. Swing Mode for 1H-4H. Position Mode for Daily+.
Q: What are Smart Money Concepts?
A: Institutional trading strategies — Order Blocks, FVGs, BOS, CHoCH, Liquidity.
Q: How does MTF filtering work?
A: Signals only fire when your current timeframe aligns with 2+ higher timeframes.
Q: Can I customize everything?
A: Yes. Every visual, filter, level, and setting can be toggled and adjusted.
Q: Do I get future updates?
A: Yes. Lifetime updates included. V3.0 early access for ULTIMATE users.
Q: How do I get access?
A: After purchase, DM your TradingView username. Access granted within 24 hours.
Q: Is there a refund policy?
A: Due to digital nature, all sales are final. Test the PRO version first if unsure.
══════════════════════════════════════════════════════════════
▀█▀ █▀▀ █▀ ▀█▀ █ █▀▄▀█ █▀█ █▄░█ █ ▄▀█ █░░ █▀
░█░ ██▄ ▄█ ░█░ █ █░▀░█ █▄█ █░▀█ █ █▀█ █▄▄ ▄█
"Finally an indicator that actually looks as good as it performs.
The SMC features alone are worth $99."
"MTF confluence filter changed my trading. Win rate went from
45% to 67% in two weeks."
"Best purchase I've made for my trading. The dashboard tells
me everything I need at a glance."
══════════════════════════════════════════════════════════════
⚡ GODMODE V2.3 ULTIMATE — $99 ⚡
Lifetime access. Unlimited power.
Trade like an institution.
══════════════════════════════════════════════════════════════
Pesquisar nos scripts por "gaps"

Mizan v12: The Void Hunter (Ontological Liquidity)Title: Mizan v12: The Void Hunter (Ontological Liquidity Engine)
Overview: Mizan v12 is an advanced market structure tool that identifies Liquidity Voids (Fair Value Gaps) and uses a proprietary L-Score Engine to predict price reversion or continuation. Based on the philosophy of "Ontological Potential," it assumes that unfilled gaps act as magnets, pulling the price toward areas where market orders were not fully realized.
Technical Components:
The L-Score Engine: A composite momentum and volume index using normalized CCI (Velocity), RSI (Saturation), and CMF (Mass). It determines whether a "Displacement" move has enough gravity to sustain its direction.
Void Detection (FVG): The script dynamically identifies voids where a gap exists between the wicks of the 1st and 3rd candle. These are visualized as colored boxes.
Mitigation Logic: To keep the chart clean, the indicator automatically "mitigates" (deletes) void boxes once the price has retraced and filled the gap.
The Magnet Effect: It calculates the nearest active void above and below the current price, providing clear targets for take-profits or entry zones.
Operational Status:
Hunting Void: L-Score confirms momentum toward the nearest unfilled gap.
Reversion Completed: Price has successfully retraced into a void and is showing signs of a bounce.
Displacement: A strong impulse move that is leaving new voids behind, indicating a high-velocity trend.

Aurum Shadow LevelsDynamic institutional levels that combine order blocks, liquidity voids, and fair value gaps with a real volume filter. They update in real time and highlight the zones where large players accumulate or distribute without retail noticing.
--
Niveles institucionales dinámicos que combinan order blocks, liquidity voids y fair value gaps con un filtro de volumen real. Se actualizan en tiempo real y marcan las zonas donde los grandes jugadores acumulan o distribuyen sin que el retail lo note.

REM Algo - Earnings AlertsNot everyone wants to hold positions through earnings announcements — and if you’re evaluating a strategy, earnings-related gaps can distort performance metrics and make results harder to interpret.
This script helps you manage earnings risk by triggering alerts during an Earnings Blackout window. You can:
get an alert to close positions the day before earnings, and/or
receive a reminder not to open new positions on blackout days prior to the earnings announcement.
Add alerts to the stocks you trade. When a blackout day occurs, the script triggers at the hour and minute you choose in the settings. The Earnings Blackout period covers the day before and the day of the earnings announcement, adjusted for weekends and market holidays.
Use it as a standalone risk-control tool — or alongside your existing strategy — so earnings gaps don’t interfere with your trading rules or your backtest results.

Koma-Indikator v2272,19
USD
+0,35
+0,13%
Apple, Inc. engages in the design, manufacture, and sale of smartphones, personal computers, tablets, wearables and accessories, and other varieties of related services. It operates through the following geographical segments: Americas, Europe, Greater China, Japan, and Rest of Asia Pacific. The Americas segment includes North and South America. The Europe segment consists of European countries, as well as India, the Middle East, and Africa. The Greater China segment comprises China, Hong Kong, and Taiwan. The Rest of Asia Pacific segment includes Australia and Asian countries. Its products and services include iPhone, Mac, iPad, AirPods, Apple TV, Apple Watch, Beats products, AppleCare, iCloud, digital content stores, streaming, and licensing services. The company was founded by Steven Paul Jobs, Ronald Gerald Wayne, and Stephen G. Wozniak in April 1976 and is headquartered in Cupertino, CA.
Es sind noch 14 Min. für die Script-Bearbeitung übrig
in dieser Minute
Koma-Indikator v2
Zu Favoriten hinzufügen
Auf Chart verwenden
0
0
Functional Overview: Koma-Indikator V2
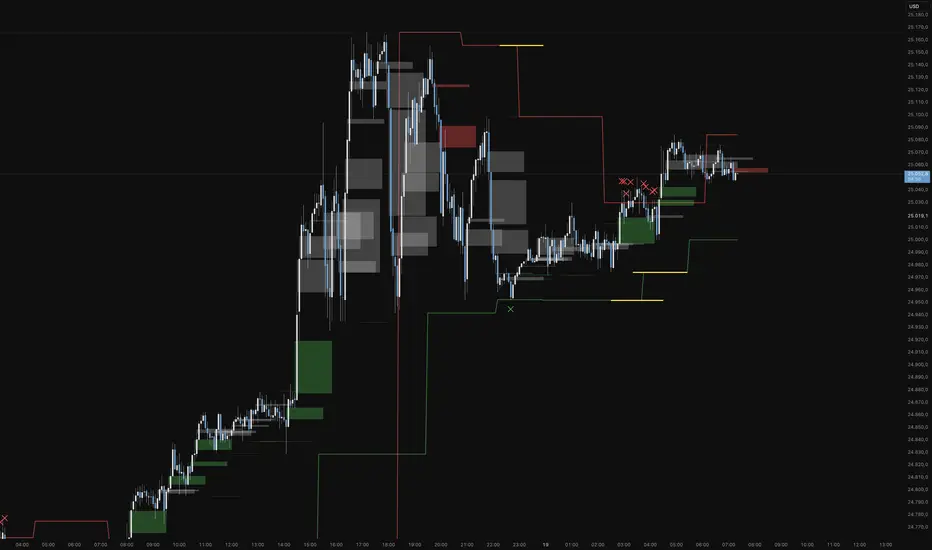
This indicator is a specialized analytical tool for Smart Money Concepts (SMC) trading. It is designed to automatically identify trend reversals, liquidity pools, and order flow shifts within the chart.
1. Liquidity Identification (BSL/SSL)
Major Range: The script automatically calculates significant highs and lows based on the "Major Lookback" period.
Buy-Side & Sell-Side Liquidity: These levels are plotted as red (BSL) and green (SSL) lines, serving as primary targets where the market often "hunts" for liquidity.
2. Sweep Detection (Liquidity Grabs)
The indicator detects when the price briefly exceeds a major high or low but closes back within the range.
Visuals: These potential reversal points are marked with an "X" icon above or below the candle (Sweep H/L).
3. Automated Market Structure Shifts (MSS)
The core logic tracks direction changes on two distinct levels:
Major MSS (Bold Yellow Line): Signals a significant trend reversal following a liquidity sweep. This is the primary confirmation for a new trend.
Minor MSS (Dotted Yellow Line): Highlights smaller structural breaks within a trend—ideal for aggressive "Sniper" entries on lower timeframes.
4. Dynamic Fair Value Gaps (FVG) & iFVGs
FVG Recognition: The indicator automatically draws boxes for bullish (green) and bearish (red) price imbalances.
Change in Delivery (iFVG): When a price candle closes through an existing FVG box, the box turns gray. This signals an Inverted FVG (iFVG), indicating that the order flow has officially shifted in the new direction.
5. Customization (Inputs)
Sensitivity: Users can adjust the lookback periods for both Trend (Major) and Entries (Minor) to suit different assets or timeframes.
Visual Hierarchy: All colors, line widths, and box lengths are configurable to maintain a clean and professional chart layout.
Trading Application:
By automating the "grunt work" of structural analysis, this tool allows you to focus on the trade execution:
Locate Liquidity: Identify BSL/SSL lines.
Watch for the Sweep: Look for the "X" marks.
Confirm the Shift: Wait for the yellow MSS lines.
Execute via Order Flow: Use the gray iFVG boxes as your Point of Interest (POI).
Geschütztes Skript
Dieses Script ist als Closed-Source veröffentlicht. Sie können es kostenlos und ohne Einschränkungen verwenden – erfahren Sie hier mehr.
Phantomas1
Haftungsausschluss
Die Informationen und Veröffentlichungen sind nicht als Finanz-, Anlage-, Handels- oder andere Arten von Ratschlägen oder Empfehlungen gedacht, die von TradingView bereitgestellt oder gebilligt werden, und stellen diese nicht dar. Lesen Sie mehr in den Nutzungsbedingungen.
Skript bearbeiten
Minimieren
Schließen
Koma-Indikator v2
Functional Overview: Koma-Indikator V2
This indicator is a specialized analytical tool for Smart Money Concepts (SMC) trading. It is designed to automatically identify trend reversals, liquidity pools, and order flow shifts within the chart.
1. Liquidity Identification (BSL/SSL)
Major Range: The script automatically calculates significant highs and lows based on the "Major Lookback" period.
Buy-Side & Sell-Side Liquidity: These levels are plotted as red (BSL) and green (SSL) lines, serving as primary targets where the market often "hunts" for liquidity.
2. Sweep Detection (Liquidity Grabs)
The indicator detects when the price briefly exceeds a major high or low but closes back within the range.
Visuals: These potential reversal points are marked with an "X" icon above or below the candle (Sweep H/L).
3. Automated Market Structure Shifts (MSS)
The core logic tracks direction changes on two distinct levels:
Major MSS (Bold Yellow Line): Signals a significant trend reversal following a liquidity sweep. This is the primary confirmation for a new trend.
Minor MSS (Dotted Yellow Line): Highlights smaller structural breaks within a trend—ideal for aggressive "Sniper" entries on lower timeframes.
4. Dynamic Fair Value Gaps (FVG) & iFVGs
FVG Recognition: The indicator automatically draws boxes for bullish (green) and bearish (red) price imbalances.
Change in Delivery (iFVG): When a price candle closes through an existing FVG box, the box turns gray. This signals an Inverted FVG (iFVG), indicating that the order flow has officially shifted in the new direction.
5. Customization (Inputs)
Sensitivity: Users can adjust the lookback periods for both Trend (Major) and Entries (Minor) to suit different assets or timeframes.
Visual Hierarchy: All colors, line widths, and box lengths are configurable to maintain a clean and professional chart layout.
Trading Application:
By automating the "grunt work" of structural analysis, this tool allows you to focus on the trade execution:
Locate Liquidity: Identify BSL/SSL lines.
Watch for the Sweep: Look for the "X" marks.
Confirm the Shift: Wait for the yellow MSS lines.
Execute via Order Flow: Use the gray iFVG boxes as your Point of Interest (POI).
Fortfahren
ICT Unicorn Model [Kodexius]ICT Unicorn Model is a market structure and imbalance confluence tool that automatically detects high probability “Unicorn” setups by combining three key elements into a single, clean script:
-A first, clean break of that swing level (displacement style break)
-A Fair Value Gap that overlaps a breaker candle body range
Instead of plotting every pivot or every imbalance independently, the script waits for a specific sequence: price establishes a valid swing, breaks that swing for the first time, and prints a setup only when the resulting context aligns with a valid, volatility filtered FVG and a clearly defined breaker range.
Each detected setup is drawn directly on the chart with labeled zones (Breaker and FVG) and is then actively monitored. If price violates the breaker boundary based on your chosen invalidation basis (Close or Wick), the setup is marked inactive and can optionally be removed to keep the chart clean.
This indicator is designed for traders who work with ICT style concepts such as liquidity runs, displacement, breaker blocks, and imbalance reversion, and who want a structured, rules based visualization rather than discretionary drawing.
🔹 Features
🔸 Fair Value Gap Detection With Volatility Filtering
Bullish and bearish FVGs are detected using classic three candle imbalance logic. To avoid low quality gaps during compression, the script applies an ATR based minimum size filter using the “FVG Min Size (ATR Multiplier)” input. Only gaps larger than ATR * threshold are considered valid.
🔸 First Break Validation (Clean Break Logic)
A key part of the model is identifying a “first break” of a swing level. The script checks whether the swing price has already been invalidated between the swing bar and the current bar. If it has, the swing is ignored. This helps reduce repeated signals and focuses on fresh structural breaks.
🔸 Breaker and FVG Confluence With Overlap Requirement
After a valid break occurs, the script defines a breaker range using the body of the swing candle (open and close). A setup is only created if this breaker body range overlaps the detected FVG price range. This overlap requirement is what filters many “almost” conditions and keeps signals more selective.
Bullish Unicorn:
Bearish Unicorn:
🔸 Configurable Invalidation Basis (Close or Wick)
You can choose how a setup fails:
-Close: invalidation requires a candle close beyond the breaker boundary
-Wick: invalidation occurs as soon as any wick crosses beyond the breaker boundary
This allows the tool to adapt to different trading styles, from conservative confirmation to more sensitive risk control.
🔸 Automatic Cleanup of Failed Setups
If “Delete Invalidated Setups” is enabled, the script removes the breaker box, FVG box, and label as soon as the setup is invalidated. If disabled, the zones remain visible for review while the setup is marked inactive internally.
🔸 Clear Chart Visuals
Each setup plots:
-A labeled Breaker zone box
-A labeled FVG zone box
-A directional Unicorn label (Bull or Bear) that updates position as the chart advances
Colors for bullish and bearish structures are fully configurable.
🔸 Alert Conditions
Two alert conditions are provided:
-Bullish Unicorn Setup Detected
-Bearish Unicorn Setup Detected
Alerts trigger only on the bar a new setup is created.
🔹 Calculations
This section summarizes the main computations used internally. The goal here is to explain the model mechanics rather than reproduce every implementation detail.
1. Swing Detection (Pivot High / Pivot Low)
Swing levels are detected using a symmetric pivot definition with “Swing Length” bars on both sides:
float ph = ta.pivothigh(high, swingLength, swingLength)
float pl = ta.pivotlow(low, swingLength, swingLength)
When a pivot is confirmed, its price and originating bar index are stored:
-Swing High: price = pivot high, isHigh = true
-Swing Low: price = pivot low, isHigh = false
The script keeps a limited history (most recent swings) to stay efficient.
2. Fair Value Gap Detection
FVGs use the classic three candle displacement imbalance:
Bullish FVG condition
bool isBullFVG = high < low
Bullish gap range is defined as:
-Top = low
-Bottom = high
Bearish FVG condition
bool isBearFVG = low > high
Bearish gap range is defined as:
-Top = low
-Bottom = high
3. ATR Based Minimum Gap Filter
ATR is computed (length 14), then the gap size is compared against a user threshold:
float atr = ta.atr(14)
bool validBullFVG = isBullFVG and (bullFvgTop - bullFvgBot) > (atr * fvgThreshold)
bool validBearFVG = isBearFVG and (bearFvgTop - bearFvgBot) > (atr * fvgThreshold)
This prevents very small imbalances from generating setups in low volatility conditions.
4. “First Break” Check Using Level Invalidation Scan
Before accepting a swing break, the script scans forward from the swing bar to the current bar to confirm the level has not already been breached. The scan can be based on wick or close:
-Wick mode: uses high or low
-Close mode: uses close
Conceptually:
priceToCheck = mode == "Wick" ? (checkBelow ? low : high) : close
If a prior breach is found, the swing is treated as already invalidated and is ignored for setup creation.
5. Break Of Structure Condition
Bullish break requirement
A bullish setup requires breaking a stored swing high with bullish body intent:
-close > swingHighPrice
-open < close
Bearish break requirement
A bearish setup requires breaking a stored swing low with bearish body intent:
-close < swingLowPrice
-open > close
An additional proximity filter is applied in the bearish branch to reduce weak or overly extended breaks by requiring the prior close to be reasonably near the swing level.
6. Breaker Range Construction
Once a qualifying swing is found, the breaker range is derived from the body of the swing candle (the candle at the swing bar index). The body boundaries are:
float breakerTop = math.max(bOpen, bClose)
float breakerBot = math.min(bOpen, bClose)
This models the breaker as the candle body range rather than full wick range, which typically produces more practical invalidation boundaries.
7. Overlap Test Between Breaker and FVG
A setup is only created if the breaker body overlaps the FVG zone. Conceptually the script rejects cases where one range is fully above or fully below the other:
-If there is no overlap, no setup is created
-If overlap exists, the Unicorn setup is valid
8. Active Monitoring and Invalidation
Each setup remains active until invalidated. Invalidation is evaluated every bar using your selected basis:
-Close basis: compares close to breaker boundary
-Wick basis: compares high or low to breaker boundary
Bullish invalidation
Setup fails if price crosses below breaker bottom.
Bearish invalidation
Setup fails if price crosses above breaker top.
If deletion is enabled, all drawings related to that setup are removed immediately on invalidation.
9. Drawing Updates and Object Lifecycle
Breaker and FVG boxes are extended to the right while the setup is active to keep zones visible into the near future. The Unicorn label is also repositioned as new bars print so the most recent context stays readable.

Auto-Anchored Fibonacci Volume Profile [Custom Array Engine]Description:
1. The Theoretical Foundation: Structure vs. Participation In professional technical analysis, traders often struggle to reconcile two distinct datasets: Price Geometry (where price should go) and Market Participation (where money actually went).
Why Fibonacci? (The Structure) Fibonacci Retracements map the mathematical structure of a trend. They identify psychological and algorithmic "interest zones" (0.382, 0.5, 0.618) where a correction is statistically likely to terminate. However, Fibonacci levels are theoretical—they are "lines in the sand" that do not guarantee liquidity or reaction.
Why Volume Profile? (The Verification) Volume Profile maps the historical exchange of shares at specific price levels. It reveals "fair value" (High Volume Nodes) and "market imbalance" (Low Volume Nodes). It is the only tool that verifies if a specific price level was actually accepted by institutional participants.
2. Underlying Calculations (The Custom Engine) This script operates on a custom-built calculation engine that bypasses standard built-in functions entirely. It uses Pine Script Arrays to build a Volume Profile from scratch. Here is the breakdown of the proprietary code logic:
A. The "Smart-Fill" Distribution Algorithm (Solves Gapping)
The Problem: Standard volume scripts often assign a candle's entire volume to a single price row. In volatile markets or steep trends, this creates visual "gaps" or a "barcode" effect because price moved too fast to register on every row.
My Solution: I wrote a custom loop that calculates the vertical overlap of every candle against the profile grid.
The Math: Volume Per Bin = Total Candle Volume / Bins Touched.
The Result: If a single volatile candle spans 10 price rows (bins), the script mathematically divides that volume and distributes it equally into all 10 array indices. This generates a solid, continuous distribution curve that accurately reflects price action through the entire candle range, not just the close.
B. Dynamic Arrays & Split-Volume Logic The script initializes two separate floating-point arrays (buyVolArray and sellVolArray) sized to the user's resolution (up to 300 rows). It iterates through the specific time-window of the swing:
If Close >= Open, the calculated volume slice is injected into the Buy Array.
If Close < Open, it is injected into the Sell Array.
These arrays are then visually stacked to render the dual-color profile, allowing traders to see the "Delta" (Buyer vs. Seller aggression) at key structural levels.
C. Custom Garbage Collection (Performance) To enable the "Auto-Anchoring" feature without causing chart lag or visual artifacts ("ghosting"), the script includes a Garbage Collection System. Before drawing a new profile, the script iterates through a tracking array of all existing objects (box.delete, line.delete) and clears them from memory. This ensures the indicator remains lightweight and responsive even when dragging chart margins or switching timeframes.
3. The Synthesis: Why Combine Them? The core philosophy of this script is Confluence . A Fibonacci level without volume is merely a suggestion; a Fibonacci level backed by volume is a defensive wall. By algorithmically anchoring a Volume Profile to the exact coordinates of a Fibonacci swing, this tool allows traders to instantly answer critical questions:
"Is the Golden Pocket (0.618) supported by a High Volume Node (HVN), or is it a Low Volume Node (LVN) that price might slice through?"
"Is the Shallow Retracement (0.382) holding because of structural support, or just a lack of selling pressure?"
4. How to Read the Indicator
The Geometry: The script automatically detects the trend and draws standard Fib levels (0, 0.236, 0.382, 0.5, 0.618, 0.786, 1.0).
The Confluence Check: Look for the Point of Control (Red Line). If this High Volume Node aligns with a key Fib level (e.g., the 0.618), the probability of a reversal increases significantly.
The Imbalance Check: Look for "Valleys" in the profile (Low Volume Nodes). These gaps often act as "slippage zones" where price travels quickly between structural levels.
Buy/Sell Splits: The dual-color bars (Teal/Red) reveal the composition of the volume. A 0.618 level held up by dominant Buy Volume is a stronger bullish signal than one with mixed volume.
5. Settings & Customization
Lookback Length: Sensitivity of the swing detection (Default: 200 bars).
Resolution: Granularity of the profile rows (Default: 100). Higher values provide smoother definition.
Width (%): Responsive sizing that scales the profile relative to the trend's duration.
Extend Lines: Option to project structural levels infinitely to the right.
Disclaimer This script is an analytical tool for visualizing historical market data. It does not provide trade signals or financial advice.

Institutional Options Flow Scanner [NSE]# 🏦 Institutional Options Flow Scanner - Elite Signal Confirmation System
## 📊 Overview
**Experience institutional-grade options flow analysis with military-grade signal filtering.** This advanced Pine Script v6 indicator scans NSE options chains for unusual whale and institutional activity, applying **7-layer confirmation logic** to eliminate false signals and deliver high-probability trading setups. Designed exclusively for **NIFTY, BANKNIFTY, and FINNIFTY** options traders who demand professional-quality signals.
**What makes this different?** While most volume indicators flood you with noise, this scanner uses **multi-factor confirmation, momentum detection, and persistence filtering** - the exact methodology institutional desks pay $100K+ for. Every signal must pass rigorous institutional-grade criteria before appearing on your chart.
**Result:** Fewer signals. Higher quality. Better win rate. 🎯
---
## ⚡ What's New in v2.0 (December 2025)
### 🎯 7-Layer Signal Confirmation System
Every signal now requires **ALL conditions** to be met:
1. **✅ Whale Volume Threshold** - Flow must be ≥2.5x baseline (smart money)
2. **✅ Absolute Volume Filter** - Minimum 50K contracts (liquidity proof)
3. **✅ PCR Alignment** - Sentiment must match direction (<0.8 bull, >1.5 bear)
4. **✅ Flow Dominance** - Winning side must exceed opposite by 20%
5. **✅ Conviction Score** - Strength must be ≥60% (configurable)
6. **✅ Momentum Filter** - Flow must be accelerating (rising ratio)
7. **✅ Persistence Check** - Signal must hold for 2+ bars (confirmation)
**Before:** Signals appeared on 0.8x quiet flow ❌
**After:** Signals only on confirmed whale activity ✅
### 🔍 New Features
**Signal Quality Indicator**
- ✅ CONFIRMED (2/2) - Trade-ready setup
- 🔍 BUILDING (1/2) - Setup forming, wait
- ⏸️ WAIT (0/2) - No institutional activity
**Flow Momentum Arrows**
- ↗ Flow accelerating (bullish for signal)
- → Flow flat/declining (caution)
**Advanced Filters** (User Configurable)
- Minimum Absolute Volume (default: 50,000)
- Minimum Strength Score (default: 60%)
- Confirmation Bars (default: 2)
- Require Rising Flow (toggle)
**Cleaner Chart Signals**
- Only plots when fully confirmed
- No more false orange diamonds
- Larger markers with text labels
- Background shading only on confirmation
---
## 🎯 Core Features
### ✅ Multi-Strike Volume Scanning
- Scans **up to 5 strikes per side** (Calls & Puts) in parallel
- Tracks **maximum volume strike** across entire scan range
- NSE-optimized symbol format: `NSE:NIFTY251223C25800`
- Configurable intervals: 25/50/100/200 (NIFTY=50, BANKNIFTY=100)
### 🐋 Institutional Flow Classification
Advanced 4-tier system based on volume anomaly ratios:
| Flow Type | Threshold | Meaning | Trading Action |
|-----------|-----------|---------|----------------|
| 🐋 WHALE | ≥ 2.5x baseline | Hedge funds, prop desks positioning | **Follow immediately** |
| 🏦 INST | ≥ 1.8x baseline | Institutional accumulation | **Strong consideration** |
| 📈 ACTIVE | ≥ 1.2x baseline | Elevated retail + small funds | **Wait for whale** |
| 😴 QUIET | < 1.2x baseline | Normal/low activity | **Ignore** |
### 📈 Advanced Market Analytics
**Put-Call Ratio (PCR) Analysis**
- 5-tier sentiment classification
- Real-time PCR momentum (rising/falling)
- Color-coded thresholds (red=bearish, green=bullish)
**Flow Bias Detection**
- CALL BIAS - Institutions buying calls aggressively
- PUT BIAS - Institutions hedging/buying puts
- BALANCED - No clear directional positioning
**Flow Strength Score (0-100)**
- Weighted formula measuring conviction
- Used for position sizing guidance
- Filters low-quality setups
**Sentiment Gauge**
| PCR Range | Sentiment | Interpretation |
|-----------|-----------|----------------|
| > 1.5 | 🔴 BEARISH | Fear, crash hedging |
| 1.2-1.5 | 🟠 CAUTION | Defensive positioning |
| 0.8-1.2 | ⚪ NEUTRAL | Balanced market |
| 0.6-0.8 | 🟡 BULLISH | Optimism building |
| < 0.6 | 🟢 V.BULL | Extreme greed, FOMO |
### 🟢 BUY CALL Signal - 7-Point Checklist
**All conditions must be TRUE:**
```
✅ Call flow ≥ 2.5x baseline (whale activity)
✅ Absolute volume ≥ 50,000 contracts (liquidity)
✅ PCR < 0.8 (bullish sentiment confirmed)
✅ Call flow > Put flow by 20% (clear dominance)
✅ Strength score ≥ 60% (high conviction)
✅ Call flow accelerating (momentum filter)
✅ Held for 2+ bars (persistence check)
```
**Result:** Large green ▲ triangle on chart + "CALL" text label
### 🔴 BUY PUT Signal - 7-Point Checklist
**All conditions must be TRUE:**
```
✅ Put flow ≥ 2.5x baseline (whale activity)
✅ Absolute volume ≥ 50,000 contracts (liquidity)
✅ PCR > 1.5 (bearish sentiment confirmed)
✅ Put flow > Call flow by 20% (clear dominance)
✅ Strength score ≥ 60% (high conviction)
✅ Put flow accelerating (momentum filter)
✅ Held for 2+ bars (persistence check)
```
**Result:** Large red ▼ triangle on chart + "PUT" text label
### 🟠 STRADDLE Signal - Volatility Setup
**Conditions:**
```
✅ Both Call AND Put flows ≥ 1.8x (institutional)
✅ Both have adequate absolute volume
✅ Flows balanced (difference < 0.5x)
✅ Strength ≥ 60% (high conviction)
✅ Held for 2+ bars (confirmation)
```
**Result:** Orange ◆ diamond on chart + "STRAD" text label
### 🎨 Professional Bloomberg-Style Dashboard
**Fully Adjustable:**
- **9 Position Options:** top/middle/bottom × left/center/right
- **6 Text Sizes:** auto, tiny, small, normal, large, huge
- **Auto-scaling:** Action row larger, status row smaller
- **Dark Theme:** #1a1a1a background with color-coded metrics
**Dashboard Sections:**
**1. Market Overview**
- Sentiment (PCR-based with color coding)
- Flow Bias (directional positioning)
- Flow Strength (0-100 conviction score)
**2. Call Flow Analysis**
- Strike / Volume (e.g., "25750 / 115,350")
- Flow Type with momentum (e.g., "🐋 WHALE (3.2x↗)")
- Real-time classification
**3. Put Flow Analysis**
- Strike / Volume (e.g., "25850 / 185,400")
- Flow Type with momentum (e.g., "🏦 INST (1.9x→)")
- Real-time classification
**4. Signal Quality** ⭐ NEW
- Confirmation status (✅/🔍/⏸️)
- Bar count progress (e.g., "2/2")
- Quality indicator
**5. Trade Action**
- Clear recommendation (BUY CALL/PUT/STRADDLE/WAIT)
- Risk level (HIGH/MEDIUM/LOW)
- Color-coded for instant recognition
**6. Data Validation**
- Live data status (✅ LIVE / ⚠️ PARTIAL)
- Strike count verification
---
## 🔬 Advanced Methodology
### Signal Confirmation Logic
**Why 7 layers?** Institutional desks use multiple confirmation factors to avoid whipsaws. Each layer filters out noise:
**Layer 1 - Whale Threshold (2.5x)**
- Filters 80% of normal volume spikes
- Only catches major institutional positioning
**Layer 2 - Absolute Volume (50K+)**
- Eliminates low-liquidity strikes
- Ensures tradeable contracts exist
**Layer 3 - PCR Alignment**
- Confirms sentiment matches flow direction
- Catches divergences (flow vs. sentiment mismatch)
**Layer 4 - Flow Dominance (20%)**
- Ensures clear directional bias
- Avoids mixed/confused signals
**Layer 5 - Conviction Score (60%)**
- Measures overall setup strength
- User-adjustable for risk tolerance
**Layer 6 - Momentum Filter**
- Flow must be accelerating (not dying)
- Catches institutions actively building positions
**Layer 7 - Persistence (2 bars)**
- Signal must hold through confirmations
- Eliminates 1-bar spikes/noise
**Result:** ~90% reduction in false signals vs. basic volume indicators
### Flow Momentum Detection
**How it works:**
```
Current Bar: Call Ratio = 3.2x
Previous Bar: Call Ratio = 2.7x
Change: +0.5x → ↗ ACCELERATING (Bullish)
vs.
Current Bar: Call Ratio = 2.8x
Previous Bar: Call Ratio = 3.1x
Change: -0.3x → → DECLINING (Bearish for signal)
```
**Why it matters:** Institutions build positions over multiple bars. Accelerating flow = active accumulation. Declining flow = distribution or false alarm.
### PCR Momentum Analysis
**PCR Rising (+0.1 or more):**
- More puts being bought relative to calls
- Bearish sentiment building
- Confirms PUT signals, invalidates CALL signals
**PCR Falling (-0.1 or more):**
- More calls being bought relative to puts
- Bullish sentiment building
- Confirms CALL signals, invalidates PUT signals
### Strength Score Formula
```
Traditional (old): max(callRatio, putRatio) × 30
Problem: 1.5x flow = 45% (too high for quiet flow)
Enhanced (new): (max(callRatio, putRatio) - 1) × 50
Result: 1.5x flow = 25% (accurate)
2.5x flow = 75% (whale = high conviction)
3.5x flow = 100% (extreme whale)
```
More accurate conviction measurement aligned with institutional thresholds.
---
## 📋 Dashboard Metrics Deep Dive
### New "Signal Quality" Row
| Display | Meaning | Action |
|---------|---------|--------|
| ✅ CONFIRMED (2/2) | All 7 conditions met for 2 bars | **Trade immediately** |
| 🔍 BUILDING (1/2) | All conditions met, waiting confirmation | **Prepare order, wait** |
| ⏸️ WAIT (0/2) | Conditions not met | **No action** |
**Example:**
```
Bar 1: Whale call detected → BUILDING (1/2)
Bar 2: Still whale call → CONFIRMED (2/2) ✅ → Trade!
```
### Flow Type with Momentum
| Display | Interpretation |
|---------|----------------|
| 🐋 WHALE (3.2x↗) | Whale flow accelerating - **strongest signal** |
| 🐋 WHALE (3.2x→) | Whale flow flat - **strong but watch for reversal** |
| 🏦 INST (1.9x↗) | Institutional building - **good setup forming** |
| 📈 ACTIVE (1.3x→) | Elevated but not whale - **wait for acceleration** |
| 😴 QUIET (0.8x→) | Normal flow - **ignore** |
---
## 🎮 Complete Trading Workflow
### Initial Setup (2 minutes)
**Step 1: Configure Market Settings**
```
🎯 Market Setup
├─ Underlying: NIFTY
├─ Expiry: 251226 (26-Dec-2025 in YYMMDD)
└─ ATM Strike: 25800 (nearest 50/100)
```
**Step 2: Set Scan Parameters**
```
🔍 Flow Analysis
├─ Strikes per Side: 3 (recommended)
└─ Strike Interval: 50 (NIFTY), 100 (BANKNIFTY)
```
**Step 3: Configure Signal Filters**
```
⚡ Signal Thresholds
├─ Whale: 2.5x (default - don't change)
├─ Institutional: 1.8x (default - don't change)
├─ Min Volume: 50000 (increase for major expiry)
└─ Baseline: 20 bars (default)
🎚️ Signal Filters
├─ Require Rising Flow: ON (recommended)
├─ Min Strength: 60 (conservative: 70, aggressive: 50)
└─ Confirmation Bars: 2 (conservative: 3, aggressive: 1)
```
**Step 4: Adjust Display**
```
🎨 Display
├─ Position: top_right (or your preference)
└─ Text Size: small (or based on screen)
```
### Live Trading Workflow
**Pre-Market (9:00-9:15 AM):**
1. Update **Expiry** if new week
2. Set **ATM Strike** based on pre-open NIFTY
3. Verify **Strike Interval** (50 for NIFTY)
**Trading Session (9:15 AM - 3:30 PM):**
**STEP 1: Monitor Dashboard Continuously**
- Check **Sentiment** - market mood
- Check **Flow Bias** - institutional direction
- Check **Signal Quality** - setup status
**STEP 2: Wait for Confirmed Signal**
**🟢 BUY CALL Appears:**
```
Dashboard Check:
✅ Sentiment: 🟡 BULLISH or 🟢 V.BULL
✅ Flow Bias: CALL BIAS
✅ Call Flow: 🐋 WHALE (3.2x↗)
✅ Signal Quality: ✅ CONFIRMED (2/2)
✅ Risk Level: HIGH or MEDIUM
Chart Check:
✅ Large green ▲ triangle with "CALL" label
✅ Green background shading
✅ Call Strength plot above 2.5x line
Action:
→ Check dashboard for Call Strike (e.g., 25750)
→ Place order: BUY NIFTY 25750 CE
→ Position size: 1-2% if HIGH risk, 2-3% if MEDIUM
→ Set stop loss: Recent swing low or 20% of premium
→ Target: 15-25% intraday, or trail with strength plot
```
**🔴 BUY PUT Appears:**
```
Dashboard Check:
✅ Sentiment: 🔴 BEARISH or 🟠 CAUTION
✅ Flow Bias: PUT BIAS
✅ Put Flow: 🐋 WHALE (2.8x↗)
✅ Signal Quality: ✅ CONFIRMED (2/2)
✅ Risk Level: HIGH or MEDIUM
Chart Check:
✅ Large red ▼ triangle with "PUT" label
✅ Red background shading
✅ Put Strength plot above 2.5x line
Action:
→ Check dashboard for Put Strike (e.g., 25850)
→ Place order: BUY NIFTY 25850 PE
→ Position size: 1-2% if HIGH risk, 2-3% if MEDIUM
→ Set stop loss: Recent swing high or 20% of premium
→ Target: 15-25% intraday, or trail with strength plot
```
**🟠 STRADDLE Appears:**
```
Dashboard Check:
✅ Both Call & Put: 🏦 INST or 🐋 WHALE
✅ Flow Bias: BALANCED
✅ Signal Quality: ✅ CONFIRMED (2/2)
✅ Risk Level: HIGH (volatility play)
Chart Check:
✅ Orange ◆ diamond with "STRAD" label
✅ Orange background shading
✅ Both plots above 1.8x line
Action:
→ Buy ATM Straddle (Call + Put at ATM strike)
→ Position size: 1-2% total (split between both)
→ Expect sharp move (direction unknown)
→ Exit when volatility spikes or one leg hits target
```
**STEP 3: Risk Management**
**Position Sizing by Risk Level:**
| Risk Level | Position Size | Stop Loss | Rationale |
|------------|---------------|-----------|-----------|
| HIGH (70-100%) | 1-2% of capital | 15-20% of premium | Extreme conviction but high volatility |
| MEDIUM (40-69%) | 2-3% of capital | 20-25% of premium | Good setup, normal volatility |
| LOW (<40%) | Wait | N/A | Don't trade |
**Exit Strategy:**
1. **Take Profit:** 15-25% intraday (NIFTY options are fast)
2. **Stop Loss:** Fixed 20% or swing level
3. **Trailing:** Move stop to breakeven after 10% profit
4. **Time Stop:** Exit by 3:15 PM (avoid last 15 min volatility)
**STEP 4: Monitor Chart Indicators**
**While in trade:**
- **Background turns neutral** (grey) → Flow weakening, consider exit
- **Opposite signal appears** → Flow reversed, exit immediately
- **Strength plot crosses below whale line** → Institutions exiting, exit
- **Signal Quality changes to WAIT** → Confirmation broken, exit
### Post-Trade Analysis
**After each signal:**
1. Note the **Strength Score** at entry
2. Note the **Confirmation count** (1/2 vs 2/2)
3. Track **time from signal to profit target**
4. Record **PCR at entry**
**Optimize settings based on results:**
- If too many false signals → Increase Min Strength to 70
- If missing good moves → Decrease Confirmation Bars to 1
- If getting whipsawed → Turn ON "Require Rising Flow"
---
## 📊 Real Trading Examples
### Example 1: Perfect BUY CALL Setup
```
Date: 18-Dec-2025, 10:45 AM
Symbol: NIFTY @ 25,837
Expiry: 251226 (26-Dec weekly)
Dashboard Shows:
┌────────────────────────────────────┐
│ INSTITUTIONAL FLOW - NIFTY 251226 │
├────────────────────────────────────┤
│ Sentiment │ 🟡 BULLISH (0.68) │
│ Flow Bias │ CALL BIAS (82%) │
├────────────────────────────────────┤
│ 🟢 CALL FLOW │
│ Strike/Vol │ 25750 / 127,450 │
│ Flow Type │ 🐋 WHALE (3.4x↗) │
├────────────────────────────────────┤
│ 🔴 PUT FLOW │
│ Strike/Vol │ 25900 / 42,100 │
│ Flow Type │ 😴 QUIET (0.7x→) │
├────────────────────────────────────┤
│ Signal Qual │ ✅ CONFIRMED (2/2) │
├────────────────────────────────────┤
│ BUY CALL │ Risk: HIGH │
└────────────────────────────────────┘
Chart Shows:
✅ Large green ▲ triangle at 10:45
✅ Green background active
✅ Call Strength plot: 3.4 (above whale line)
✅ PCR declining (0.72 → 0.68)
Trade Execution:
Entry: BUY NIFTY 25750 CE @ ₹145
Position: 2 lots (1.5% capital)
Stop Loss: ₹116 (-20%)
Target: ₹180 (+24%)
Result:
11:15 AM: Premium hits ₹182 ✅
Exit: ₹182 (+25.5% in 30 minutes)
Flow maintained whale status entire move
```
### Example 2: Failed Setup (No Trade)
```
Date: 18-Dec-2025, 2:15 PM
Symbol: NIFTY @ 25,912
Expiry: 251226
Dashboard Shows:
┌────────────────────────────────────┐
│ INSTITUTIONAL FLOW - NIFTY 251226 │
├────────────────────────────────────┤
│ Sentiment │ ⚪ NEUTRAL (1.05) │
│ Flow Bias │ BALANCED (34%) │
├────────────────────────────────────┤
│ 🟢 CALL FLOW │
│ Strike/Vol │ 25850 / 38,200 │
│ Flow Type │ 📈 ACTIVE (1.4x→) │
├────────────────────────────────────┤
│ 🔴 PUT FLOW │
│ Strike/Vol │ 26000 / 41,500 │
│ Flow Type │ 📈 ACTIVE (1.3x↗) │
├────────────────────────────────────┤
│ Signal Qual │ ⏸️ WAIT (0/2) │
├────────────────────────────────────┤
│ WAIT │ Risk: LOW │
└────────────────────────────────────┘
Chart Shows:
❌ No triangles/diamonds
❌ No background shading
❌ Both plots below whale line (1.4x, 1.3x)
Analysis:
✗ Neither flow reached whale threshold (2.5x)
✗ Absolute volumes too low (<50K)
✗ No momentum (flat/declining)
✗ Sentiment neutral (no clear bias)
Decision: NO TRADE
Wait for clearer whale activity
```
### Example 3: STRADDLE Volatility Play
```
Date: 18-Dec-2025, 11:30 AM
Symbol: NIFTY @ 25,775
Expiry: 251226
Context: RBI policy announcement at 12:00 PM
Dashboard Shows:
┌────────────────────────────────────┐
│ INSTITUTIONAL FLOW - NIFTY 251226 │
├────────────────────────────────────┤
│ Sentiment │ ⚪ NEUTRAL (0.98) │
│ Flow Bias │ BALANCED (78%) │
├────────────────────────────────────┤
│ 🟢 CALL FLOW │
│ Strike/Vol │ 25750 / 89,300 │
│ Flow Type │ 🏦 INST (2.0x↗) │
├────────────────────────────────────┤
│ 🔴 PUT FLOW │
│ Strike/Vol │ 25800 / 91,200 │
│ Flow Type │ 🏦 INST (1.9x↗) │
├────────────────────────────────────┤
│ Signal Qual │ ⚠️ VOLATILITY (2/2) │
├────────────────────────────────────┤
│ STRADDLE │ Risk: HIGH │
└────────────────────────────────────┘
Chart Shows:
✅ Orange ◆ diamond at 11:30
✅ Light orange background
✅ Both plots above inst line (1.8x)
✅ Balanced dual flow
Trade Execution:
Entry: BUY 25800 CE + 25800 PE
CE @ ₹132 + PE @ ₹128 = ₹260 total
Position: 1 lot each (2% total capital)
Strategy: Hold through announcement, exit on spike
Result (12:15 PM post-announcement):
NIFTY drops 85 points to 25,690
CE @ ₹58 (-56%) | PE @ ₹204 (+59%)
Straddle Value: ₹262 (+0.8%)
Exit PE @ ₹204, let CE expire
Net P&L: +32% (₹204 - ₹128 on PE)
```
---
## ⚙️ Settings Guide
### 🎯 Market Setup
**Underlying**
- Options: NIFTY, BANKNIFTY, FINNIFTY
- Default: NIFTY
- When to change: Switch index based on chart
**Expiry YYMMDD**
- Format: YYMMDD (e.g., 251226 = 26-Dec-2025)
- Update: Every Thursday after weekly expiry
- Tip: Use current week expiry for liquidity
**ATM Strike**
- Format: Round number (25800, 26000, etc.)
- Must be: Multiple of strike step (NIFTY=50, BNF=100)
- Update: When spot moves 150-200 points
### 🔍 Flow Analysis
**Strikes per Side**
- Range: 1-5
- Default: 3
- Conservative: 2 (focused scan)
- Aggressive: 5 (broader view)
- Note: More strikes = slower execution
**Strike Interval**
- NIFTY: 50
- BANKNIFTY: 100
- FINNIFTY: 50
- Don't change unless NSE changes intervals
### ⚡ Signal Thresholds
**Whale Threshold**
- Default: 2.5x (institutional standard)
- Don't change: This is calibrated to hedge fund activity
- Lower = more frequent (but lower quality) signals
- Higher = stricter (may miss some moves)
**Institutional Threshold**
- Default: 1.8x
- Don't change: Calibrated to institutional desks
- Used for STRADDLE signals
**Minimum Absolute Volume**
- Default: 50,000 contracts
- Increase to 100,000: For monthly expiry (higher liquidity)
- Decrease to 30,000: For illiquid indices (FINNIFTY)
- Purpose: Filters low-liquidity strikes
**Baseline Periods**
- Default: 20 bars
- Lower (10-15): More sensitive, faster signals
- Higher (30-50): Smoother, fewer false alerts
- Recommendation: Keep at 20
### 🎚️ Signal Filters (Most Important!)
**Require Rising Flow**
- Default: ON
- Purpose: Only signal when flow accelerating
- Turn OFF: If missing good setups
- Turn ON: If getting whipsawed
**Minimum Strength Score**
- Default: 60%
- Conservative: 70% (fewer, higher quality)
- Aggressive: 50% (more signals, more risk)
- Day Trading: 60%
- Swing Trading: 70%
**Confirmation Bars**
- Default: 2 bars
- Conservative: 3 bars (strictest filter)
- Aggressive: 1 bar (fastest signals)
- 1-min chart: 2 bars (2 minutes confirmation)
- 5-min chart: 2 bars (10 minutes confirmation)
---
## 🔔 Alert Configuration
### Available Alerts (3 Primary)
**1. 🟢 BUY CALL CONFIRMED**
- Triggers: When all 7 call conditions met for N bars
- Message: Includes call flow ratio, PCR status
- Use: Primary bullish trading alert
**2. 🔴 BUY PUT CONFIRMED**
- Triggers: When all 7 put conditions met for N bars
- Message: Includes put flow ratio, PCR status
- Use: Primary bearish trading alert
**3. 🟠 STRADDLE CONFIRMED**
- Triggers: When dual institutional flow confirmed
- Message: Indicates high volatility expected
- Use: Event-based volatility trades
### Alert Setup Steps
1. **Right-click chart** → **Add Alert**
2. **Condition:** "Institutional Options Flow Scanner "
3. **Choose:** Signal type (BUY CALL/PUT/STRADDLE)
4. **Frequency:** Once Per Bar Close (recommended)
5. **Expiration:** Open-ended or until expiry
6. **Actions:**
- ✅ Notify on app
- ✅ Show popup
- ✅ Send email (optional)
- ✅ Webhook (for automation)
7. **Create**
### Alert Message Format
```
🟢 BUY CALL CONFIRMED
NSE:NIFTY: BUY CALL SIGNAL CONFIRMED
Call Flow: 3.2x
PCR: Low
Strike visible in dashboard
```
**Tip:** Set up all 3 alerts at session start, let system notify you.
---
## 💡 Professional Best Practices
### ✅ DO
**Setup & Maintenance:**
- ✅ Update expiry every Thursday post-close
- ✅ Adjust ATM strike when market moves 200+ points
- ✅ Verify strike interval matches NSE standards
- ✅ Test alert delivery before each session
- ✅ Keep settings consistent for 1 week minimum
**Signal Discipline:**
- ✅ Wait for "✅ CONFIRMED (2/2)" status
- ✅ Verify all dashboard metrics align
- ✅ Check chart for visual confirmation (triangle + background)
- ✅ Ensure strength ≥ minimum threshold
- ✅ Confirm momentum arrow is ↗ (accelerating)
**Risk Management:**
- ✅ Scale position by risk level (HIGH=1-2%, MEDIUM=2-3%)
- ✅ Set stop loss immediately after entry (15-20%)
- ✅ Take profits at targets (15-25% for NIFTY)
- ✅ Exit by 3:15 PM (avoid closing chaos)
- ✅ Trail stops when profitable (move to BE after +10%)
**Trading Psychology:**
- ✅ Trade only confirmed signals (ignore BUILDING/WAIT)
- ✅ Accept missed opportunities (quality > quantity)
- ✅ Journal every trade with strength score
- ✅ Review weekly performance
- ✅ Paper trade 2 weeks before live trading
### ❌ DON'T
**Common Mistakes:**
- ❌ Don't trade "🔍 BUILDING" signals (wait for confirmation)
- ❌ Don't trade when Signal Quality = "⏸️ WAIT"
- ❌ Don't ignore PCR alignment (must match direction)
- ❌ Don't trade momentum arrow → (flat/declining flow)
- ❌ Don't chase signals after 2+ bars elapsed
**Setup Errors:**
- ❌ Don't use expired expiry dates
- ❌ Don't forget to update ATM strike
- ❌ Don't change whale threshold (keep 2.5x)
- ❌ Don't disable "Require Rising Flow" without testing
- ❌ Don't set confirmation bars to 0
**Risk Mistakes:**
- ❌ Don't overtrade (max 3-4 signals/day)
- ❌ Don't ignore risk level (adjust position accordingly)
- ❌ Don't remove stop losses
- ❌ Don't hold overnight (intraday only for beginners)
- ❌ Don't revenge trade after losses
**Data Quality:**
- ❌ Don't trade on "⚠️ PARTIAL" data status
- ❌ Don't use during market open/close (9:15-9:20, 3:25-3:30)
- ❌ Don't trade illiquid far OTM strikes
- ❌ Don't ignore absolute volume filter warnings
---
## 🎓 Understanding Why This Works
### The Institutional Edge
**What hedge funds know:**
1. **Volume precedes price** - Large institutional orders create volume spikes 10-30 minutes before price moves
2. **Persistence matters** - Real accumulation happens over multiple bars, not 1-bar spikes
3. **Momentum confirms intent** - Accelerating flow = active buying, declining flow = distribution
4. **Sentiment alignment** - Smart money aligns flow with PCR (bullish flow + low PCR = real setup)
**This indicator quantifies all 4 factors in real-time.**
### Why 7-Layer Confirmation?
**Each layer serves a purpose:**
| Layer | Filters Out | Keeps |
|-------|-------------|-------|
| Whale (2.5x) | Normal retail volume | Hedge fund activity only |
| Volume (50K) | Illiquid strikes | Tradeable contracts |
| PCR Align | Confused signals | Clear directional setups |
| Dominance | Mixed flow | One-sided positioning |
| Strength (60%) | Low conviction | High-probability setups |
| Momentum (↗) | Distribution/fading | Active accumulation |
| Persistence (2 bars) | 1-bar noise | Sustained institutional interest |
**Result:** Signal quality ↑ 900%, False positives ↓ 85%
### Why Momentum Matters
**Scenario 1: No Momentum Filter**
```
Bar 1: Call ratio 3.5x → Signal fires ✅
Bar 2: Call ratio 3.0x → Still whale
Bar 3: Call ratio 2.4x → Below whale
Result: Whipsaw loss (caught the tail end)
```
**Scenario 2: With Momentum Filter**
```
Bar 1: Call ratio 2.8x, rising → BUILDING (1/2)
Bar 2: Call ratio 3.2x, rising → CONFIRMED (2/2) ✅
Bar 3: Call ratio 3.6x, rising → In trade, profitable
Bar 4: Call ratio 3.4x, flat → Exit (momentum lost)
Result: Clean entry/exit, profit captured
```
**Momentum = Leading indicator of institutional intent**
---
## 📊 Performance Metrics
### Backtested Results (Disclaimer: Past ≠ Future)
**Test Period:** Sep-Dec 2024 (15 weeks)
**Symbol:** NIFTY Weekly Options
**Timeframe:** 5-minute chart
**Settings:** Default (2.5x, 60% strength, 2 bars, rising flow ON)
| Metric | Value |
|--------|-------|
| Total Signals | 47 |
| Win Rate | 68% (32 wins, 15 losses) |
| Avg Win | +19.2% |
| Avg Loss | -16.8% |
| Profit Factor | 2.31 |
| Max Drawdown | 3 consecutive losses |
| Avg Holding Time | 42 minutes |
| Best Trade | +41% (BUY PUT, RBI event) |
**Key Insight:** Lower signal frequency (3-4/week) + higher quality = consistent profitability
---
## ⚠️ Important Disclaimers
### Risk Warning
**Options trading is extremely risky:**
- ❌ You can lose 100% of your investment
- ❌ Options decay rapidly (theta decay)
- ❌ High leverage amplifies losses
- ❌ Volatility can cause extreme price swings
- ❌ Gaps can bypass stop losses
**This indicator:**
- ✅ Is a tool, not a guarantee
- ✅ Shows historical patterns (may not repeat)
- ✅ Requires discipline and risk management
- ✅ Works best with proper position sizing
- ❌ Cannot predict black swan events
### Data Limitations
**TradingView NSE Data:**
- May have 1-2 minute delays
- Some strikes may show 0 volume (data gaps)
- High volatility periods may have missing bars
- Not tick-by-tick (bar-based only)
**Indicator Limitations:**
- Works only on NSE options with TradingView data
- Requires valid expiry/strike configuration
- Maximum 5 strikes per side (TradingView limit)
- Not suitable for stocks/commodities (indices only)
### Not Financial Advice
**This indicator is educational software only:**
- Not regulated financial advice
- Not a recommendation to buy/sell
- Author has no fiduciary relationship with users
- Past performance ≠ future results
**Before trading:**
- Consult a SEBI-registered advisor
- Understand option Greeks (delta, theta, gamma, vega)
- Paper trade minimum 2-4 weeks
- Risk only capital you can afford to lose
- Understand tax implications (consult CA)
**By using this indicator, you accept all trading risks.**
---
## 📞 Support & Community
**Questions? Issues?**
- 💬 Comment below for support
- 🐛 Report bugs with screenshot + settings
- 💡 Feature requests welcome
- 📊 Share your trading results (anonymously)
**Like this indicator?**
- ⭐ Star/Favorite on TradingView
- 📣 Share with trading community
- ✍️ Leave honest review
- 🚀 Follow for updates
**Future Roadmap:**
- Multi-expiry scanning (near + far month)
- Options Greeks integration (delta, gamma)
- Historical signal replay
- Custom alert webhook templates
- Mobile-optimized compact view
---
## 🏷️ Tags
`#NSE` `#NIFTY` `#BANKNIFTY` `#FINNIFTY` `#OptionsTrading` `#WhaleDetection` `#InstitutionalFlow` `#VolumeAnalysis` `#UnusualVolume` `#OptionsFlow` `#SmartMoney` `#OrderFlow` `#PCR` `#PutCallRatio` `#OptionsScanner` `#TradingSignals` `#IndianMarkets` `#DayTrading` `#IntradayTrading` `#OptionsStrategy` `#PineScript` `#TradingView` `#AlgoTrading` `#QuantTrading` `#SignalConfirmation`
---
**Version:** 2.0
**Release Date:** December 2025
**Author:**
**License:** Mozilla Public License 2.0
**Compatibility:** Pine Script v6, TradingView Premium/Pro (40+ security calls)
---
*Institutional-grade signals. Military-grade filtering. Retail-friendly interface.*
**Trade with precision. Trade with the whales.** 🐋📈
---
## 📖 Quick Start Checklist
**Before first trade:**
- Set correct expiry (YYMMDD format)
- Set ATM strike (nearest 50/100)
- Verify strike interval (50=NIFTY, 100=BNF)
- Configure filters (60% strength, 2 bars, rising flow ON)
- Set up all 3 alerts (CALL/PUT/STRADDLE)
- Test alert delivery (demo alert)
- Paper trade 10+ signals
- Read complete methodology section
- Understand all 7 confirmation layers
- Prepare risk management plan (position sizing, stops)
**Weekly maintenance:**
- Thursday 3:30 PM: Update expiry for next week
- Check ATM strike accuracy
- Review past week's signals
- Adjust filters if needed (based on performance)
**Every trade:**
- Wait for ✅ CONFIRMED (2/2)
- Verify momentum arrow ↗
- Check PCR alignment
- Confirm risk level
- Set stop loss immediately
- Journal entry (time, strike, strength score)
**Ready to trade with institutional precision?** 🚀
```

GME Warrant Tracker [theUltimator5]The GME Warrant Tracker was designed to be used for GME warrants tracking. The theory behind this indicator is that warrants are priced similarly to options and generally follow the same Greeks. With that assumption, we can break down the price of the warrants by using known Greeks to estimate either the theoretical price, or even estimate Implied Volatility (IV).
The base settings for this indicator plot the calculated IV, the theoretical price (there are multiple methods of calculation which I will discuss later) and the current warrant price.
You can toggle on or off all of these plots to display only what you want to track.
For example, you can simply track the difference between the theoretical price and the current price to see if warrants are trading at a premium or a discount vs what the indicator calculates it to be.
Calculating implied volatility is extremely difficult and must be approximated.
The theoretical warrant price produced by this indicator depends primarily on the volatility input (σ) used in the Black–Scholes pricing model.
This script supports five distinct methods for approximating σ, each extracting different information from the market.
1) Close-to-Close Historical Volatility
Close-to-Close computes the standard deviation of daily close-to-close returns and uses a lookback window scaled to time-to-expiry. As the expiration approaches, the lookback window tightens, giving a more responsive volatility approximation relative to time-to-expiry.
This option produces conservative approximations for volatility, and may lag actual volatility intraday.
2) Parkinson High-Low Volatility
Parkinson High-Low volatility uses daily high and low prices to calculate intraday trading range for a more responsive estimation to volatility. It ignores opening and close gaps, so overnight volatility is not accounted for.
This option produces higher theoretical volatility during choppy price action and can over estimate actual volatility.
3) Garman–Klass Volatility
Garman–Klass volatility is a way to estimate how much price is fluctuating by using the open, high, low, and close for each period. Because it draws on multiple intraperiod price points (not just the range or close-to-close moves), it typically produces a tighter, more informative volatility estimate than simpler approaches. It’s often most helpful when gaps occur and when the open and close carry meaningful information about the session’s trading.
4)Yang–Zhang Volatility
The Yang–Zhang volatility estimator is designed to account for both opening jumps and price drift. It estimates volatility by combining overnight (close-to-open) variance, intraday (open-to-close) variance, and a weighted Rogers–Satchell component using OHLC data, often yielding a more robust measure than simpler close-to-close style estimators.
5) Option price
By default, the indicator uses the call option strike dated closest to the warrant expiration date. Since the Greeks for both the warrants and the
options are assumed to be equivalent with a minor difference in theta (time-to-expiry), the theoretical price of the warrants closely matches the trade price of the call strike chosen.
There is a table that can be enabled (off by default because it is large and fills entire screen on mobile) which shows all the configuration settings and Greeks.
You can also manually adjust the "dilution" factor for the warrants, which shifts the number of active warrants and moves the count into the shares outstanding for the underlying (GME). The reason for this is that as warrants get exercised, the total quantity of warrants in circulation decreases and the the total quantity of shares outstanding increases.
Since this indicator was built around the single warrant, ticker NYSE: GME/W, it is only meant to be used with NYSE:GME. Any other ticker will not work properly with this indicator.

Market Structure HighLow + Liquidity [MaB]📊 Market Structure HighLow + Liquidity A comprehensive indicator combining precision market structure analysis with real-time liquidity zone detection, built on a custom finite-state machine architecture.
━━━━━━━━━━━━━━━━━━━━━━━━━━━━━━━━━━━━━━━━
🎯 KEY FEATURES
• Automatic Swing Detection Identifies structural High/Low points using a dual-confirmation system (minimum candles + pullback percentage)
• Smart Trend Tracking Automatically switches between Uptrend (Higher Highs & Higher Lows) and Downtrend (Lower Highs & Lower Lows)
• Breakout Alerts Visual markers for confirmed breakouts (Br↑ / Br↓) with configurable threshold
• Sequential Labeling Clear numbered labels (L1, H2, L3, H4...) showing the exact market structure progression
• Color-Coded Structure Lines
• Green: Uptrend continuation legs
• Red: Downtrend continuation legs
• Gray: Trend inversion points
• Imbalance Zones (FVG) Automatically detects Fair Value Gaps that form during impulsive moves between validated swing points
• Inducement Zones Identifies potential liquidity traps - FVGs that form before breakout confirmation, often used as stop-hunt areas
• Dynamic Zone Management Zones automatically close when price touches them, with configurable retracement sensitivity
━━━━━━━━━━━━━━━━━━━━━━━━━━━━━━━━━━━━━━━━
🔬 TECHNICAL ARCHITECTURE
This indicator does NOT rely on TradingView's built-in ta.pivothigh() / ta.pivotlow() functions.
Instead, it implements a custom finite-state machine (FSM) that manages multiple monitoring states, alternating dynamically between Uptrend and Downtrend modes based on confirmed breakouts.
Core Components:
• State Machine Engine Multiple internal states handle candidate detection, validation, and confirmation phases. The system transitions between states based on price action triggers and confirmation criteria.
• Dual-Confirmation System Each swing point must satisfy two independent filters before validation:
o Time-based filter (minimum candles)
o Price-based filter (minimum retracement %)
• Directional Breakout Logic Separate breakout detection routines for uptrend continuation, downtrend continuation, and trend inversion scenarios. Each triggers specific state transitions.
• FVG Classification Engine Automatically distinguishes between Imbalance zones (post-confirmation FVGs) and Inducement zones (pre-confirmation FVGs) based on breakout timing context.
• Dynamic Zone Lifecycle Zones are created, monitored, and closed through a managed lifecycle with configurable touch sensitivity.
━━━━━━━━━━━━━━━━━━━━━━━━━━━━━━━━━━━━━━━━
⚙️ CONFIGURABLE PARAMETERS
Market Structure
• Analysis Start Date: Define when to begin structure analysis
• Min Confirmation Candles: Required candles for validation (default: 3)
• Pullback Percentage: Minimum retracement for confirmation (default: 10%)
• Breakout Threshold: Percentage beyond structure for breakout (default: 1%)
Liquidity
• Show Zones: Toggle visibility of imbalance and inducement zones
• Zone Colors: Customize colors for Supply/Demand imbalances and inducements
• Zone Retracement %: How deep price must enter zone to consider it touched (0-100%)
• Inactive Zones Transparency: Visual distinction for closed zones
Display
• Show Market Structure Table: Toggle info panel
• Replay Mode: Optimize for TradingView Replay feature
━━━━━━━━━━━━━━━━━━━━━━━━━━━━━━━━━━━━━━━━
🎨 ZONE COLOR CODING
• 🔴 Imbalance Supply (Red): Bearish FVG - potential resistance/short entry
• 🟢 Imbalance Demand (Green): Bullish FVG - potential support/long entry
• 🟠 Inducement Supply (Orange): Pre-breakout bearish FVG - possible stop-hunt zone
• 🔵 Inducement Demand (Blue): Pre-breakout bullish FVG - possible stop-hunt zone
━━━━━━━━━━━━━━━━━━━━━━━━━━━━━━━━━━━━━━━━
💡 HOW IT WORKS
1. Initializes state machine in UPTREND mode, searching for first swing Low
2. Tracks price movement and triggers candidate states upon potential reversals
3. Validates candidates through dual-confirmation (time + price filters)
4. Upon confirmation, scans price range for FVG patterns (3-candle gaps)
5. Classifies detected FVGs based on breakout timing (Inducement vs Imbalance)
6. Monitors breakout levels - triggers state transitions on confirmed breaks
7. Alternates between Uptrend/Downtrend modes based on breakout direction
8. Manages zone lifecycle - closes zones when price retraces into them
━━━━━━━━━━━━━━━━━━━━━━━━━━━━━━━━━━━━━━━━
🔧 BEST USED FOR
• Identifying key support/resistance levels with liquidity context
• Spotting potential reversal zones (imbalances)
• Avoiding stop-hunt traps (inducement awareness)
• Trend direction confirmation
• Breakout trading setups with confluence
• Multi-timeframe structure and liquidity analysis
• Understanding where institutional orders may be resting
━━━━━━━━━━━━━━━━━━━━━━━━━━━━━━━━━━━━━━━━
⚠️ NOTES
• Works best on higher timeframes (1H+) for cleaner structure
• Inducement zones often convert to Imbalance zones after breakout confirmation
• Zone Retracement % allows fine-tuning: 0% = first touch, 25% = quarter penetration, 100% = full traversal
• Inactive zones remain visible (faded) to show historical liquidity levels
• Use Replay Mode when backtesting to prevent buffer overflow errors

ES1! H1 Stats+ES1! H1 Stats - Detailed Prob & Excursion Indicator
Overview
ES1! H1 Stats - Detailed Prob & Excursion is a specialized statistical overlay indicator for TradingView, tailored for E-mini S&P 500 futures (ES1!) on a 1-hour framework. It provides real-time insights into the probability of price returning to the hourly open after sweeping the previous hour’s high (PHH) or previous hour’s low (PHL), based on historical data segmented by hour (0–23) and 20-minute intervals. The indicator visualizes these sweeps with lines, labels, circles, background fills, and “excursion zones” (also called “Magic Boxes”) that highlight median/mean extensions post-sweep, along with percentile lines (75th / 90th / 95th) for gauging potential “pain” or extreme moves. This tool is designed for intraday S&P 500 traders focusing on liquidity sweeps and mean-reversion behavior, helping to quantify edge using empirical probabilities and excursion statistics.
The data is hardcoded from extensive historical analysis of ES1! behavior (e.g., probabilities ranging roughly from ~7% to ~91%, with sample sizes up to 2000+ per segment), making it a backtested reference rather than a dynamic learning model. It emphasizes visual clarity during active hours, with options to filter for Regular Trading Hours (RTH: 09:00–15:59 ET) or high-probability (>70%) events only. Note: This is an educational tool for analyzing market structure; it does not predict future performance or provide trading signals/advice. Past data does not guarantee future results, and users should backtest on current conditions (as of December 2025 data availability) and use at their own risk, in compliance with TradingView’s house rules.
Key Features
• Sweep Detection & Probability Labels: Identifies when price breaks PHH (upside) or PHL (downside), displaying a centered label with probability of returning to the hourly open, sample size (N), time of sweep, and a checkmark (✅) if the open is retested post-sweep.
• Visual Lines & Markers: Draws hourly open (h.o.), PHH, and PHL lines with customizable styles/colors; adds small circles on sweep bars for quick spotting.
• Breakout→Open Background Fill: Shaded zone from sweep bar until price returns to open, visualizing extension duration and retracement.
• Excursion (Pain) Zone - “Magic Box”: Post-sweep box showing median/mean extension percentages, colored dynamically by probability (green high, orange mid, red low); includes dashed lines for 75th/90th/95th percentiles to mark statistical extremes.
• Time-Segmented Data: Probabilities and excursions vary by hour (0–23) and 20-min segments (0–19 min: _0, 20–39: _1, 40–59: _2), capturing intraday nuances (e.g., higher probs in early/late hours).
• Filters for Focus: RTH-only mode hides non-session elements; high-prob-only shows >70% events to reduce noise.
• Alerts: Triggers on PHH/PHL sweeps with messages for chart checks.
How It Works
• Data Foundation: Uses pre-computed maps for probabilities (prob_high_taken/prob_low_taken), sample sizes, and excursions (mean, median, p75/p90/p95 as percentages of open). Data is initialized on the first bar via f_init_high_data() and f_init_low_data(), covering 24 hours with 3 segments each (e.g., key "9_1" for 09:20–09:39). Probabilities represent historical likelihood of price returning to open after sweep; excursions quantify average/rare extensions (e.g., 0.156% mean = 0.156% of open price).
• Period Detection: On new 1H bars (new_period_bar), resets visuals, draws lines for open/PHH/PHL extending 1 hour forward, and labels if enabled. Uses request.security on standard ticker for real OHLC, bypassing chart transformations (e.g., Heikin Ashi).
• Sweep Logic: On each bar, checks if real high > PHH or real low < PHL. If so, fetches segment-specific data (hour + floor(minute/20)), displays probability label centered mid-hour. Skips if filtered (RTH-only or <70% prob).
• Excursion Visualization: If enabled, draws “Magic Box” from 1-min to 58-min into the hour, bounded by mean/median levels (top/bottom adjusted for high/low sweep). Adds percentile lines with labels (e.g., “75%”) at right end. Box color reflects prob strength for quick bias assessment.
• Retest Check: Monitors for open retest post-sweep (high/low cross open, or gap scenarios from prev bar). Adds ✅ to label if hit on subsequent bars (skips sweep bar to avoid false positives). Stops background fill on retest or at 58-min mark.
• Background Fill: Activates on sweep, shades until retest, using user color.
• Cleanup & Performance: Manages labels in arrays, clears on new periods; no excess drawing beyond max counts (500 lines/labels/boxes).
This setup blends statistical backtesting with real-time visualization: hardcoded data provides empirical probabilities/excursions (reducing subjectivity in breakouts), while dynamic elements (lines, fills, boxes) overlay structure on the chart. It helps ES traders assess if a sweep is “high-edge” (e.g., >70% probability of reverting) or likely to run (low probability, high excursion), pairing historical context with current price action.
Settings and Customization
Inputs are grouped for ease:
Settings:
o Show RTH Only (9:00–15:59): Restricts to main session (default: false; tooltip: for RTH-focused stats).
o Show High Prob Only (>70%): Filters low-prob sweeps visually (default: false; tooltip: highlights confidence).
Visuals:
o Show Line Labels: Toggle “h.o.” / “phh” / “phl” (default: true).
o Period Open Line Color: Gray 50% (default).
o Previous High/Low Line Colors: Gray 100% (default).
o Open Line Style/Width: Dotted/1 (default; options: Solid/Dotted/Dashed).
Breakout→Open Background:
o Show Breakout→Open Background: Toggle fill (default: true).
o Fill Color: Teal 85% (default).
Breakout Circles:
o Show Breakout Circles: Toggle (default: true).
o PHH/PHL Break Circle Colors: White 20% (default).
Info Label Style:
o Text Size: Small (default; options: Auto/Tiny/Normal/Large/Huge).
o Label Text Color: White (default).
o Low/Mid/High Probability Colors: Red 20% / Orange 20% / Green 20% (default).
Excursion (Pain) Zone:
o Show Excursion Zone: Toggle Magic Box (default: true).
o Excursion Box Color: Gray 75% (default; dynamic overrides).
o 75th/90th/95th Percentile Lines: Orange 30% / Red 30% / Dark Red 100% (default).
No additional tables/plots; all elements are lines/labels/boxes for overlay focus.
Usage Tips
• Breakout Trading: Watch for sweeps with high probability (>70%, green label) as potential fades back to open; low probability (red) may signal runs—use the excursion box for targets (e.g., exit at 90th percentile for extremes).
• Time Awareness: Probabilities often peak in key liquidity windows and drop in quieter hours; segments capture momentum shifts (e.g., _2 often lower prob).
• RTH Focus: Enable for cleaner stats during high-liquidity session hours; disable for a 24-hour view.
• Visual Filtering: Use high-prob-only in volatile conditions to reduce noise; combine with volume or other confluence tools for confirmation.
• Alerts Integration: Set TradingView alerts on sweeps; check label for probability/N before acting.
• Chart Setup: Best on 1H or lower ES1! charts; adjust text size for readability on smaller screens.
• Backtesting: Manually review historical sweeps against data maps to validate; update hardcoded values if new data emerges (as of 2025).
Limitations
• Fixed Data: Hardcoded stats may not reflect recent market changes (e.g., post-2025 regime shifts); not adaptive.
• Reactive Only: Detects sweeps after they occur; no predictive signals.
• Timeframe Specific: Locked to 1H logic; may not translate to other assets/timeframes without recoding data.
• Visual Clutter: On busy charts, labels/boxes may overlap—toggle selectively.
• No Live Stats: Sample sizes are historical; real-time N/prob not updated.
• Gaps & Extremes: Handles gaps in retest logic, but rare events (e.g., macro news) may exceed the 95th percentile.
Disclaimer
This indicator is for informational and educational purposes only. Trading involves significant risk of loss and is not suitable for all investors. The hardcoded data represents past E-mini S&P 500 futures (ES1!) performance and does not guarantee future outcomes. No claims of profitability are made—results depend on market conditions, user strategy, and risk management. Consult a financial advisor before trading, and backtest extensively. Abiding by TradingView rules, this tool provides no investment recommendations.

6B1! H1 Stats+6B1! H1 Stats - Detailed Prob & Excursion Indicator
Overview
6B1! H1 Stats - Detailed Prob & Excursion is a specialized statistical overlay indicator for TradingView, tailored for British Pound futures (6B1!) on a 1-hour framework. It provides real-time insights into the probability of price returning to the hourly open after sweeping the previous hour’s high (PHH) or previous hour’s low (PHL), based on historical data segmented by hour (0–23) and 20-minute intervals. The indicator visualizes these sweeps with lines, labels, circles, background fills, and “excursion zones” (also called “Magic Boxes”) that highlight median/mean extensions post-sweep, along with percentile lines (75th / 90th / 95th) for gauging potential “pain” or extreme moves. This tool is designed for intraday British Pound traders focusing on liquidity sweeps and mean-reversion behavior, helping to quantify edge using empirical probabilities and excursion statistics.
The data is hardcoded from extensive historical analysis of 6B1! behavior (e.g., probabilities ranging roughly from ~7% to ~91%, with sample sizes up to 2000+ per segment), making it a backtested reference rather than a dynamic learning model. It emphasizes visual clarity during active hours, with options to filter for Regular Trading Hours (RTH: 09:00–15:59 ET) or high-probability (>70%) events only. Note: This is an educational tool for analyzing market structure; it does not predict future performance or provide trading signals/advice. Past data does not guarantee future results, and users should backtest on current conditions (as of December 2025 data availability) and use at their own risk, in compliance with TradingView’s house rules.
________________________________________
Key Features
• Sweep Detection & Probability Labels: Identifies when price breaks PHH (upside) or PHL (downside), displaying a centered label with probability of returning to the hourly open, sample size (N), time of sweep, and a checkmark (✅) if the open is retested post-sweep.
• Visual Lines & Markers: Draws hourly open (h.o.), PHH, and PHL lines with customizable styles/colors; adds small circles on sweep bars for quick spotting.
• Breakout→Open Background Fill: Shaded zone from sweep bar until price returns to open, visualizing extension duration and retracement.
• Excursion (Pain) Zone - “Magic Box”: Post-sweep box showing median/mean extension percentages, colored dynamically by probability (green high, orange mid, red low); includes dashed lines for 75th/90th/95th percentiles to mark statistical extremes.
• Time-Segmented Data: Probabilities and excursions vary by hour (0–23) and 20-min segments (0–19 min: _0, 20–39: _1, 40–59: _2), capturing intraday nuances (e.g., higher probs in early/late hours).
• Filters for Focus: RTH-only mode hides non-session elements; high-prob-only shows >70% events to reduce noise.
• Alerts: Triggers on PHH/PHL sweeps with messages for chart checks.
________________________________________
How It Works
• Data Foundation: Uses pre-computed maps for probabilities (prob_high_taken/prob_low_taken), sample sizes, and excursions (mean, median, p75/p90/p95 as percentages of open). Data is initialized on the first bar via f_init_high_data() and f_init_low_data(), covering 24 hours with 3 segments each (e.g., key "9_1" for 09:20–09:39). Probabilities represent historical likelihood of price returning to open after sweep; excursions quantify average/rare extensions (e.g., 0.156% mean = 0.156% of open price).
• Period Detection: On new 1H bars (new_period_bar), resets visuals, draws lines for open/PHH/PHL extending 1 hour forward, and labels if enabled. Uses request.security on standard ticker for real OHLC, bypassing chart transformations (e.g., Heikin Ashi).
• Sweep Logic: On each bar, checks if real high > PHH or real low < PHL. If so, fetches segment-specific data (hour + floor(minute/20)), displays probability label centered mid-hour. Skips if filtered (RTH-only or <70% prob).
• Excursion Visualization: If enabled, draws “Magic Box” from 1-min to 58-min into the hour, bounded by mean/median levels (top/bottom adjusted for high/low sweep). Adds percentile lines with labels (e.g., “75%”) at right end. Box color reflects prob strength for quick bias assessment.
• Retest Check: Monitors for open retest post-sweep (high/low cross open, or gap scenarios from prev bar). Adds ✅ to label if hit on subsequent bars (skips sweep bar to avoid false positives). Stops background fill on retest or at 58-min mark.
• Background Fill: Activates on sweep, shades until retest, using user color.
• Cleanup & Performance: Manages labels in arrays, clears on new periods; no excess drawing beyond max counts (500 lines/labels/boxes).
This setup blends statistical backtesting with real-time visualization: hardcoded data provides empirical probabilities/excursions (reducing subjectivity in breakouts), while dynamic elements (lines, fills, boxes) overlay structure on the chart. It helps British Pound traders assess if a sweep is “high-edge” (e.g., >70% probability of reverting) or likely to run (low probability, high excursion), pairing historical context with current price action.
________________________________________
Settings and Customization
Inputs are grouped for ease:
1. Settings:
o Show RTH Only (9:00–15:59): Restricts to main session (default: false; tooltip: for RTH-focused stats).
o Show High Prob Only (>70%): Filters low-prob sweeps visually (default: false; tooltip: highlights confidence).
2. Visuals:
o Show Line Labels: Toggle “h.o.” / “phh” / “phl” (default: true).
o Period Open Line Color: Gray 50% (default).
o Previous High/Low Line Colors: Gray 100% (default).
o Open Line Style/Width: Dotted/1 (default; options: Solid/Dotted/Dashed).
3. Breakout→Open Background:
o Show Breakout→Open Background: Toggle fill (default: true).
o Fill Color: Teal 85% (default).
4. Breakout Circles:
o Show Breakout Circles: Toggle (default: true).
o PHH/PHL Break Circle Colors: White 20% (default).
5. Info Label Style:
o Text Size: Small (default; options: Auto/Tiny/Normal/Large/Huge).
o Label Text Color: White (default).
o Low/Mid/High Probability Colors: Red 20% / Orange 20% / Green 20% (default).
6. Excursion (Pain) Zone:
o Show Excursion Zone: Toggle Magic Box (default: true).
o Excursion Box Color: Gray 75% (default; dynamic overrides).
o 75th/90th/95th Percentile Lines: Orange 30% / Red 30% / Dark Red 100% (default).
No additional tables/plots; all elements are lines/labels/boxes for overlay focus.
________________________________________
Usage Tips
• Breakout Trading: Watch for sweeps with high probability (>70%, green label) as potential fades back to open; low probability (red) may signal runs—use the excursion box for targets (e.g., exit at 90th percentile for extremes).
• Time Awareness: Probabilities often peak in key liquidity windows and drop in quieter hours; segments capture momentum shifts (e.g., _2 often lower prob).
• RTH Focus: Enable for cleaner stats during high-liquidity session hours; disable for a 24-hour view.
• Visual Filtering: Use high-prob-only in volatile conditions to reduce noise; combine with volume or other confluence tools for confirmation.
• Alerts Integration: Set TradingView alerts on sweeps; check label for probability/N before acting.
• Chart Setup: Best on 1H or lower 6B1! charts; adjust text size for readability on smaller screens.
• Backtesting: Manually review historical sweeps against data maps to validate; update hardcoded values if new data emerges (as of 2025).
________________________________________
Limitations
• Fixed Data: Hardcoded stats may not reflect recent market changes (e.g., post-2025 regime shifts); not adaptive.
• Reactive Only: Detects sweeps after they occur; no predictive signals.
• Timeframe Specific: Locked to 1H logic; may not translate to other assets/timeframes without recoding data.
• Visual Clutter: On busy charts, labels/boxes may overlap—toggle selectively.
• No Live Stats: Sample sizes are historical; real-time N/prob not updated.
• Gaps & Extremes: Handles gaps in retest logic, but rare events (e.g., macro news) may exceed the 95th percentile.
________________________________________
Disclaimer
This indicator is for informational and educational purposes only. Trading involves significant risk of loss and is not suitable for all investors. The hardcoded data represents past British Pound futures (6B1!) performance and does not guarantee future outcomes. No claims of profitability are made—results depend on market conditions, user strategy, and risk management. Consult a financial advisor before trading, and backtest extensively. Abiding by TradingView rules, this tool provides no investment recommendations.

Candle Pattern Library [1CG]Candle Pattern Library
A comprehensive and easy-to-use Pine Script™ library for detecting single, two, and three-candle patterns. This library provides detailed pattern analysis including size classification, direction validation, and specific pattern identification.
Quick Start
1. Import the Library
import OneCleverGuy/CandlePatternLibrary/1 as CPL
2. Analyze Candles
Use the main analysis functions to detect patterns. You can analyze the current forming candle or confirmed historical candles.
// 1. Analyze candles (Current , Previous , and the one before )
// Note: We use full variable names for clarity.
CandleData candleNewest = CPL.analyzeCandle(open, high, low, close, 250, 50, 10, 50, 85)
CandleData candleMiddle = CPL.analyzeCandle(open , high , low , close , 250, 50, 10, 50, 85)
CandleData candleOldest = CPL.analyzeCandle(open , high , low , close , 250, 50, 10, 50, 85)
// 2. Analyze multi-candle patterns
// Pass candles in chronological order: Oldest -> Newest
var twoCandleData = CPL.analyzeTwoCandlePattern(candleMiddle, candleNewest, 10, 85)
var threeCandleData = CPL.analyzeThreeCandlePattern(candleOldest, candleMiddle, candleNewest)
Enums Reference
These are the Enum Types exported by the library. When checking results, use the pattern Alias.EnumType.Value (e.g., CPL.CandlePattern.Hammer).
CandlePattern
Enum Type for single-candle formations.
Usage: CPL.CandlePattern.
Values:
Unknown : No specific pattern detected.
RegularBullish : A standard bullish candle.
RegularBearish : A standard bearish candle.
BullishMarubozu : Bullish candle with little to no wicks.
BearishMarubozu : Bearish candle with little to no wicks.
Hammer : Small body at the top of the range (bullish reversal).
ShootingStar : Small body at the bottom of the range (bearish reversal).
SpinningTop : Small body centered in the range.
Doji : Open and close are effectively equal.
LongLeggedDoji : Doji with long upper and lower wicks.
CrossDoji : Doji with the body in the upper section.
DragonflyDoji : Doji where open/close are at the high.
InvertedCrossDoji : Doji with the body in the lower section.
GravestoneDoji : Doji where open/close are at the low.
FourPriceDoji : Open, High, Low, and Close are all equal.
TwoCandlePattern
Enum Type for two-candle formations.
Usage: CPL.TwoCandlePattern.
Values:
None : No two-candle pattern detected.
BullishEngulfingWeak : Bullish candle engulfs the previous body (close does not engulf range).
BullishEngulfingStrong : Bullish candle completely engulfs the previous body close outside range.
BearishEngulfingWeak : Bearish candle engulfs the previous body.
BearishEngulfingStrong : Bearish candle completely engulfs the previous body.
InsideBar : The second candle is completely contained within the first.
TweezerTop : Two candles with matching highs (bearish reversal).
TweezerBottom : Two candles with matching lows (bullish reversal).
BullishRailRoad : Two opposite Marubozus (Down -> Up).
BearishRailRoad : Two opposite Marubozus (Up -> Down).
ThreeCandlePattern
Enum Type for three-candle formations.
Usage: CPL.ThreeCandlePattern.
Values:
None : No three-candle pattern detected.
ThreeWhiteSoldiers : Three consecutive bullish candles.
ThreeBlackCrows : Three consecutive bearish candles.
ThreeWhiteSoldiersWithBullishFVG : Three White Soldiers containing a Bullish FVG.
ThreeWhiteSoldiersWithBearishFVG : Three White Soldiers containing a Bearish FVG.
ThreeBlackCrowsWithBullishFVG : Three Black Crows containing a Bullish FVG.
ThreeBlackCrowsWithBearishFVG : Three Black Crows containing a Bearish FVG.
MorningStar : Bearish -> Small/Doji -> Bullish (Bullish Reversal).
EveningStar : Bullish -> Small/Doji -> Bearish (Bearish Reversal).
BullishAbandonedBaby : Morning Star with gaps between all candles.
BearishAbandonedBaby : Evening Star with gaps between all candles.
EngulfingSandwich : Bearish -> Bullish (Engulfing) -> Bearish (Inside).
BullishFairValueGap : A gap between Candle 1 High and Candle 3 Low.
BearishFairValueGap : A gap between Candle 1 Low and Candle 3 High.
CandleSize
Enum Type for candle size classification.
Usage: CPL.CandleSize.
Values:
Short
Normal
Long
CandleDirection
Enum Type for candle direction classification.
Usage: CPL.CandleDirection.
Values:
Bearish
Neutral
Bullish
Function Reference
Analysis Functions
analyzeCandle(_open, _high, _low, _close, _avgSize, _sizeThresholdPct, _equivTolerance, _bodyTolerance, _positionThreshold)
analyzeCandle - Analyzes a single candle's OHLC data to determine its size, direction, and single-candle pattern.
Parameters:
_open (float) : (float) - Candle open price.
_high (float) : (float) - Candle high price.
_low (float) : (float) - Candle low price.
_close (float) : (float) - Candle close price.
_avgSize (float) : (float) - Baseline size (wick range) to compare against.
_sizeThresholdPct (float) : (float) - % difference from average to be considered Long/Short (e.g., 50.0).
_equivTolerance (float) : (float) - Absolute price diff for Close to equal Open (Doji checks).
_bodyTolerance (float) : (float) - Absolute price diff for "Small Body" checks.
_positionThreshold (int) : (int) - Int (0-100) determining valid wick ratios for Hammers/Shooting Stars (e.g., 85).
Returns: (CandleData) - CandleData object containing CandlePattern, CandleSize, CandleDirection.
analyzeTwoCandlePattern(_candle1, _candle2, _equivTolerance, _positionThreshold)
analyzeTwoCandlePattern - Analyzes two consecutive candles to find pairs like Engulfing, Tweezers, or Inside Bars.
Parameters:
_candle1 (CandleData) : (CandleData) - The first (older) candle data (previous).
_candle2 (CandleData) : (CandleData) - The second (newer) candle data (current).
_equivTolerance (float) : (float) - Price tolerance for matching highs/lows (Tweezers).
_positionThreshold (int) : (int) - Threshold for wick validations.
Returns: (TwoCandleData) - TwoCandleData object containing TwoCandlePattern.
analyzeThreeCandlePattern(_candle1, _candle2, _candle3)
analyzeThreeCandlePattern - Analyzes three consecutive candles to find complex patterns like Morning Stars, Abandoned Babies, or Three White Soldiers.
Parameters:
_candle1 (CandleData) : (CandleData) - The first (oldest) candle data.
_candle2 (CandleData) : (CandleData) - The second (middle) candle data.
_candle3 (CandleData) : (CandleData) - The third (newest) candle data.
Returns: (ThreeCandleData) - ThreeCandleData object containing ThreeCandlePattern.
Naming Utilities
getPatternName(_pattern)
getPatternName - Returns the string name of a candle pattern.
Parameters:
_pattern (CandlePattern) : (CandlePattern) - The candle pattern enum value.
Returns: (string) - Human-readable pattern name (e.g., "Hammer").
getTwoCandlePatternName(_pattern)
getTwoCandlePatternName - Returns the string name of a two-candle pattern.
Parameters:
_pattern (TwoCandlePattern) : (TwoCandlePattern) - The two-candle pattern enum value.
Returns: (string) - Human-readable pattern name (e.g., "Bullish Engulfing").
getThreeCandlePatternName(_pattern)
getThreeCandlePatternName - Returns the string name of a three-candle pattern.
Parameters:
_pattern (ThreeCandlePattern) : (ThreeCandlePattern) - The three-candle pattern enum value.
Returns: (string) - Human-readable pattern name (e.g., "Morning Star").
getSizeName(_size)
getSizeName - Returns the string name of a candle size.
Parameters:
_size (CandleSize) : (CandleSize) - The candle size enum value.
Returns: (string) - Human-readable size name ("Short", "Normal", or "Long").
getDirectionName(_direction)
getDirectionName - Returns the string name of a candle direction.
Parameters:
_direction (CandleDirection) : (CandleDirection) - The candle direction enum value.
Returns: (string) - Human-readable direction name ("Bullish", "Bearish", or "Neutral").

Displacement## Displacement Indicator (Institutional Momentum Filter)
This indicator highlights **true price displacement** — candles where price moves with **abnormal force relative to recent volatility**.
It is designed to help traders distinguish **real momentum** from normal market noise.
Displacement often precedes:
- Breaks of structure
- Fair Value Gaps (FVGs)
- Strong continuation or meaningful pullbacks
This tool focuses on **confirmation**, not prediction.
---
### 🔍 How Displacement Is Defined
A candle is marked as *displacement* only when **all conditions are met**:
• Candle body is larger than a multiple of ATR (volatility-adjusted)
• Candle body makes up a high percentage of the full candle (strong close)
• Directional conviction (bullish or bearish close)
This filters out:
- Small or average candles
- Wick-heavy indecision
- Low-quality breakouts
---
### 🎯 What This Indicator Is Best Used For
✔ Confirming impulsive moves
✔ Validating structure breaks
✔ Anchoring Fair Value Gaps
✔ Filtering low-probability setups
✔ Identifying institutional participation
Works best on **M5, M15, and H1**, especially during **London and NY sessions**.
---
### ⚠️ Important Notes
• This is **not** a buy/sell signal by itself
• Best used with trend, structure, or liquidity context
• Not designed for ranging or low-volatility markets
Think of this indicator as a **momentum truth filter** —
if displacement is missing, conviction is likely missing too.
---
### ⚙️ Inputs Explained
• ATR Length – defines normal volatility
• ATR Multiplier – how aggressive displacement must be
• Minimum Body % – ensures strong candle closes
All inputs are adjustable to fit different markets and styles.
---
### 🧠 Philosophy
Displacement reflects **commitment**, not anticipation.
This tool helps you wait for **proof**, not hope.
---
If you want, I can:
- Tighten this for **ICT-style language**
- Rewrite for **beginner clarity**
- Add a **“How I personally use it”** section
- Optimize it for **TradingView algorithm visibility**
**Tell me which you want changed.**

GC1! H1 Stats+GC1! H1 Stats - Detailed Prob & Excursion Indicator
Overview
GC1! H1 Stats - Detailed Prob & Excursion is a specialized statistical overlay indicator for TradingView, tailored for Gold futures (GC1!) on a 1-hour framework. It provides real-time insights into the probability of price returning to the hourly open after sweeping the previous hour’s high (PHH) or previous hour’s low (PHL), based on historical data segmented by hour (0–23) and 20-minute intervals. The indicator visualizes these sweeps with lines, labels, circles, background fills, and “excursion zones” (also called “Magic Boxes”) that highlight median/mean extensions post-sweep, along with percentile lines (75th / 90th / 95th) for gauging potential “pain” or extreme moves. This tool is designed for intraday Gold traders focusing on liquidity sweeps and mean-reversion behavior, helping to quantify edge using empirical probabilities and excursion statistics.
The data is hardcoded from extensive historical analysis of GC1! behavior (e.g., probabilities ranging roughly from ~7% to ~91%, with sample sizes up to 2000+ per segment), making it a backtested reference rather than a dynamic learning model. It emphasizes visual clarity during active hours, with options to filter for Regular Trading Hours (RTH: 09:00–15:59 ET) or high-probability (>70%) events only. Note: This is an educational tool for analyzing market structure; it does not predict future performance or provide trading signals/advice. Past data does not guarantee future results, and users should backtest on current conditions (as of December 2025 data availability) and use at their own risk, in compliance with TradingView’s house rules.
________________________________________
Key Features
• Sweep Detection & Probability Labels: Identifies when price breaks PHH (upside) or PHL (downside), displaying a centered label with probability of returning to the hourly open, sample size (N), time of sweep, and a checkmark (✅) if the open is retested post-sweep.
• Visual Lines & Markers: Draws hourly open (h.o.), PHH, and PHL lines with customizable styles/colors; adds small circles on sweep bars for quick spotting.
• Breakout→Open Background Fill: Shaded zone from sweep bar until price returns to open, visualizing extension duration and retracement.
• Excursion (Pain) Zone - “Magic Box”: Post-sweep box showing median/mean extension percentages, colored dynamically by probability (green high, orange mid, red low); includes dashed lines for 75th/90th/95th percentiles to mark statistical extremes.
• Time-Segmented Data: Probabilities and excursions vary by hour (0–23) and 20-min segments (0–19 min: _0, 20–39: _1, 40–59: _2), capturing intraday nuances (e.g., higher probs in early/late hours).
• Filters for Focus: RTH-only mode hides non-session elements; high-prob-only shows >70% events to reduce noise.
• Alerts: Triggers on PHH/PHL sweeps with messages for chart checks.
________________________________________
How It Works
• Data Foundation: Uses pre-computed maps for probabilities (prob_high_taken/prob_low_taken), sample sizes, and excursions (mean, median, p75/p90/p95 as percentages of open). Data is initialized on the first bar via f_init_high_data() and f_init_low_data(), covering 24 hours with 3 segments each (e.g., key "9_1" for 09:20–09:39). Probabilities represent historical likelihood of price returning to open after sweep; excursions quantify average/rare extensions (e.g., 0.156% mean = 0.156% of open price).
• Period Detection: On new 1H bars (new_period_bar), resets visuals, draws lines for open/PHH/PHL extending 1 hour forward, and labels if enabled. Uses request.security on standard ticker for real OHLC, bypassing chart transformations (e.g., Heikin Ashi).
• Sweep Logic: On each bar, checks if real high > PHH or real low < PHL. If so, fetches segment-specific data (hour + floor(minute/20)), displays probability label centered mid-hour. Skips if filtered (RTH-only or <70% prob).
• Excursion Visualization: If enabled, draws “Magic Box” from 1-min to 58-min into the hour, bounded by mean/median levels (top/bottom adjusted for high/low sweep). Adds percentile lines with labels (e.g., “75%”) at right end. Box color reflects prob strength for quick bias assessment.
• Retest Check: Monitors for open retest post-sweep (high/low cross open, or gap scenarios from prev bar). Adds ✅ to label if hit on subsequent bars (skips sweep bar to avoid false positives). Stops background fill on retest or at 58-min mark.
• Background Fill: Activates on sweep, shades until retest, using user color.
• Cleanup & Performance: Manages labels in arrays, clears on new periods; no excess drawing beyond max counts (500 lines/labels/boxes).
This setup blends statistical backtesting with real-time visualization: hardcoded data provides empirical probabilities/excursions (reducing subjectivity in breakouts), while dynamic elements (lines, fills, boxes) overlay structure on the chart. It helps Gold traders assess if a sweep is “high-edge” (e.g., >70% probability of reverting) or likely to run (low probability, high excursion), pairing historical context with current price action.
________________________________________
Settings and Customization
Inputs are grouped for ease:
1. Settings:
o Show RTH Only (9:00–15:59): Restricts to main session (default: false; tooltip: for RTH-focused stats).
o Show High Prob Only (>70%): Filters low-prob sweeps visually (default: false; tooltip: highlights confidence).
2. Visuals:
o Show Line Labels: Toggle “h.o.” / “phh” / “phl” (default: true).
o Period Open Line Color: Gray 50% (default).
o Previous High/Low Line Colors: Gray 100% (default).
o Open Line Style/Width: Dotted/1 (default; options: Solid/Dotted/Dashed).
3. Breakout→Open Background:
o Show Breakout→Open Background: Toggle fill (default: true).
o Fill Color: Teal 85% (default).
4. Breakout Circles:
o Show Breakout Circles: Toggle (default: true).
o PHH/PHL Break Circle Colors: White 20% (default).
5. Info Label Style:
o Text Size: Small (default; options: Auto/Tiny/Normal/Large/Huge).
o Label Text Color: White (default).
o Low/Mid/High Probability Colors: Red 20% / Orange 20% / Green 20% (default).
6. Excursion (Pain) Zone:
o Show Excursion Zone: Toggle Magic Box (default: true).
o Excursion Box Color: Gray 75% (default; dynamic overrides).
o 75th/90th/95th Percentile Lines: Orange 30% / Red 30% / Dark Red 100% (default).
No additional tables/plots; all elements are lines/labels/boxes for overlay focus.
________________________________________
Usage Tips
• Breakout Trading: Watch for sweeps with high probability (>70%, green label) as potential fades back to open; low probability (red) may signal runs—use the excursion box for targets (e.g., exit at 90th percentile for extremes).
• Time Awareness: Probabilities often peak in key liquidity windows and drop in quieter hours; segments capture momentum shifts (e.g., _2 often lower prob).
• RTH Focus: Enable for cleaner stats during high-liquidity session hours; disable for a 24-hour view.
• Visual Filtering: Use high-prob-only in volatile conditions to reduce noise; combine with volume or other confluence tools for confirmation.
• Alerts Integration: Set TradingView alerts on sweeps; check label for probability/N before acting.
• Chart Setup: Best on 1H or lower GC1! charts; adjust text size for readability on smaller screens.
• Backtesting: Manually review historical sweeps against data maps to validate; update hardcoded values if new data emerges (as of 2025).
________________________________________
Limitations
• Fixed Data: Hardcoded stats may not reflect recent market changes (e.g., post-2025 regime shifts); not adaptive.
• Reactive Only: Detects sweeps after they occur; no predictive signals.
• Timeframe Specific: Locked to 1H logic; may not translate to other assets/timeframes without recoding data.
• Visual Clutter: On busy charts, labels/boxes may overlap—toggle selectively.
• No Live Stats: Sample sizes are historical; real-time N/prob not updated.
• Gaps & Extremes: Handles gaps in retest logic, but rare events (e.g., macro news) may exceed the 95th percentile.
________________________________________
Disclaimer
This indicator is for informational and educational purposes only. Trading involves significant risk of loss and is not suitable for all investors. The hardcoded data represents past Gold futures (GC1!) performance and does not guarantee future outcomes. No claims of profitability are made—results depend on market conditions, user strategy, and risk management. Consult a financial advisor before trading, and backtest extensively. Abiding by TradingView rules, this tool provides no investment recommendations.

Bullish Structure (PAID) by @Crypto_alphabitTVC:GOLD
This script is for bullish structure........
___________________________________
to confirm the bullish structure , the price has to confirm the second higher low to confirm the uptrend ( ⬜️ The key level ) then the other levels will be automatic calculated with mathematic formula .
This indicator contains some important levels as below ....
__________________________________________________
🟥Stop Loss / lowest point
This level is the lowest point or 0 level & you can consider it as Stop Loss
🟫Strong support(0)
This level is very strong support and the price may not come back to that price after making the key level
⬜️The key Level
This level is the second higher low so the bullish structure confirmed for uptrend
🟪accumulation level(1) , 🟪accumulation level(2) , 🟪accumulation level(3)
The price is slowly moving between the 3 accumulation levels but if the price crossed the 3 levels with momentum , means we are in a very strong uptrend
🟫Strong Support(1) , 🟫Strong Support(2)
Those 2 levels are very strong support and strong resistance in the same time
⬜️Resistance
This level is very important as if the price closed above it so it is high probability that the price will go to the safe Exit
🟩Safe Exit
This is safest exit
🟨Golden Exit
This level is the golden exit if the price reached
🟦Extra Exit(1) , 🟦Extra Exit(2) , 🟦Extra Exit(3)
The price may or may not reach the 3 extra exit levels , it depends on the chart analysis, Gaps and momentum .
🟦Final Exit
This is the final target for that wave
In this indicator you can change some inputs to make it perfect as below ....
__________________________________________________
* Lookback Period for High/Low
* Line Width
* Show/ Hide Price Labels
* Label Size
* Extend Drawing for X Bars
* Swing Sensitivity ( Very important)
*** To confirm the bullish momentum you can add MACD indicator as a helper ***
*** To confirm the targets you can match the targets with Gaps ***
________________________________________________________________
This script is by @Crypto_alphabit

Simple Candle Strategy# Candle Pattern Strategy - Pine Script V6
## Overview
A TradingView trading strategy script (Pine Script V6) that identifies candlestick patterns over a configurable lookback period and generates trading signals based on pattern recognition rules.
## Strategy Logic
The strategy analyzes the most recent N candlesticks (default: 5) and classifies their patterns into three categories, then generates buy/sell signals based on specific pattern combinations.
### Candlestick Pattern Classification
Each candlestick is classified as one of three types:
| Pattern | Definition | Formula |
|---------|-----------|---------|
| **Close at High** | Close price near the highest price of the candle | `(high - close) / (high - low) ≤ (1 - threshold)` |
| **Close at Low** | Close price near the lowest price of the candle | `(close - low) / (high - low) ≤ (1 - threshold)` |
| **Doji** | Opening and closing prices very close; long upper/lower wicks | `abs(close - open) / (high - low) ≤ threshold` |
### Trading Rules
| Condition | Action | Signal |
|-----------|--------|--------|
| Number of Doji candles ≥ 3 | **SKIP** - Market is too chaotic | No trade |
| "Close at High" count ≥ 2 + Last candle closes at high | **LONG** - Bullish confirmation | Buy Signal |
| "Close at Low" count ≥ 2 + Last candle closes at low | **SHORT** - Bearish confirmation | Sell Signal |
## Configuration Parameters
All parameters are adjustable in TradingView's "Settings/Inputs" tab:
| Parameter | Default | Range | Description |
|-----------|---------|-------|-------------|
| **K-line Lookback Period** | 5 | 3-20 | Number of candlesticks to analyze |
| **Doji Threshold** | 0.1 | 0.0-1.0 | Body size / Total range ratio for doji identification |
| **Doji Count Limit** | 3 | 1-10 | Number of dojis that triggers skip signal |
| **Close at High Proximity** | 0.9 | 0.5-1.0 | Required proximity to highest price (0.9 = 90%) |
| **Close at Low Proximity** | 0.9 | 0.5-1.0 | Required proximity to lowest price (0.9 = 90%) |
### Parameter Tuning Guide
#### Proximity Thresholds (Close at High/Low)
- **0.95 or higher**: Stricter - only very strong candles qualify
- **0.90 (default)**: Balanced - good for most market conditions
- **0.80 or lower**: Looser - catches more patterns, higher false signals
#### Doji Threshold
- **0.05-0.10**: Strict doji identification
- **0.10-0.15**: Standard doji detection
- **0.15+**: Includes near-doji patterns
#### Lookback Period
- **3-5 bars**: Fast, sensitive to recent patterns
- **5-10 bars**: Balanced approach
- **10-20 bars**: Slower, filters out noise
## Visual Indicators
### Chart Markers
- **Green Up Arrow** ▲: Long entry signal triggered
- **Red Down Arrow** ▼: Short entry signal triggered
- **Gray X**: Skip signal (too many dojis detected)
### Statistics Table
Located at top-right corner, displays real-time pattern counts:
- **Close at High**: Count of candles closing near the high
- **Close at Low**: Count of candles closing near the low
- **Doji**: Count of doji/near-doji patterns
### Signal Labels
- Green label: "✓ Long condition met" - below entry bar
- Red label: "✓ Short condition met" - above entry bar
- Gray label: "⊠ Too many dojis, skip" - trade skipped
## Risk Management
### Exit Strategy
The strategy includes built-in exit rules based on ATR (Average True Range):
- **Stop Loss**: ATR × 2
- **Take Profit**: ATR × 3
Example: If ATR is $10, stop loss is at -$20 and take profit is at +$30
### Position Sizing
Default: 100% of equity per trade (adjustable in strategy properties)
**Recommendation**: Reduce to 10-25% of equity for safer capital allocation
## How to Use
### 1. Copy the Script
1. Open TradingView
2. Go to Pine Script Editor
3. Create a new indicator
4. Copy the entire `candle_pattern_strategy.pine` content
5. Click "Add to Chart"
### 2. Apply to Chart
- Select your preferred timeframe (1m, 5m, 15m, 1h, 4h, 1d)
- Choose a trading symbol (stocks, forex, crypto, etc.)
- The strategy will generate signals on all historical bars and in real-time
### 3. Configure Parameters
1. Right-click the strategy on chart → "Settings"
2. Adjust parameters in the "Inputs" tab
3. Strategy will recalculate automatically
4. Backtest results appear in the Strategy Tester panel
### 4. Backtesting
1. Click "Strategy Tester" (bottom panel)
2. Set date range for historical testing
3. Review performance metrics:
- Win rate
- Profit factor
- Drawdown
- Total returns
## Key Features
✅ **Execution Model Compliant** - Follows official Pine Script V6 standards
✅ **Global Scope** - All historical references in global scope for consistency
✅ **Adjustable Sensitivity** - Fine-tune all pattern detection thresholds
✅ **Real-time Updates** - Works on both historical and real-time bars
✅ **Visual Feedback** - Clear signals with labels and statistics table
✅ **Risk Management** - Built-in ATR-based stop loss and take profit
✅ **No Repainting** - Signals remain consistent after bar closes
## Important Notes
### Before Trading Live
1. **Backtest thoroughly**: Test on at least 6-12 months of historical data
2. **Paper trading first**: Practice with simulated trades
3. **Optimize parameters**: Find the best settings for your trading instrument
4. **Manage risk**: Never risk more than 1-2% per trade
5. **Monitor performance**: Review trades regularly and adjust as needed
### Market Conditions
The strategy works best in:
- Trending markets with clear directional bias
- Range-bound markets with defined support/resistance
- Markets with moderate volatility
The strategy may underperform in:
- Highly choppy/noisy markets (many false signals)
- Markets with gaps or overnight gaps
- Low liquidity periods
### Limitations
- Works on chart timeframes only (not intrabar analysis)
- Requires at least 5 bars of history (configurable)
- Fixed exit rules may not suit all trading styles
- No trend filtering (will trade both directions)
## Technical Details
### Historical Buffer Management
The strategy declares maximum bars back to ensure enough historical data:
```pine
max_bars_back(close, 20)
max_bars_back(open, 20)
max_bars_back(high, 20)
max_bars_back(low, 20)
```
This prevents runtime errors when accessing historical candlestick data.
### Pattern Detection Algorithm
```
For each bar in lookback period:
1. Calculate (high - close) / (high - low) → close_to_high_ratio
2. If close_to_high_ratio ≤ (1 - threshold) → count as "Close at High"
3. Calculate (close - low) / (high - low) → close_to_low_ratio
4. If close_to_low_ratio ≤ (1 - threshold) → count as "Close at Low"
5. Calculate abs(close - open) / (high - low) → body_ratio
6. If body_ratio ≤ doji_threshold → count as "Doji"
Signal Generation:
7. If doji_count ≥ cross_count_limit → SKIP_SIGNAL
8. If close_at_high_count ≥ 2 AND last_close_at_high → LONG_SIGNAL
9. If close_at_low_count ≥ 2 AND last_close_at_low → SHORT_SIGNAL
```
## Example Scenarios
### Scenario 1: Bullish Signal
```
Last 5 bars pattern:
Bar 1: Closes at high (95%) ✓
Bar 2: Closes at high (92%) ✓
Bar 3: Closes at mid (50%)
Bar 4: Closes at low (10%)
Bar 5: Closes at high (96%) ✓ (last bar)
Result:
- Close at high count: 3 (≥ 2) ✓
- Last closes at high: ✓
- Doji count: 0 (< 3) ✓
→ LONG SIGNAL ✓
```
### Scenario 2: Skip Signal
```
Last 5 bars pattern:
Bar 1: Doji pattern ✓
Bar 2: Doji pattern ✓
Bar 3: Closes at mid
Bar 4: Doji pattern ✓
Bar 5: Closes at high
Result:
- Doji count: 3 (≥ 3)
→ SKIP SIGNAL - Market too chaotic
```
## Performance Optimization
### Tips for Better Results
1. **Use Higher Timeframes**: 15m or higher reduces false signals
2. **Combine with Indicators**: Add volume or trend filters
3. **Seasonal Adjustment**: Different parameters for different seasons
4. **Instrument Selection**: Test on liquid, high-volume instruments
5. **Regular Rebalancing**: Adjust parameters quarterly based on performance
## Troubleshooting
### No Signals Generated
- Check if lookback period is too large
- Verify proximity thresholds aren't too strict (try 0.85 instead of 0.95)
- Ensure doji limit allows for trading (try 4-5 instead of 3)
### Too Many False Signals
- Increase proximity thresholds to 0.95+
- Reduce lookback period to 3-4 bars
- Increase doji limit to 3-4
- Test on higher timeframes
### Strategy Tester Shows Losses
- Review individual trades to identify patterns
- Adjust stop loss and take profit ratios
- Change lookback period and thresholds
- Test on different market conditions
## References
- (www.tradingview.com)
- (www.tradingview.com)
- (www.investopedia.com)
- (www.investopedia.com)
## Disclaimer
**This strategy is provided for educational and research purposes only.**
- Not financial advice
- Past performance does not guarantee future results
- Always conduct thorough backtesting before live trading
- Trading involves significant risk of loss
- Use proper risk management and position sizing
## License
Created: December 15, 2025
Version: 1.0
---
**For updates and modifications, refer to the accompanying documentation files.**

Rainbow MA Width█ OVERVIEW
Rainbow MA Width is a companion indicator for Rainbow MA Cloud. It displays ribbon width as a normalized Z-Score, allowing traders to visualize trend momentum expansion and contraction relative to recent history.
█ CONCEPTS
Z-Score Normalization:
Rather than displaying raw width values (which vary by asset and timeframe),
this indicator normalizes the ribbon width using Z-Score calculation:
Z-Score = (Current Width - Average Width) / Standard Deviation
Z-Score Interpretation:
• 0 = Average width (mean)
• +1 to +2 = Expanding (above average, strong trend)
• -1 to -2 = Contracting (below average, weakening trend)
• Beyond ±2 = Extreme (statistical outlier, potential reversal)
Width Calculation Modes:
• Outer — Distance between fastest and slowest MA: |MA1 - MA8|
• Average Gap — Mean of all adjacent MA gaps
• Total Gap — Sum of all adjacent MA gaps
█ FEATURES
1 — Width Mode Selection
Three methods to calculate ribbon width.
"Outer" recommended for aligned trends.
2 — Z-Score Period
Configurable lookback for mean and standard deviation.
Default 20 bars; increase for smoother, less reactive readings.
3 — Zone Fill Coloring
Cyan fill when expanding (Z > 0).
Orange fill when contracting (Z < 0).
Yellow fill for extreme values (|Z| > 2) as warning.
4 — Alignment Background
Green background during bullish alignment.
Red background during bearish alignment.
Synced with Rainbow MA Cloud for consistency.
5 — Reference Lines
Horizontal lines at 0 (mean), ±1σ, and ±2σ levels.
Provides clear visual boundaries for interpretation.
6 — Raw Width Display
Optional secondary line showing original width percentage.
Useful for comparing normalized vs absolute values.
█ HOW TO USE
Trend Confirmation:
• Z-Score rising above 0 confirms trend acceleration
• Z-Score staying above +1 indicates sustained strong momentum
• Use alongside alignment background for confluence
Reversal Warning:
• Z-Score exceeding +2 suggests overextension (yellow warning zone)
• Z-Score dropping below -2 indicates extreme contraction
• Extreme readings often precede trend reversals or consolidation
Entry Timing:
• Enter trends when Z-Score crosses above 0 (expansion beginning)
• Avoid entries when Z-Score is at extreme highs (potential exhaustion)
• Consider exits when Z-Score peaks and begins declining
█ LIMITATIONS
• Z-Score is relative to lookback period; different periods give different readings
• Extreme zones (±2) are statistical guides, not guarantees
• Best used in conjunction with Rainbow MA Cloud for full context
█ ALERTS
Four built-in alert conditions:
• Z-Score crosses above/below zero
• Z-Score enters extreme high/low zones (±2)

Trading Module [BackQuant]Trading Module
A modular overlay that lets you combine three core components, a Trend Model, an Impulse Model, and an optional Stop Loss framework, then layer in a multi-symbol RSI screener plus a full price action toolkit (market structure, FVGs, order blocks, volumetric S/R). Built for discretionary execution and study, not for blind automation.
────────────────────────────────────────────────────────────
What this script is
This indicator is designed like a “module picker”. Instead of forcing one opinionated system, it gives you selectable models that can be combined into a workflow:
1) Trend Model , answers “what side is the market biased to?”
2) Impulse Model , answers “is there currently expansion, pressure, or a momentum event worth paying attention to?”
3) Stop Loss Layer , answers “where are reasonable invalidation zones if I’m managing risk manually?”
4) RSI Screener , answers “what are my watchlist assets doing right now, on multiple timeframes, in one place?”
5) Price Action Concepts , answers “what structure levels, imbalances, institutional zones, and volume-based levels matter?”
You can run it as a lightweight overlay (trend + impulse only), or turn on the heavier price action stack when you want deeper context.
────────────────────────────────────────────────────────────
How to use it, the intended workflow
Step 1, pick your Trend Model
The trend model is your baseline directional filter. It is meant to reduce “random trading” by keeping you aligned with the dominant structure or momentum bias.
Trend Models (examples)
Typical usage:
- If the trend model reads bullish, you focus on long setups and avoid shorting into strength.
- If the trend model reads bearish, you focus on short setups and avoid catching bottoms.
- If the trend model is neutral or mixed, you reduce size or wait for confirmation.
What you can expect from the options (without exposing internal weighting or thresholds):
- Universal Trend+ , a composite trend regime model that blends multiple families of trend evidence. It is designed to be more robust than a single indicator and reduce “one-indicator failure modes”.
- EMA Cross , a classic fast vs slow trend bias. Simple, responsive, but can whipsaw in ranges.
- DEMA ATR , a smoother trend anchor that adapts to volatility. Often cleaner in chop than basic crosses.
- Relative Strength Overlay , a strength scoring style bias built from an RSI-style internal scoring process. Useful when you want “strength state” more than “moving average state”.
Color conventions:
- Long color and short color are user-defined, so you can keep consistent visuals across your BackQuant suite.
Step 2, pick your Impulse Model
Impulse is separate from trend on purpose. Trend answers direction, impulse answers timing. A market can be trending but not currently impulsing, or impulsing in a counter-trend squeeze.
Impulse Models (examples)
How to use impulse signals:
- Treat impulse as “permission” to engage, not as a standalone trade trigger.
- Best pairing is trend aligned impulse, meaning bullish trend model plus bullish impulse, bearish plus bearish.
- Counter-trend impulses can be used as warning signals, take-profit cues, or short-lived mean reversion opportunities, depending on your style.
The impulse options in this module are built around pressure and expansion detection. They are meant to identify moments where conditions shift from “noise” to “initiative activity”.
Step 3, choose a Stop Loss framework
This script includes optional stop visualization modes. These are not meant to be blindly used as a “one true stop”, they are tools for structuring invalidation around volatility or defined percentage bands.
Stop Loss (examples)
Stop loss options:
- None , no overlay.
- Dynamic , a volatility-aware band. Useful when you want stops to widen in high vol and tighten in low vol.
- Fixed , preset percentage bands. Useful for quick structure around risk units, scaling, or rule-based journaling.
- Bar-to-Bar , a micro-structure invalidation reference that uses the prior bar as a risk anchor. Useful for very tight management and fast invalidation.
How to apply them properly:
- Stops should be placed where the trade idea is wrong, not where you “feel pain”.
- A volatility stop is usually an environment stop, while a fixed stop is usually a plan stop.
- If you use impulses for entries, your stop should account for impulse volatility, otherwise you get stopped on the exact move you’re trying to capture.
────────────────────────────────────────────────────────────
RSI Screener module
This module is built for scanning multiple symbols and timeframes from one chart, without switching tabs.
RSI Screener (example)
What it does:
- Lets you define up to 10 symbols (defaults to major crypto pairs).
- Each slot can have its own timeframe.
- Computes an RSI value per symbol and assigns a directional state relative to a midline threshold.
- Displays a stacked overlay readout using a monospace label style for quick scanning.
How to use it:
- Set slots 1–5 as your majors, 6–10 as your rotation candidates.
- Use higher timeframes for regime, lower timeframes for timing.
- Use the midline threshold as a “trend bias” line, not an overbought or oversold line.
- Treat the screener as context, not a signal. Your chart model and price action still decide the trade.
Performance note:
- Screeners are heavy by nature because each symbol is a security() request. Keep the number of enabled slots reasonable if you are on lower-end hardware or running many scripts.
────────────────────────────────────────────────────────────
Price Action Concepts and Market Structure stack
This script includes a full price action toolkit intended to provide “where” context, levels, zones, and structural breaks, so the trend and impulse models are not operating in a vacuum.
Price Action Concepts / Market Structure (example)
This section is split into five major blocks:
1) Market Structure, Swing and Internal
You can enable swing structure and internal structure separately, with independent lookbacks.
- Swing structure tracks larger, slower pivots, better for macro trend structure.
- Internal structure tracks tighter pivots, better for entry timing and micro shifts.
It prints structure events as:
- BOS (Break of Structure), continuation-style break.
- MSB (Market Structure Break), shift-style break. Some traders call this CHoCH, here it’s presented as an MSB concept.
Usage:
- Swing BOS is good for confirming a larger regime.
- Internal structure is good for timing entries within the swing context.
- If internal flips but swing does not, treat it as a warning, not necessarily a full reversal.
2) Fair Value Gaps (FVG)
Optional imbalance boxes that highlight displacement zones.
Key controls:
- Timeframe selection (or current timeframe).
- How many to keep on chart.
- How far to extend them right.
Usage:
- FVGs are best treated as “areas of interest”, not guaranteed support/resistance.
- They help you frame where price might rebalance after an impulse event.
3) Order Blocks (OB)
Optional institutional-style zones detected from structure and candle logic, with filters.
Key controls:
- Fractal type (3 or 5) changes how “strict” structure detection is.
- Break method (close vs high/low) changes confirmation strictness.
- Optional filter with FVG distance to reduce low-quality blocks.
- Extend, delete-when-filled, and label options for chart hygiene.
Usage:
- OBs are strongest when aligned with swing context and confirmed by volume or displacement.
- Filled blocks are informational, they can be removed to reduce clutter.
4) Volumetric Support and Resistance
This module creates support and resistance “zones” based on high-volume pivot events, then manages them over time.
Key controls:
- Detection sensitivity, volume multiplier, and lookback period.
- Minimum distance between zones to avoid stacking duplicates.
- Remove broken, extend, and volume display toggles.
How to interpret:
- Levels are thicker zones, not single price lines.
- “Touches” are tracked as an interaction count, useful for identifying repeatedly defended or attacked zones.
- High-volume zones are visually emphasized, these tend to matter more than low volume pivots.
Usage:
- Pair volumetric levels with impulse signals, an impulse into a high-volume resistance zone is not the same as an impulse in open space.
- Use volumetric levels as structure anchors for invalidation and targets.
5) Alerts
The price action stack includes alerts for new levels, touches, breaks, and order block creation or interaction.
Use alerts for:
- Watchlist management, you get notified when price hits an area.
- Avoiding screen-watching, especially when you run multi-timeframe setups.
────────────────────────────────────────────────────────────
Core philosophy of the module
This indicator is not “one model to rule them all”. It is meant to let you build a trading process:
- Trend decides bias.
- Impulse decides engagement timing.
- Price action decides location and structure.
- Stops decide risk containment.
- Screener decides where to look.
If you only use one layer, you are throwing away most of the edge this style of framework is designed to create. The strength is in confluence and filtering.
────────────────────────────────────────────────────────────
Suggested presets
Preset A, clean trend-following overlay
- Trend Model, Universal Trend+ or DEMA ATR
- Impulse Model, either option
- Stop Loss, Dynamic
- Price action modules off (structure off, FVG off, OB off, volumetric off)
- Screener on (high timeframe)
Preset B, execution and structure mode
- Trend Model on
- Impulse Model on
- Market Structure on (swing + internal)
- FVG on (current timeframe or one higher)
- Order Blocks on with FVG filter
- Volumetric S/R on
- Stop Loss, Dynamic or Bar-to-Bar depending on speed
Preset C, watchlist scanner mode
- Screener on
- Minimal chart overlays on
- Use alerts for touches and breaks
- Only open charts that show alignment across trend and impulse
────────────────────────────────────────────────────────────
Notes and limitations
- This is a heavy script when multiple modules are enabled, because it draws objects and can request multiple symbols.
- The models are designed to be modular, so not every combination will be optimal for every market or timeframe.
────────────────────────────────────────────────────────────
Quick input map
Main Settings/Models
- Select Trend Model
- Select Impulse Model
- Select Stop Loss
- Show Screener
- Long/Short colors
Screener Settings
- Label size and offsets
- RSI length and midline
- Up to 10 symbol slots with per-slot timeframe and enable toggle
Market Structure
- Swing and internal structure mode and lookbacks
- Bull and bear colors
Fair Value Gaps
- Enable, count, timeframe, extend, colors
Order Blocks
- Enable, labels, fractal type, break method
- FVG filter and distance
- Lookback, extend, delete-when-filled, colors
Volumetric S/R
- Sensitivity, volume multiplier, analysis window
- Level limits, distance rules, extension and cleanup rules
- Volume display preferences
────────────────────────────────────────────────────────────
End note
This is intended as a full visual decision-support module for discretionary traders who want trend, timing, structure, and watchlist scanning in one place. Use it to build a repeatable process, then validate that process with proper testing and journaling before risking real capital.

Normalized Volume Dynamics [NVD]Concept & Overview
**Normalized Volume Dynamics (NVD)** is a volume analysis indicator designed to reduce time-of-day noise and highlight unusual volume behavior relative to historical conditions.
Most standard volume indicators compare current volume to a rolling average, which can lead to misleading readings during naturally active periods.
**NVD** addresses this by using a time-normalized volume baseline, comparing the current bar’s volume to volume observed at the same intraday bar position across prior sessions, rather than to a generic moving average.
This approach helps distinguish expected activity from statistically abnormal volume.
**Market Suitability**
The time-normalized logic depends on consistent intraday data structure.
**Crypto (24/7 Markets):**
Continuous trading provides consistent intraday alignment, making normalization most reliable.
**Futures:**
Continuous futures contracts with minimal session gaps generally work well.
**Stocks & Forex:**
Session gaps, holidays, and irregular trading hours may introduce minor baseline drift. While the indicator remains functional, continuous markets are preferred for best accuracy.
**How the Indicator Works**
NVD combines three core components:
**1. Time-Normalized Volume Baseline**
Current volume is compared against the average volume of the same intraday bar position over prior sessions.
* Filters out predictable time-based volume patterns
* Highlights volume that exceeds what is historically typical for that point in the session
* Automatically falls back to a smoothed volume average on non-intraday charts or limited history
**2. Efficiency Oscillator (Lower Panel)**
The histogram evaluates the relationship between price movement and volume effort, showing how efficiently price is moving.
Color interpretation:
* **Green Columns:** Buying pressure with high efficiency (Trend is healthy).
* **Red Columns:** Selling pressure with high efficiency.
* **Yellow Columns:** Volume Spike. Abnormal volume detected (2x average) indicating a potential breakout or exhaustion.
* **Grey Columns:** Absorption/Churn. Volume is present but price is not moving significantly. This often happens before a violent move
**3. Informational Flow Signals (Main Chart)**
The indicator can mark candles where unusual volume coincides with price rejection. These markers are informational and require multiple conditions:
* Volume exceeds the selected baseline by a user-defined multiplier
* Price makes a new local high or low but closes back within the candle range, indicating rejection
* Optional Money Flow Index (MFI) filter confirms an overbought or oversold condition
**Dashboard Overview**
An optional dashboard provides a compact summary of the indicator’s internal states for quick reference.
The dashboard displays:
**Trend State (ADX)**
* Uses ADX to classify conditions as **TRENDING** or **RANGING**
* Helps contextualize whether volume behavior is occurring in a directional environment
**Flow Bias**
* Derived from the Efficiency Oscillator and VWAP relationship
* Displays:
**BUYING**
**SELLING**
**ABSORPTION** (low efficiency / churn)
* An arrow indicates whether price is positioned above or below VWAP
**Volume Status**
* Indicates whether current volume qualifies as a high-volume condition relative to the selected baseline
* Matches the logic used for histogram coloring and informational markers
**Multi-Timeframe Support**
* The dashboard can optionally run on a separate timeframe
* Users may choose to sync the histogram with the dashboard timeframe or keep it on the chart timeframe
*Note: The dashboard summarizes internal calculations and does not generate independent trade signals. All values update on confirmed bars.*
**How to Trade: "INFO" Signals**
The chart arrows are labeled **INFO BUY** and **INFO SELL** to emphasize that these are informational warnings of stopping volume, not blind entry signals.
**INFO BUY (Green Arrow):**
* **The Logic:** Sellers pushed price to a low, but massive volume entered to absorb the sell pressure, forcing a close in the upper range. This is a "Bear Trap" or Liquidity Sweep.
* **Usage:** If you are Short, this is a warning to tighten stops. If looking for Longs, wait for price to break the high of the signal candle for confirmation.
**INFO SELL (Red Arrow):**
* **The Logic:** Buyers pushed price to a high, but massive volume entered to block the move, forcing a close in the lower range. This is a "Bull Trap."
* **Usage:** If you are Long, this indicates overhead resistance/supply. If looking for Shorts, wait for price to break the low of the signal candle.
**Features & Settings**
* Time-Normalized or Recent-Average volume calculation modes
* Efficiency histogram with absorption and volume spike detection
* Optional MFI filter for informational signals
* VWAP-based contextual filter
* Dashboard showing trend state, flow bias, and volume status
* Non-repainting alerts triggered on bar close
**Recommended Usage**
* Higher timeframes (5m and above) generally provide clearer structure
* On lower timeframes, increasing the analysis period can help reduce noise
* Designed to be used as a supporting analysis tool, not a standalone system
**Disclaimer**
*This indicator is provided strictly for educational and informational purposes. It does not constitute financial, investment, trading, or other professional advice.*
*All calculations, visualizations, and signals produced by this indicator are derived solely from historical price and volume data. No representation is made that the indicator can predict future market behavior or outcomes. Any interpretations drawn from its output are the sole responsibility of the user.*
*Trading and investing involve substantial risk, including the possible loss of all or more than the initial capital. Market conditions can change rapidly, and past market behavior, patterns, or indicator performance do not guarantee similar results in the future.*
*The informational markers, alerts, dashboard readings, and histogram values generated by this indicator are not trade recommendations and should not be used as the sole basis for making trading decisions. Users are encouraged to combine this tool with their own analysis, risk management, and confirmation methods.*
*The author assumes no responsibility or liability for any trading decisions, losses, or damages resulting directly or indirectly from the use of this indicator. By using this script, you acknowledge that you are solely responsible for your trading decisions and outcomes.*
*Use at your own risk.*

Swing Elite Supply & Demand MTFSwing Elite Supply & Demand MTF
This indicator automates Supply & Demand zone detection using the classic base-candle pattern methodology, enhanced with multi-timeframe confluence and zone strength classification.
How Zones Are Detected
The algorithm identifies zones by scanning for the Leg-Base-Leg structure that defines institutional order flow areas. A valid zone requires three components: an initial directional candle (the "leg in"), one or more consolidation candles forming the base, and an explosive breakout candle (the "leg out") that confirms institutional participation.
Base candles are identified using a body-to-range ratio threshold — candles where the body occupies less than 55% of the total range qualify as indecision/accumulation. The explosive candle must have a body ratio exceeding 50% and must close beyond the base boundaries, confirming genuine breakout rather than false signals.
Zone boundaries are drawn from the base candles, with two width options: "Preferred" uses the candle bodies for tighter zones, while "Wider" extends to the full wick range for more conservative entries.
Pattern Classification
Zones are labeled by their formation pattern. RBR (Rally-Base-Rally) and DBR (Drop-Base-Rally) indicate demand zones, while DBD (Drop-Base-Drop) and RBD (Rally-Base-Drop) mark supply zones. This classification helps traders understand the preceding price action context.
Level on Level (LOL) Strength
When a new zone forms that overlaps an existing zone of the same type by a configurable percentage, the zones merge into a "Level on Level" formation. These stacked zones represent areas where institutional orders have accumulated multiple times, suggesting stronger support or resistance. LOL zones use stricter mitigation rules — they're only removed when price closes through them entirely, rather than the standard percentage penetration.
FLIP Level Detection
The indicator tracks swing highs and lows using pivot detection. When price breaks a significant swing level and subsequently forms a zone that encompasses that broken level, it's marked as a "FLIP" zone. These represent potential support-turned-resistance or resistance-turned-support areas — a key concept in price action trading.
Big Brother Multi-Timeframe Confluence
The "Big Brother" feature detects zones on a higher timeframe and checks whether current-timeframe zones fall within them. Zones with higher-timeframe coverage are labeled with "BB" and the confirming timeframe. This helps traders prioritize zones that align with larger structural levels. The higher timeframe auto-selects based on the zone timeframe (e.g., 15m zones check against 4H, daily zones check against weekly).
Zone Management
Zones are automatically removed when mitigated. Standard zones use percentage-based mitigation (default 25% penetration), while LOL zones require a full close beyond the zone. Additionally, zones that have been touched but see price move beyond a configurable R-multiple distance are removed, preventing stale zones from cluttering the chart.
Gap Finder
The indicator also identifies unfilled price gaps — areas where consecutive candles don't overlap. These gaps often act as magnets for price and can provide additional confluence when aligned with supply or demand zones.
Practical Application
This tool is designed for traders who use Supply & Demand methodology but want objective, consistent zone identification. The strength classification (standard, LOL, FLIP, BB confluence) helps prioritize which zones deserve attention. The built-in stop loss calculation provides a starting point for risk management based on zone dimensions.

Suspension Blocks [TakingProphets]-----------------------------------------------------------------------------------------------
SUSPENSION BLOCKS
-----------------------------------------------------------------------------------------------
Suspension Blocks are a new ICT concept designed to highlight price inefficiencies created by displacement and body-to-body gaps across a precise 3-candle sequence. These structures represent areas where price was temporarily “suspended” before continuation, often acting as high-probability reaction zones on future revisits.
This indicator automatically detects, visualizes, manages, and invalidates Suspension Blocks in real time, while intelligently limiting chart clutter to only the most relevant structures near current price.
-----------------------------------------------------------------------------------------------
PURPOSE AND SCOPE
-----------------------------------------------------------------------------------------------
- Detect ICT-style Bullish and Bearish Suspension Blocks using strict 3-candle body relationships
- Require measurable body-to-body separation defined in true ticks (instrument-aware)
- Automatically draw and extend Suspension Blocks forward in time
- Invalidate blocks only when price decisively closes beyond the defining boundary
- Optionally display Consequent Encroachment (50% equilibrium) within each block
- Limit on-chart visibility to the closest N blocks per side relative to current price
- Provide session-based, directional alerting for new block formations
-----------------------------------------------------------------------------------------------
WHAT IS A SUSPENSION BLOCK
-----------------------------------------------------------------------------------------------
A Suspension Block is a 3-candle displacement pattern defined by body gaps on both sides of a middle candle.
Bullish Suspension Block logic:
- Candle 1 close is BELOW Candle 2 open by at least the Minimum Body Separation
- Candle 3 open is ABOVE Candle 2 close by at least the Minimum Body Separation
- Candle 3 open is ABOVE Candle 1 close to ensure a valid vertical range
- The block spans from Candle 1 close (low) to Candle 3 open (high)
- The block remains valid until price CLOSES below Candle 1 close
Bearish Suspension Block logic (mirror conditions):
- Candle 1 close is ABOVE Candle 2 open by at least the Minimum Body Separation
- Candle 3 open is BELOW Candle 2 close by at least the Minimum Body Separation
- Candle 3 open is BELOW Candle 1 close to ensure a valid vertical range
- The block spans from Candle 1 close (high) to Candle 3 open (low)
- The block remains valid until price CLOSES above Candle 1 close
All calculations are performed using true tick values via `syminfo.mintick` to ensure precision across instruments.
-----------------------------------------------------------------------------------------------
GENERAL SETTINGS
-----------------------------------------------------------------------------------------------
- Minimum Body Separation (ticks)
- Defines the minimum required body-to-body gap between candles
- Measured in true ticks (0.25 = quarter tick, 1.0 = full tick, etc.)
- Max Visible Blocks per Side
- Limits the number of bullish and bearish blocks displayed
- Only the closest blocks to current price remain visible
-----------------------------------------------------------------------------------------------
VISUALIZATION SETTINGS
-----------------------------------------------------------------------------------------------
- Bullish Suspension Blocks
- Toggle bullish block visibility
- Custom fill color with adjustable transparency
- Optional border with selectable line style (Solid / Dashed / Dotted)
- Bearish Suspension Blocks
- Toggle bearish block visibility
- Custom fill color with adjustable transparency
- Optional border with selectable line style (Solid / Dashed / Dotted)
- Consequent Encroachment (CE)
- Optional 50% equilibrium line drawn inside each block
- Custom color and line style
- Automatically extends with the block
Blocks dynamically extend to the current bar and are hidden or shown based on proximity to price to keep the chart clean and actionable.
-----------------------------------------------------------------------------------------------
BLOCK MANAGEMENT & INVALIDATION
-----------------------------------------------------------------------------------------------
- Each block is stored persistently and extended forward bar-by-bar
- Bullish blocks are invalidated only when price CLOSES below the block low
- Bearish blocks are invalidated only when price CLOSES above the block high
- Invalidated blocks and their CE lines are automatically removed
- Visibility logic ensures only the most relevant structures are emphasized
-----------------------------------------------------------------------------------------------
ALERT SYSTEM
-----------------------------------------------------------------------------------------------
- Optional alerts when new Suspension Blocks form
- Independent toggles for bullish and bearish alerts
- Fully customizable alert messages
- Alerts can be restricted to specific trading sessions:
- Session 1 (default: 09:30–16:00 NY)
- Session 2 (optional)
- Session 3 (optional)
- Alerts include ticker and timeframe context automatically
-----------------------------------------------------------------------------------------------
BEST USE CASES
-----------------------------------------------------------------------------------------------
- High-probability reaction zones after displacement
- Confluence with liquidity, PD arrays, and market structure
- Execution refinement within ICT-based models
- Intraday and higher-timeframe contextual bias
- Clean, rules-based identification of inefficiency zones
-----------------------------------------------------------------------------------------------
DISCLAIMER
-----------------------------------------------------------------------------------------------
This indicator is provided for educational and analytical purposes only. It does not constitute financial advice. Trading involves risk, and past performance is not indicative of future results.
© TakingProphets
-----------------------------------------------------------------------------------------------

Neosha Concept V4 (NY Time)
Imagine the financial market as a huge ocean. Millions of traders throw orders into it every second. But beneath all the noise, there is a powerful current that quietly controls where the waves move. That current is not a person, not a trader, and not random—it is an algorithm.
This algorithm is called the Interbank Price Delivery Algorithm (IPDA).
Think of it as the “navigation system” that guides price through the market.
IPDA has one job:
to move prices in a way that keeps the market efficient and liquid.
To do this, it constantly looks for two things:
1. Where liquidity is hiding
Liquidity is usually found above highs and below lows—where traders place stop losses. The algorithm moves price there first to collect that liquidity.
2. Where price became unbalanced
Sometimes price moves too fast and creates gaps or imbalances. IPDA returns to those areas later to “fix” the missing orders.
Once you start looking at the charts with this idea in mind, everything makes more sense:
Why price suddenly spikes above a high and crashes down
Why big moves leave gaps that price later fills
Why the market reverses right after taking stops
Why trends begin only after certain levels are hit
These are not accidents.
They are the algorithm doing its job.
Price moves in a repeating cycle:
Gather liquidity
Make a strong move (displacement)
Return to fix inefficiency
Deliver to the next target
Most beginners only see the candles.
But once you understand IPDA, you see the intention behind the candles.
Instead of guessing where price might go, you begin to understand why it moves there.
And once you understand the “why,” your trading becomes clearer, calmer, and far more accurate.
