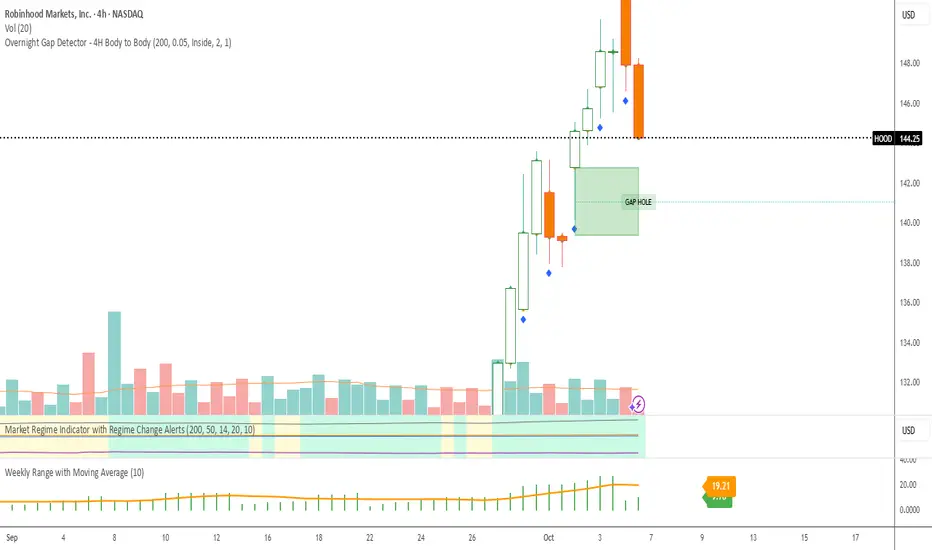
Overnight Gap Detector Overnight Gap Detector - 4H Body to Body
What it detects:
The indicator finds overnight gaps - i.e., gaps between trading days based on 4-hour (4H) candle data.
Gap Definition (Wick to Wick):
Gap UP: When yesterday's 4H candle's highest point (high) is BELOW today's 4H candle's lowest point (low) - there's "air" between them
Gap DOWN: When yesterday's 4H candle's lowest point (low) is ABOVE today's 4H candle's highest point (high)
Rectangle Drawing (Body to Body):
Although the gap is detected via wicks, the rectangle is only drawn between the bodies:
Gap UP: Draws from today's open to yesterday's body top (max of open/close)
Gap DOWN: Draws from yesterday's body bottom (min of open/close) to today's open
This means the rectangle does NOT cover the wicks, only the actual gap between bodies.
Midline:
50% line between top and bottom of the gap rectangle
Continues to the right along with the rectangle
Stops when the gap is filled
Gap Filled:
A gap is marked as "filled" when:
Gap UP: Price's close goes DOWN and reaches yesterday's body top
Gap DOWN: Price's close goes UP and reaches yesterday's body bottom
Important: Only close body counts, not wicks!
Visual Elements:
Green box: Gap Up (upward gap)
Red box: Gap Down (downward gap)
Yellow box: Filled gap
Labels: "GAP HOLE" when active, "FILLED gap" when filled
Midline: Dotted line through the middle of the gap
Features:
✅ Works on all timeframes (5min, 15min, 1H, 2H, 4H, etc.) - always uses 4H data
✅ Rectangles expand bar by bar until filled
✅ Customizable colors for gaps, borders, midlines, and labels
✅ Label position (inside or outside box)
✅ Toggle to show/hide labels and midlines
✅ Minimum gap size filter (%)
Pesquisar nos scripts por "gaps"
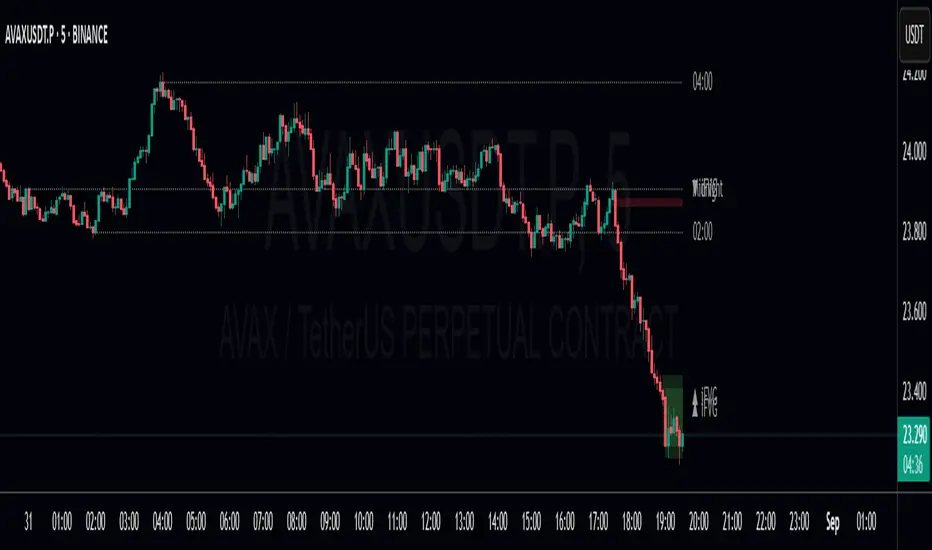
Fair Value Gap / iVFG / Imbalance / MTF SuiteDescription
This indicator detects Fair Value Gaps (FVGs) and Imbalances across up to 10 user-selected timeframes and manages them with precise retest handling and clean visualization options.
What’s unique
3-candle FVG detection per timeframe (no lookahead).
Retest handling: on the first touch the touched edge snaps to the retest wick and the zone recolors (fresh → retested).
Right-side projection limits to avoid endless extensions.
Deterministic multi-TF overlay: HTF zones are computed independently (lookahead off) and drawn in a stable, priority-based order.
iFVG / parked zones: optionally convert a filled gap into an iFVG (parked/blue) instead of deleting/greying it.
Optional Imbalance Add-on (3-candle), with split halves + 50% midline.
How it works (technical)
FVG logic (3 candles):
Bullish when low > high (gap up); Bearish when high < low (gap down).
The created box spans the untraded range of candle B and starts at time .
Retest behavior:
On the first wick-touch, the nearest boundary adapts to the wick extreme. If enabled, the box recolors to a “retested” palette.
Projection:
Boxes extend to the right; optional bar limit constrains length.
Display limits:
FIFO pruning per direction keeps only the newest N boxes; iFVG/grey pools can share or use separate limits.
Imbalance Add-on (optional):
Classic 3-candle imbalance; draws upper/lower halves and an optional 50% midline.
No lookahead / confirmation:
Calculations run with barmerge.lookahead_off; detection finalizes on bar close (repaint-free on close).
How to use
Treat fresh gaps as potential reaction zones or confluence with liquidity / structure.
Use retested gaps for continuation or rejection logic.
Limit right-projection and visible count to keep charts readable on lower TFs.
Combine with your own execution rules (entries, stops, partials).
Key settings
General: adjust/recolor on retest, right-side limit (bars).
Display Limits: max visible per direction; separate iFVG cap if desired.
Visuals: filled vs. outline, transparency, TF labels (auto or custom), label alignment.
Theme: presets (Pegasus Classic, Icefire, Solarized, Heatmap, Pastel, Monochrome) or Custom colors.
Timeframes: enable up to 10 TF slots (e.g., M1/M5/M15/H1/H4/D1…).
Add-on — Imbalance: enable/disable, midline on/off, filled/outline, colors.
Alerts
New Bullish FVG
New Bearish FVG
Add-on: New Bullish Imbalance
Add-on: New Bearish Imbalance
Notes & limitations
FVG detection is confirmed on bar close; intrabar retest recolor can occur as price interacts.
Historical rendering depends on chart history & session settings.
Many TFs + large box counts can be heavy; use projection limits and display caps for performance.
This tool does not generate trade signals; it visualizes inefficiencies for discretionary or rules-based workflows.
Disclaimer
For educational and informational purposes only. Not financial advice.
Access / Support: Invite-only. For access or assistance, please DM.

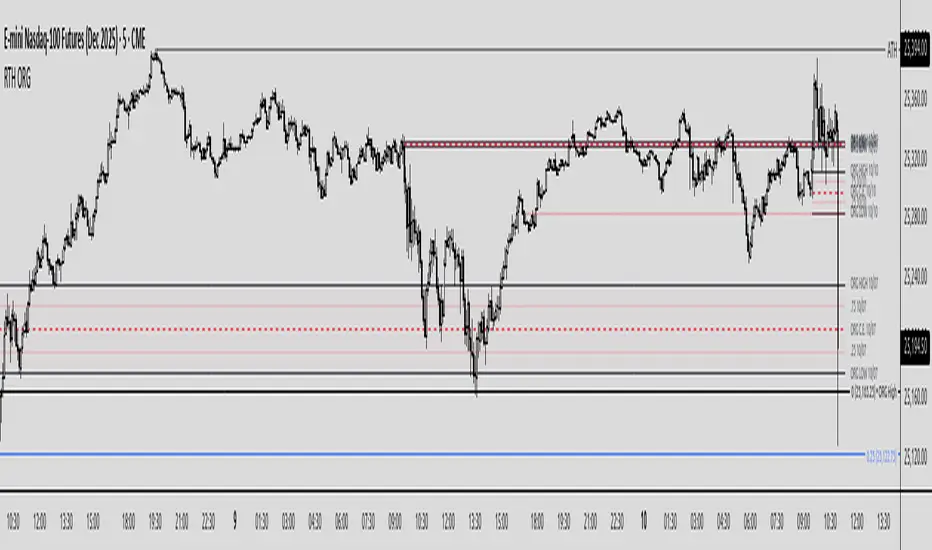
Regular Trading Hours Opening Range Gap (RTH ORG)### Regular Trading Hours (RTH) Gap Indicator with Quartile Levels
**Overview**
Discover overnight gaps in index futures like ES, YM, and NQ, or stocks like SPY, with this enhanced Pine Script v6 indicator. It visualizes the critical gap between the previous RTH close (4:15 PM ET for futures, 4:00 PM for SPY) and the next RTH open (9:30 AM ET), helping traders spot potential price sensitivity formed during after-hours trading.
**Key Features**
- **Standard Gap Boxes**: Semi-transparent boxes highlight the gap range, with optional text labels showing day-of-week and "RTH" identifier.
- **Midpoint Line**: A customizable dashed line at the 50% level, with price labels for quick reference.
- **New: Quartile Lines (25% & 75%)**: Dotted lines (default width 1) mark the quarter and three-quarter points within the gap, ideal for finer intraday analysis. Toggle on/off, adjust style/color/width, and add labels.
- **High-Low Gap Variant**: Optional boxes and midlines for gaps between the prior close's high/low and the open's high/low—perfect for wick-based overlaps on lower timeframes (5-min or below recommended).
- **RTH Close Lines**: Extend previous close levels with dotted lines and price tags.
- **Customization Galore**: Extend elements right, limit historical displays (default: 3 gaps), no-plot sessions (e.g., avoid weekends), and time offsets for non-US indices.
**How to Use**
Apply to 15-min or lower charts for best results. Toggle "extend right" for ongoing levels. SPY auto-adjusts for its 4 PM close.
Tested on major indices—enhance your gap trading strategy today! Questions? Drop a comment.
Thanks to twingall for supplying the original code.
Thanks to The Inner Circle Trader (ICT) for the logical and systematic application.
MK_OSFT-Momentum Confluence DetectorMOMENTUM CONFLUENCE DETECTOR - Trading Indicator Overview
What This Indicator Does
The Momentum Confluence Detector is a comprehensive Pine Script indicator designed to identify high-probability trading opportunities by detecting momentum bars that align with multiple confluence factors. It combines traditional technical analysis with advanced Smart Money Concepts to filter out noise and highlight the most significant price movements.
CORE FUNCTIONALITY
📊 Momentum Bar Detection Identifies unusual volume and bar size expansion using customizable multipliers
Detects bullish, bearish, and neutral momentum bars based on OHLC relationships
Uses moving averages to establish baseline volume and bar size thresholds
🔄 Multi-Filter Confluence System
The indicator employs up to 5 different filter types to validate momentum signals:
Level Concept Filter - Choose between:
- Support/Resistance Levels : Traditional pivot-based S/R zones with touch counting and break tracking
- Smart Money Concepts : Institutional order flow analysis including Order Blocks, Fair Value Gaps (FVGs), and market structure breaks
Trend Filter : EMA/SMA-based trend direction confirmation with alignment requirements
Breakout Filter : Detects price breakouts beyond recent highs/lows with percentage thresholds
Volatility Filter : ATR expansion confirmation to ensure signals occur during active market conditions
Market Session Filter : Filters signals to specific trading sessions (Tokyo, London, New York)
ADVANCED FEATURES
🎯 Smart Money Concepts Integration
Order Blocks : Identifies institutional supply/demand zones from major and minor structure breaks
Fair Value Gaps (FVGs) : Detects price imbalances and tracks their evolution through partial fills and inversions
Market Structure : Recognizes Break of Structure (BOS) and Change of Character (CHoCH) patterns
Retracement Patterns : Tracks HLH (Higher-Low-Higher) and LHL (Lower-High-Lower) institutional patterns
📈 Support/Resistance System
Multi-timeframe pivot detection (3, 5, 7-bar spans)
Volume-weighted strength calculation for level importance
Dynamic level merging and break tracking
Automatic level type classification (Support/Resistance/Flip zones)
⚙️ Intelligent Filtering Logic
ALL Mode : Requires all enabled filters to pass (high precision)
ANY Mode : Requires at least one filter to pass (higher frequency)
Real-time filter status tracking and visualization
Visual Features
Signal Markers : Clear triangular markers for qualified momentum bars
Unfiltered Signals : Optional display of raw momentum bars for comparison
Level Visualization : Dynamic S/R level boxes and lines with strength indicators
Structure Lines : BOS/CHoCH break visualization with major/minor classification
Fair Value Gaps : Color-coded boxes showing bullish/bearish FVGs with partial fill tracking and IFVG conversion
Order Blocks : Institutional supply/demand zones displayed as colored boxes with major/minor classification
Information Table : Real-time display of signal details and filter status
Session Boxes : Visual representation of active trading sessions
Practical Applications
✅ Swing Trading : Identify high-probability reversal and continuation setups
✅ Day Trading : Spot intraday momentum shifts with institutional backing
✅ Multi-Timeframe Analysis : Combine major and minor structure analysis
✅ Risk Management : Filter out low-quality setups using confluence requirements
✅ Educational : Understand market structure and institutional order flow
Customization Options
Adjustable momentum thresholds for different market conditions
Comprehensive filter settings with individual enable/disable controls
Visual customization for colors, sizes, and display preferences
Alert system with detailed signal information
Performance optimization settings for different chart timeframes
Who Should Use This Indicator
This indicator is suitable for traders who:
Want to combine multiple technical analysis approaches
Seek to understand institutional market behavior
Prefer confluence-based trading setups
Need customizable filtering for different market conditions
Value comprehensive signal validation over high-frequency alerts
The Momentum Confluence Detector transforms complex market analysis into clear, actionable signals by requiring multiple forms of confirmation before highlighting trading opportunities.

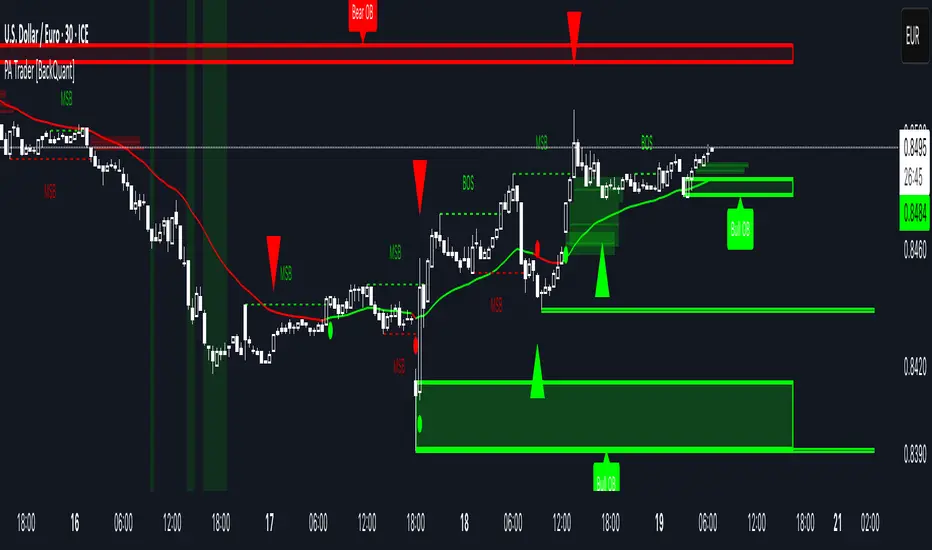
Price Action Trader [BackQuant]Price Action Trader
Introduction
Price Action Trader is an all-in-one, chart-side workflow for reading trend, timing impulses, and mapping high-probability zones the way discretionary traders actually trade. It blends an ensemble trend engine with clean price-action building blocks—Market Structure (BOS/MSB), Fair Value Gaps, Order Blocks, and Volumetric Support/Resistance—so you can form a bias, find confluence, and execute with context.
What is it
A modular “price-action stack” that:
Paints trend bias and impulse shifts on the chart (optional candle coloring).
Auto-annotates internal & swing structure (BOS / MSB).
Finds FVGs on your chosen timeframe and draws them cleanly.
Detects Order Blocks (with optional FVG confirmation).
Builds volumetric S/R levels that adapt to liquidity.
Emits alerts for key events (new levels, touches, breaks, OB creation/touch).
Everything is configurable—keep it minimal (trend + a few zones) or run the full toolkit.
What’s it used for
Bias first, trade second: establish direction/conviction, then execute where structure, gaps, blocks, and volume agree.
Timing: impulse flips and level touches provide actionable triggers.
Risk placement: OB edges, FVG midlines, and volumetric bands give logical stop/target references.
Review & journaling: optional session shading and labeled structures make post-trade notes simple.
Composite Trend Model
A lightweight signal line (default: 30-period) that turns green when the composite regime is bullish and red when bearish. Under the hood, multiple cues (adaptive momentum, de-noised oscillation, volatility-aware filters) are blended into a single directional score; when thresholds flip, the line recolors and optional Long/Short dots appear.
How to use
Treat the line as your bias rail : favor longs while green, shorts while red.
Flat/rapid flips = stand down or reduce size.
Prefer clean charts? Keep only the line and (optionally) trend-painted candles.
Inputs to know
Show Trend Signal Line / Width.
Paint Candles by Trend.
Long/Bearish color controls.
Impulse Model
Highlights short-term pressure shifts with optional impulse candle coloring and ▲/▼ markers. Great for entries in the prevailing trend and for early warnings when impulses fire against bias.
How to use
Up-bias: look for the next impulse-up near structure/FVG/OB or volumetric support.
Down-bias: mirror the logic.
Frequent counter-impulses → expect chop or regime change.
Inputs to know
Show Impulse Signals.
Paint Impulse Candles.
Market Structure
Automatic Internal (tight lookback) and Swing (wider lookback) structure with BOS and MSB (CHoCH) labels. You decide what to show—All, BOS only, MSB only—independently for internal vs swing.
How to use
Use Swing labels for the primary map; Internal for entry refinement.
After a bullish MSB , seek the first HL back into support/FVG/OB.
After a bearish BOS , favor LH fades into resistance/FVG/OB.
Inputs to know
Swing Lookback / Internal Lookback.
Swing/Internal Structure: All | BOS | MSB | None .
Separate bull/bear color controls for both layers.
Fair Value Gaps
Detects bullish/bearish FVGs on the current or higher TF, draws boxes, and can extend them forward. Midlines provide quick visual targeting.
How to use
In-trend fills: in an up-bias, tags of bullish FVGs often offer high-quality continuation entries, especially with structure/OB confluence.
Failed fills: rejections at the midline can signal emerging strength/weakness.
Inputs to know
Show FVG / Show Last N / Extend.
Timeframe (blank = chart TF; set higher TF for macro FVGs).
Bull/Bear colors (tune opacity to taste).
Volumetric Support and Resistance
Builds adaptive S/R from price interaction + relative volume over a rolling lookback. Levels store touch counts; you can show volume stats on labels or inside boxes. Transparency and border thickness can scale with volume so stronger levels are visually louder. Broken levels can auto-remove.
How to use
Use as confluence with structure, OBs, and FVGs. A long at volumetric support + Bull OB + FVG midline is qualitatively different from a naked level.
If a level breaks on strong volume, stop fading—flip expectations or wait for a clean retest.
Inputs to know
Detection Sensitivity / Volume Multiplier.
Analysis Period / Max Levels / Min Distance (%).
Remove Broken / Extend Right / Show Volume Info / Text Inside.
Support/Resistance colors (+ high-vol variants).
Alerts
New Support/Resistance Level Created.
Level Touch.
Level Break.
Order Blocks
Detects bullish/bearish OBs using configurable fractals (3- or 5-bar) with a break confirmation (by Close or High/Low). Optional FVG proximity filter, right-extension, and auto-delete when filled.
How to use
Bullish bias: stalk pullbacks into fresh Bull OBs aligned with a bullish FVG or volumetric support.
If price fills an opposing OB and fails to continue, reassess bias—context may be shifting.
Inputs to know
Fractal Type & Break Method (Close / HL).
Filter with FVG + Max FVG Distance.
Extend Blocks / Delete When Filled / Show Labels.
Alerts
New Order Block Created.
Order Block Touch.
Final Notes
Suggested workflow
Start with Composite Trend (bias).
Mark Swing structure in that direction.
Wait for an Impulse in-direction near an OB / FVG / Volumetric level.
Risk = nearest opposite level or OB edge; targets = FVG midlines / next S/R.
Timeframes & assets
Defaults suit liquid intraday and 1–4H swing.
Slower markets → lengthen lookbacks, lower sensitivity.
Very noisy crypto → keep trend visible, trim drawings (e.g., MSB only, last 3–5 FVGs, 8–12 volume levels).
Keep it readable
Turn off modules you don’t need today—fewer, higher-quality signals beat clutter.
About this release
Internal scoring, smoothing, and detection logic are proprietary. Behavior is controlled via inputs described above.
Trade with a plan, test your settings, and let confluence do the heavy lifting.
Precision Fair Value Gap (FVG)This indicator scans historical price action to automatically detect unmitigated Fair Value Gaps (FVGs) with precision.
It highlights bullish and bearish gaps that remain open until price fills them, helping traders spot key liquidity imbalances used in Smart Money Concepts (SMC).
🔹 Features
Detects both bullish and bearish FVGs.
Auto-removes mitigated gaps once price returns to fill them.
Configurable gap size, line weight, and colors.
Optimized for performance with capped lookback and line control.
Works on all timeframes and markets.
Perfect for traders who rely on price action and institutional order flow to refine entries, exits, and confluence zones.

ICT Fair Value Gap (FVG) DetectorFair Value Gap (FVG) Indicator
Purpose: Highlights price gaps between three consecutive candles, which signal areas of imbalance that may later act as support or resistance.
How It Works: The script looks for a gap between the high of two bars ago and the low of the current bar (bullish FVG) or the low of two bars ago and the high of the current bar (bearish FVG).
Visuals: These gaps are marked as transparent boxes on the chart, extended to the right until they are "filled" or mitigated by price returning into the gap.
Customization: You can adjust which gaps show, their colors, thresholds, and other display options.

Candle Opening Price & FVG/iFVGIndicator Description: Candle Opening Price & Fair Value Gaps w/(iFVGs)
This powerful, multi-purpose indicator combines two essential trading concepts into one comprehensive tool, designed to provide traders with key price levels and areas of market imbalance.
What It Does
1. Customizable Candle Open Lines: This feature allows you to mark the opening price of specific candles from key trading sessions throughout the day.
Up to 7 Custom Time Inputs: You can define up to seven different times (e.g., "08:30" for London Open, "09:30" for New York Open).
Automatic Horizontal Lines: The script automatically draws a persistent horizontal line at the opening price of the candle corresponding to your set time.
Full Customization: Each line can be independently enabled or disabled and styled with a unique color, width, and line style (solid, dashed, dotted), allowing for a clean and personalized chart setup.
Use Cases: Ideal for marking session opens, news event candles, or any other time-based level that you consider significant for support, resistance, or directional bias.
2. Dynamic Fair Value Gaps (FVG) & Inversions (iFVG): This part of the indicator automatically identifies, draws, and manages Fair Value Gaps, a core concept in modern price action trading.
Automatic FVG Detection: The script identifies both Bullish FVGs (areas of buying inefficiency) and Bearish FVGs (areas of selling inefficiency) based on the classic three-bar pattern.
Clear Visualization: Discovered FVGs are drawn as colored boxes on the chart, extending into the future until they are mitigated. Colors for Bullish and Bearish FVGs are fully customizable.
Inversion Logic: When price wicks into an FVG, the box changes color to signify an "inversion." A Bullish FVG that gets tapped becomes potential resistance (Bearish Inversion), and a Bearish FVG becomes potential support (Bullish Inversion). This dynamic shift helps you track how the market is interacting with these zones.
Zone Mitigation: Once an inverted FVG is fully reclaimed by a candle close, the zone is considered "mitigated" and the box is automatically removed from the chart, keeping your view focused on relevant, active zones.
Disclaimer
This indicator is for educational and informational purposes only and should not be construed as financial advice. Trading in financial markets involves substantial risk, and there is always the potential for loss. Past performance is not indicative of future results.
The signals, levels, and zones generated by this tool are based on historical price data and mathematical formulas; they do not predict the future with certainty. You should always conduct your own research, practice sound risk management, and consult with a qualified financial advisor before making any trading decisions. The author and TradingView are not responsible for any financial losses you may incur by using this script. Use at your own risk.
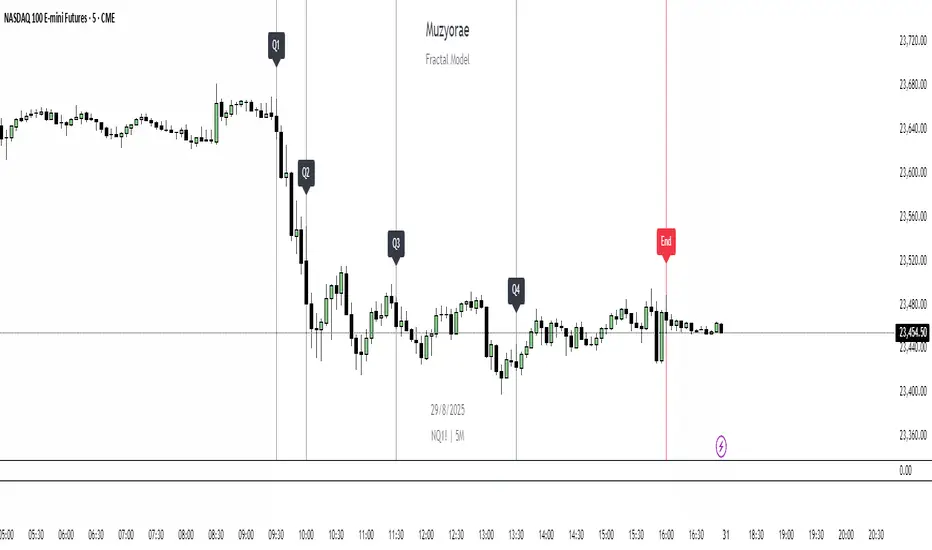
Muzyorae - Quarterly TheoryQuarterly Theory — NY Session Macro Model
The Quarterly Theory Model is a structured framework for analyzing intraday market behavior based on institutional activity and macro-level cycles.
It divides the New York trading session into four sequential “quarters” (Q1–Q4), each representing distinct phases of market participation, liquidity accumulation, and directional bias.
This model is designed for professional traders who aim to align their strategies with institutional flows, key liquidity zones, and market structure shifts.
It accommodates both AMDX (Accumulation → Manipulation → Distribution → Expansion) and XAMD (reversal sequences) fractal patterns, allowing traders to adapt to varying market conditions.
Price action may expand early during Q1 in an XAMD sequence, representing an initial breakout or early liquidity sweep before the typical Q2 manipulation phase. Traders should be aware that Q1 can occasionally produce unexpected volatility or directional bias in such sequences.
Session Breakdown (New York Time)
Q1 – Accumulation
Time: 9:30 – 10:00 AM
Phase Characteristics: Early session positioning, initial liquidity sweeps, and false moves. Institutions build positions while retail participants often react to gaps and premarket activity.
Note: Price may expand early in an XAMD sequence, creating a short-term directional move before Q2.
Q2 – Manipulation / Expansion
Time: 10:00 – 11:30 AM
Phase Characteristics: The main directional move develops, often characterized by breaks of structure, fair value gaps, and liquidity sweeps. This is a prime area for trend initiation.
Q3 – Distribution / Retracement
Time: 11:30 AM – 1:30 PM
Phase Characteristics: Price consolidates and retraces into prior accumulation zones, reflecting profit-taking or redistribution by institutions. Market chop and sideways movement are common.
Q4 – Final Expansion / Repricing
Time: 1:30 – 4:00 PM
Phase Characteristics: The afternoon session often produces final liquidity sweeps, trend continuation, or reversals, setting the high or low of the day and completing the daily macro cycle.
Key Features of the Model
Fractal-Based Structure: Q1–Q4 cycles reflect institutional behavior at a macro level, scalable to other intraday or multi-day fractals.
Supports AMDX & XAMD: Allows for both standard accumulation → manipulation → distribution → expansion sequences and reversal patterns depending on market behavior.
Early Expansion in Q1: Recognizes that in XAMD sequences, Q1 may produce early directional moves or breakout activity.
True Open Q2 Line: Highlights the opening price of Q2 as a reference for trend validation and potential entry zones.
Dynamic Time Alignment: Fully synchronized with New York (ET) time zone, ensuring accurate representation of market cycles.
Professional Visualization: Optional labels and vertical markers for each quarter, supporting quick visual analysis and pattern recognition.
Integration with ICT Concepts: Compatible with Smart Money Techniques (SMT), Fair Value Gaps (FVGs), Order Blocks (OBs), and Break of Structure (BOS) for enhanced trade planning.
Purpose and Application
Anticipates areas of liquidity accumulation and manipulation.
Identifies optimal entry and exit zones within institutional cycles.
Structures trades around probable trend initiation and continuation periods.
Aligns retail activity with institutional flow for higher probability setups.
Adapts to market variability through AMDX and XAMD fractal patterns.
Accounts for early expansions or breakout activity during Q1 in XAMD sequences.
By using the Quarterly Theory Model, traders gain a systematic, time-based framework to interpret market structure and maximize alignment with institutional participants.
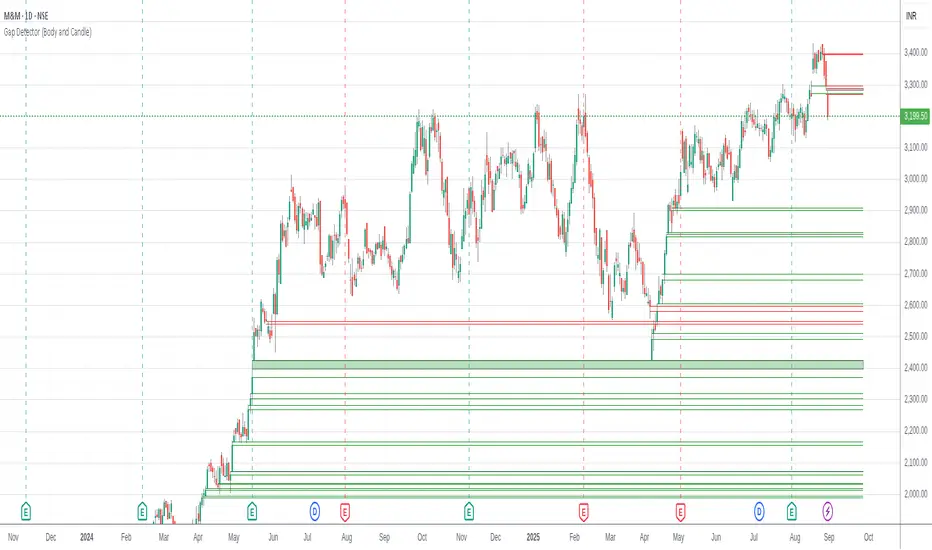
Gap Detector (Body and Candle)Finds/Detects gaps between candles and candle bodies for any chart/timeframe with O(n+delta) performance.
Candle Gaps (between wicks) act as strong support or resistance. They are drawn as solid boxes.
Body Gaps (ignores wicks) act as mild support or resistance. They are depicted with lines.
Adjust the settings for candle/body gap width, smaller the time frame, smaller the gap.
Adjust max historical bars to fine tune performance on your system/setup. The more historical bars the script scans, more time required to load the chart. At times based on system configuration, TradingView may timeout the script due to too many bars. Reducing the max bars helps in this scenario.
This is a revamped version of "Body Gap Detector".
Happy charting !
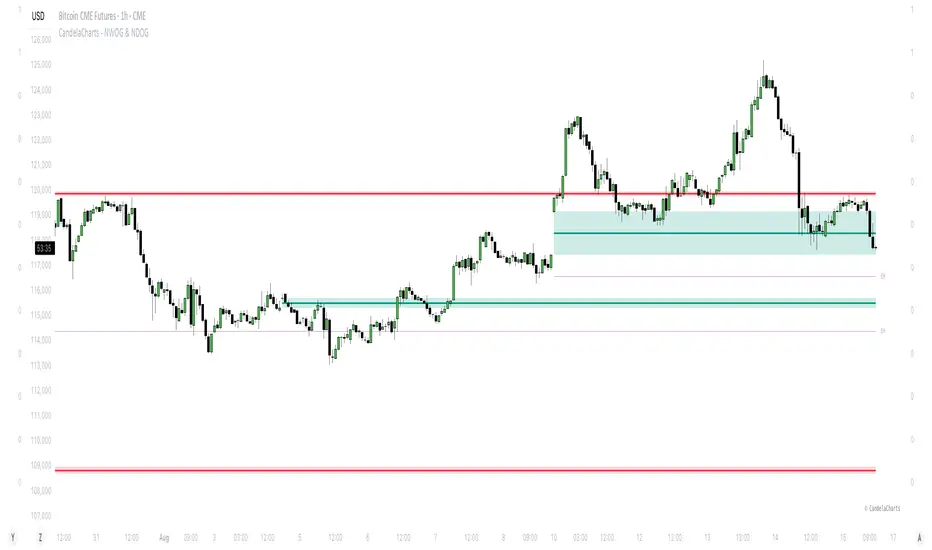
CandelaCharts - NWOG & NDOG📝 Overview
In trading, opening gaps aren’t just noise—they’re clues. Two key ones are the New Week Opening Gap (NWOG) and the New Day Opening Gap (NDOG).
The NWOG forms between Friday’s close (5 PM EST) and Sunday’s open (6 PM EST). It often acts as a magnet—price tends to revisit it, sometimes days or even weeks later. The NDOG is the daily version, showing imbalances at the start of each session.
Between two NWOGs, the Event Horizon (EH)—the midpoint—often becomes a pull for price. When the price hits it, there's a good chance it keeps moving toward the next gap.
I also watch the Optimal Trade Entry (OTE) zones, usually around the 0.68–0.79 retracements between NWOGs. These levels often line up with institutional interest and make solid spots for entries.
To simplify all this, I use an indicator that automatically detects NWOGs and NDOGs, then plots the EH and OTE levels in real time. No manual drawing. Just clean, updated levels every week.
These gaps and their derived levels help map where price is likely to go—and when to act.
📦 Features
MTF
Mitigation
Consequent Encroachment
Threshold
Hide Overlap
Advanced Styling
⚙️ Settings
Show: Controls whether NWOG/NDOG gaps are displayed on the chart.
Show Last: Sets the number of NWOG/NDOG you want to display.
Length: Determines the length of each NWOG/NDOG.
Mitigation: Highlights when an NWOG/NDOG has been touched, using a different color without marking it as invalid.
Timeframe: Specifies the timeframe used to detect NWOG/NDOGs.
Threshold: Sets the minimum gap size required for NWOG/NDOG detection on the chart.
Event Horizon: Controls whether EHs are displayed on the chart.
Show Mid-Line: Configures the midpoint line's width and style within the NWOG/NDOG. (Consequent Encroachment - CE)
Show Border: Defines the border width and line style of the NWOG/NDOG.
Hide Overlap: Removes overlapping NWOG/NDOG from view.
Extend: Extends the NWOG/NDOG length to the current candle.
Elongate: Fully extends the NWOG/NDOG length to the right side of the chart.
⚡️ Showcase
Simple
Mitigated
Bordered
Consequent Encroachment
Extended
Event Horizon
🚨 Alerts
This script provides alert options for all signals.
Bearish Signal
A bearish signal is triggered if the price enters a bearish NWOG/NDOG zone.
Bullish Signal
A bullish signal is triggered if the price enters a bullish NWOG/NDOG zone.
⚠️ Disclaimer
Trading involves significant risk, and many participants may incur losses. The content on this site is not intended as financial advice and should not be interpreted as such. Decisions to buy, sell, hold, or trade securities, commodities, or other financial instruments carry inherent risks and are best made with guidance from qualified financial professionals. Past performance is not indicative of future results.
[Top] LHAMA SupertrendLHAMA Supertrend - Advanced Adaptive Trend Following System
Overview
The LHAMA Supertrend is an innovative trend-following indicator that combines adaptive moving average technology with intelligent signal confirmation. Unlike traditional supertrend indicators that rely on simple moving averages, this system uses my Low-High Adaptive Moving Average (🦙 LHAMA) algorithm that dynamically adjusts to market volatility and price action patterns. It is much more responsive to sudden price changes than traditional supertrend indicators, allowing you to jump in earlier and catch more of the move, and it manages this responsiveness without significantly increasing the number of false signals.
What Makes This Original
This indicator introduces several unique concepts not found in standard trend-following tools:
LHAMA Algorithm : The core innovation is the Low-High Adaptive Moving Average, which adapts its responsiveness based on the frequency of new highs and lows within a lookback period. This creates a more intelligent baseline that responds appropriately to different market conditions.
Delayed Confirmation System : Rather than generating immediate signals on price crossovers, the indicator implements a sophisticated confirmation mechanism using slope analysis. Signals are only triggered when both trend direction and momentum align, significantly reducing false signals.
Volume Integration : Optional volume weighting enhances the adaptive calculation, giving more weight to price movements during high-volume periods.
Daily Reset Functionality : Unique daily reset feature helps realign the indicator after overnight gaps, particularly useful for equity markets.
How It Works
LHAMA Calculation
The LHAMA baseline adapts using a coefficient derived from:
Frequency of new highs and lows in the lookback period
Optional volume weighting factor
Smoothed adaptation rate based on market activity
The calculation:
lhama = previous_lhama + momentum_adaptation * (price - previous_lhama)
Where the momentum adaptation increases when markets are making new highs or lows, allowing faster response during trending conditions while providing stability during consolidation.
Signal Generation
The indicator uses a two-stage signal process:
Trend Identification : Price position relative to LHAMA determines basic trend bias
Slope Confirmation : ATR-normalized slope analysis confirms momentum direction
Signal Timing : Buy/sell signals only trigger when trend direction and slope momentum align
Visual Components
LHAMA Line : The adaptive baseline with optional angle-based gradient coloring that visualizes momentum strength
Trend Clouds : Dynamic fill areas that adapt to the last confirmed signal direction
ATR Halo : Opposite-side ATR band providing optional additional context for stop-loss placement
Confirmation Signals : Clear BUY/SELL labels only appear after full confirmation
How to Use
Basic Setup
Apply to any timeframe and symbol
Default LHAMA length of 15 periods works well for most applications
Accuracy depends greatly on chart timeframe and symbol, so make sure to backtest before relying on any signals. For example, ES and NQ work best on the 15m timeframe while GC and CL work best on the 5m.
Enable daily reset for equity markets to handle overnight gaps
Signal Interpretation
Immediate Heads-up : Small triangles show instant trend changes for awareness. These are your warnings to get ready to buy or sell if price takes off. (If many triangles are being printed in both directions, that is a warning that the market is ranging and you should not blindly follow a BUY/SELL signal without additional confirmation.)
Confirmed Signals : BUY/SELL labels appear only after slope confirms the direction
Cloud Color : Locked to the last confirmed signal direction for clear regime identification
Advanced Features
Flat Threshold : Adjust the angle threshold to filter out sideways market noise
Gradient Mode : Toggle between classic supertrend coloring and momentum-based gradients
ATR Halo : Use the opposite-side cloud as a more generous trailing stop level
Risk Management
The indicator provides multiple levels for stop-loss placement:
Tight : Edge of the main trend cloud
Standard : The LHAMA Line itself
Generous : ATR halo boundary
Best Practices
Timeframe Selection : Not all timeframes on all symbols are created equal. Make sure to scroll to the left and verify that your current chart timeframe isn't throwing out tons of bad signals. This will be easy to spot as it show up as constant rapid flipping from buy to sell.
Market Conditions : Performs best in trending markets. The flat threshold setting helps filter out poor performance during strong sideways action, but no indicator is perfect.
Confirmation : Wait for confirmed BUY/SELL signals rather than acting on immediate trend flips for better risk-adjusted returns.
Key Parameters
LHAMA Length (15) : Controls the lookback period for adaptive calculation
Daily Reset : Helps maintain accuracy across overnight gaps
Flat Threshold (5°) : Filters out low-momentum signals
Volume Weighting : Enhances adaptation during high-volume periods
Alerts
The indicator provides two alert types:
"BUY (confirmed)": Triggers when bullish trend and upward slope align
"SELL (confirmed)": Triggers when bearish trend and downward slope align
These alerts fire only on confirmed signals, not on immediate price crossovers, providing higher-quality notifications.
Innovation Summary
This indicator advances trend-following methodology by introducing adaptive baseline calculation, intelligent signal confirmation, and comprehensive visual feedback systems. The combination of LHAMA adaptation, slope-based confirmation, and multi-layered risk management tools creates a more sophisticated approach to trend analysis than traditional supertrend indicators.
The result is a tool that maintains responsiveness during trending conditions while providing stability during consolidation, with clear visual cues for entry, exit, and risk management decisions.

Fair Value Gap with Swing PointsFair Value Gaps occur when there's a significant price difference between the close of one period and the opening of the next, signaling market inefficiencies. Bullish gaps indicate potential upward momentum, while bearish gaps suggest potential downward pressure.

The Barking Rat ReversionsMean Reversion with Multi-Layered Precision
The Barking Rat Reversions is a short-term mean reversion strategy tailored for high-volatility markets. It combines several well-established technical tools in a configuration to identify overextended price movements likely to revert toward equilibrium. The goal is to isolate high-quality, short-term reversal opportunities while filtering out low-conviction setups.
At its core, our strategy triggers off Fair Value Gaps (FVGs) that occur a considerable distance away from a dynamically defined equilibrium band. It then validates these gaps by checking proximity to recent support and resistance drawn from swing extremes.
Additional confirmation comes from momentum filters and wick-rejection patterns, ensuring each entry aligns with both price structure and stretched momentum. Exits use volatility-adjusted profit targets. Keeping the approach disciplined and adaptive.
🧠Core Logic: Selectivity & Structure
This strategy is intentionally very selective. We have designed it to filter out roughly 95% of all market noise, highlighting only setups that pass multiple validation layers outlined below.
Fair Value Gaps (FVGs) as the Primary Trigger
FVGs identify imbalance zones where price historically retraces. These inefficient zones often become magnets for reversion as the market seeks to rebalance.
Dynamic Equilibrium Band + S/R
Defines a fair value zone with a long-term moving average and combines it with shorter-term swing pivots to establish support/resistance. Only FVGs that occur outside the band and near recent pivots are considered, ensuring reversals are sufficiently distanced and not taken too close to the mean.
Proximity to Support/Resistance
Setup validity depends on location. The strategy filters for FVGs near well-defined structural levels — areas where price has previously turned (i.e., recent swing highs or lows). This increases the likelihood that reversals are occurring at legitimate zones of confluence.
Wick-Rejection Confirmation
Confirms potential exhaustion through characteristic candle wick patterns beyond the equilibrium region. This acts as another filter to improve signal accuracy.
Sequential Filtered Signals
Custom logic ensures that a new signal in any direction must improve upon the previous one, preventing repetitive or suboptimal entries.
Multi-Step Confirmation
All validation layers must coincide on the same bar before a signal triggers, dramatically reducing false positives.
📈Chart Visuals: Designed for Clarity
To ensure transparency and easy interpretation, the script overlays intuitive visuals:
Green “▲” below a candle: Indicates a potential long entry
Red “▼” above a candle: Indicates a potential short entry
Green “✔️”: Marks exit from a trade when ATR target is met
Background shading (green/red): Indicates trade direction while active
Support/Resistance lines: Auto-plotted from recent swing levels
🔔Alerts: Stay Notified Without Watching
The strategy supports real-time alerts on candle close, ensuring that signals are only triggered once fully confirmed.
You must manually set up alerts within your TradingView account. Once configured, you’ll be able to set up one alert per instrument. This one alert covers all relevant signals and exits — ideal for hands-free monitoring.
⚙️Strategy report properties
Position size: 25% equity per trade
Initial capital: 10,000.00 USDT
Pyramiding: 10 entries per direction
Slippage: 2 ticks
Commission: 0.055% per side
Backtest timeframe: 1-minute
Backtest instrument: HYPEUSDT
Backtesting range: Jul 21, 2025 — Aug 7, 2025
Note on Sample Size:
You’ll notice the report displays fewer than the ideal 100 trades in the strategy report above. This is intentional. The goal of the script is to isolate high-quality, short-term reversal opportunities while filtering out low-conviction setups. This means that the Barking Rat Reversions strategy is ultra-selective, filtering out over 95% of market noise by enforcing multiple validation layers. The brief timeframe shown in the strategy report here illustrates its filtering logic over a short window — not its full capabilities. As a result, even on lower timeframes like the 1-minute chart, signals are deliberately sparse — each one must pass all criteria before triggering.
We conducted a broader backtest covering the period from December 5, 2024 to July 31, 2025, during which the strategy identified 968 high-probability setups on the same instrument and timeframe as the strategy report.
For a larger dataset:
Once the strategy is applied to your chart, users are encouraged to expand the lookback range or apply the strategy to other volatile pairs to view a full sample.
💡Why 25% Equity Per Trade?
While it's always best to size positions based on personal risk tolerance, we defaulted to 25% equity per trade in the backtesting data — and here’s why:
Backtests using this sizing show manageable drawdowns even under volatile periods
The strategy generates a sizeable number of trades, reducing reliance on a single outcome
Combined with conservative filters, the 25% setting offers a balance between aggression and control
Users are strongly encouraged to customize this to suit their risk profile.
🔍What Makes This Strategy Unique?
Multi-factor confirmation using FVGs, EMA deviation, RSI, wick rejection, and S/R
Clean, Intuitive Chart Experience
Real-time alerts triggered only on confirmation
Variables monitor prior reversal points, guaranteeing each new signal offers an improved entry
Tracks active positions and resets filters upon exit.

TraderJoe's Vol ScreenerA professional-grade volatility indicator that displays real-time volatility calculations as a clean overlay on your chart. Features multiple volatility calculation methods, multi-symbol screening capabilities, and extensive customization options. Perfect for volatility-based trading strategies, risk management, and market analysis.
Key Features:
4 Volatility Calculation Methods: Choose from Close-to-Close, Parkinson, Garman-Klass, or ATR-based volatility
Multi-Symbol Screener: Monitor volatility across up to 5 symbols simultaneously
Fixed Chart Overlay: Clean, non-intrusive display that doesn't interfere with price action
Lookback Period Highlighting: Visualize exactly which price data is being analyzed
Debug Mode: Deep dive into volatility components with detailed statistics
Fully Customizable: Colors, positions, text size, and display options
Volatility Methods Explained
Close-to-Close (Traditional)
Uses only closing prices
Standard deviation of logarithmic returns
Most common but ignores intraday movement
Parkinson (Default)
Uses high-low range
More efficient than close-to-close
Better captures intraday volatility
Ideal for trending markets
Garman-Klass
Uses OHLC data
Most efficient estimator
Captures overnight gaps and intraday movement
Best for 24/7 markets like crypto
ATR-Based
Uses Average True Range
Intuitive for traders familiar with ATR
Includes gaps between periods
Shown as percentage of price
Instructions
Basic Setup:
Add the indicator to your chart
The volatility will display in the top-right corner by default
Default settings use Parkinson volatility with 20-period lookback
Configuration Options:
Volatility Settings:
Lookback Period: Number of bars to calculate volatility (2-500)
Volatility Method: Choose your preferred calculation method
Annualize Volatility: Toggle to show annualized volatility
Decimal Places: Precision of volatility display (0-4)
Display Settings:
Text Size: From tiny to huge
Text/Background Colors: Customize appearance
Table Position: 9 positions available (corners, edges, center)
Highlight Lookback: Shows shaded area for calculation period
Screener Settings:
Show Volatility Screener: Enable multi-symbol monitoring
Screener Symbols: Enter up to 5 comma-separated symbols
Screener Position: Independent positioning from main display
Debug Mode:
Shows calculation method
Average, max, and min returns
Total price range over lookback period
Use Cases:
For Day Traders:
Use 10-20 period lookback on 5-15 minute charts
Parkinson or Garman-Klass methods recommended
Monitor volatility spikes for breakout opportunities
For Swing Traders:
Use 20-50 period lookback on hourly/daily charts
Compare volatility across correlated assets
Identify low volatility consolidations
For Options Traders:
Enable annualized volatility
Compare implied vs. historical volatility
Use screener to find high/low volatility assets
For Risk Management:
Scale position sizes based on volatility
Set stops using volatility multiples
Monitor portfolio volatility exposure
Tips & Best Practices:
Timeframe Matters: The indicator automatically adjusts calculations for your chart timeframe
Annualized vs. Raw:
Annualized: Compare across different timeframes
Raw: Actual volatility for the specific period
Method Selection:
Crypto/Forex (24/7): Use Garman-Klass
Stocks (with gaps): Use Parkinson or ATR-based
Quick analysis: Use default Parkinson
Screener Usage:
Enter symbols without exchange suffix for some brokers
All symbols use the same timeframe as your main chart
Great for finding relative volatility leaders/laggards
Common Questions:
Q: Why does volatility seem low during strong trends?
A: Volatility measures price variability, not direction. Steady trends can have low volatility.
Q: What's a "normal" volatility reading?
A: Varies by asset class:
Major forex pairs: 5-15% annualized
Large-cap stocks: 15-30% annualized
Cryptocurrencies: 50-100%+ annualized
Meme coins: 100-200%+ annualized
Q: How do I add more symbols to the screener?
A: Currently supports 5 symbols. Add them as comma-separated values (e.g., "BTCUSDT,ETHUSDT,SOLUSDT").
Example Setups:
Crypto Volatility Dashboard:
Method: Garman-Klass
Lookback: 24 (for hourly = 1 day)
Screener: Top cryptos
Position both tables on left side
Stock Market Scanner:
Method: ATR-Based
Lookback: 20
Annualized: On
Highlight lookback period
Forex Precision:
Method: Parkinson
Lookback: 50
Decimal places: 3
Debug mode for deep analysis

Futures Trade Entry Indicator (MTF)Work in Progress with the help of Claude. Not ready for active trading. Public for help improving. This will be a multi-timeframe futures trading indicator with supply/demand zones, Fair Value Gaps (FVGs), and sophisticated entry/exit logic.I've created a comprehensive Pine Script v6 indicator that matches all your specifications! Here's what the script includes:
## **Key Features Implemented:**
### **🔄 Multi-Timeframe Logic**
- **1H Chart Data**: Detects Supply Zones, Demand Zones, and Fair Value Gaps
- **Current Timeframe**: Monitors for re-entry and confirmation signals
### **📊 Zone Detection**
- **Supply Zones**: Identified using pivot highs with configurable strength
- **Demand Zones**: Identified using pivot lows with touch validation
- **Fair Value Gaps**: Both bullish and bearish FVGs detected automatically
- **Auto-Expiry**: Zones expire after 24 hours (configurable)
### **⚡ Entry Logic**
- **Dual Confirmation Required**:
- ✅ Engulfing candle pattern (bullish/bearish)
- ✅ Market structure shift (HH→LL or LL→HH)
- **Zone Re-entry**: Price must be within identified zones/FVGs
### **🎯 Probability System**
- **Smart Scoring**: Based on zone age, strength, and risk/reward ratio
- **Color-Coded**: Green (High), Yellow (Medium), Red (Low)
- **Real-time Calculation**: Updates with each potential entry
### **🎨 Visual Elements**
- **Colored Zones**: Supply (red), Demand (green), FVGs (blue/orange)
- **Entry Labels**: 🟩 LONG / 🟥 SHORT markers
- **Probability Labels**: Display confidence levels
- **Confirmation Shapes**: Triangle indicators for pattern completion
### **⚙️ Manual Controls**
All the requested toggles are available in the settings panel:
- Show/Hide Supply Zones
- Show/Hide Demand Zones
- Show/Hide FVGs
- Show/Hide Labels
- Show/Hide Probability
- Zone strength and expiry settings
- Custom colors for all elements
### **🔔 Alert System**
- Entry opportunity alerts
- Includes probability assessment
- Ticker symbol identification
## **Usage Instructions:**
1. **Apply to 15m chart** for active trading signals
2. **Configure settings** based on your preferences
3. **Set up alerts** for automated notifications
4. **Monitor probability levels** for trade quality assessment
The script automatically handles the complex multi-timeframe analysis while keeping the interface clean and user-friendly. All zones update dynamically and expire appropriately to avoid clutter.
Would you like me to adjust any specific parameters or add additional features?

IFVG ExtendedThis indicator identifies and visualizes "Imbalance Fair Value Gaps" (IFVGs) on a price chart. It highlights these gaps, tracks their evolution, and signals when they are "filled" or "invalidated" by price action. The script is quite advanced, using custom types, arrays, and dynamic drawing.
1. Types and Variables
Custom Types:
lab: Stores label information (x, y, direction).
fvg: Stores Fair Value Gap data, including its boundaries, direction, state, labels, and other properties.
Arrays:
Four arrays track bullish and bearish FVGs, and their "invalidated" (filled) versions.
Signals:
Boolean variables to store if a bullish or bearish signal is triggered.
2. User Inputs and Parameters
Display Settings:
How many recent FVGs to show, signal preference (close or wick), ATR multiplier for gap size filtering, and colors for bullish/bearish/midline.
3. Chart Data
Price Data:
Open, high, low, close, and ATR (Average True Range) are stored for use in calculations.
4. Functions
label_maker:
Draws an up or down arrow label at a given point, colored for bullish or bearish.
fvg_manage:
Checks if any FVGs in the array have been "invalidated" (i.e., price has crossed their boundary). If so, moves them to the invalidated array.
inv_manage:
Manages invalidated FVGs, checking if a signal should be fired (i.e., price has reacted to the gap). Also removes old FVGs.
send_it:
Draws the FVGs and their labels on the chart, using boxes and lines for visualization.
5. Main Logic and Visualization
FVG Detection:
On each bar, checks for new bullish or bearish FVGs based on price action and ATR filter.
Adds new FVGs to the appropriate array.
FVG Management:
Updates the arrays, moves invalidated FVGs, and checks for signals.
Drawing:
On the last bar, clears all previous drawings and redraws the current FVGs and their labels.
6. Alerts
Alert Conditions:
Sets up alerts for when a bullish or bearish IFVG signal is triggered, so users can be notified.
Summary
In short:
This script automatically finds and tracks "Imbalance Fair Value Gaps" on your chart, highlights them, and alerts you when price interacts with them in a significant way. It uses advanced Pine Script features to manage and visualize these zones dynamically, helping traders spot potential reversal or continuation points based on gap theory

Mirror US10YThis TradingView script is designed to automatically detect the asset you are viewing (stock, commodity, or crypto) and, if it matches a long list of supported tickers, overlays a "mirror" subchart. This subchart plots the price action of a related pair—typically the asset divided by the US 10-Year Treasury yield (US10Y), or another relevant macro or sector index. The script also detects and visualizes "Imbalance Fair Value Gaps" (IFVGs) on the subchart, and can trigger alerts when these gaps are filled.
1. Automatic Subchart Detection
The script first checks which symbol you are viewing.
If it matches a list of supported stocks or commodities (e.g., NVDA, TSLA, GOLD), it sets a corresponding subchart pair (e.g., NVDA/US20Y, GOLD/US10Y).
If it’s a crypto asset, it checks both the exchange and the symbol, and sets a subchart like BINANCE:ADAUSDT/US10Y.
If a match is found, it enables plotting for the subchart.
2. Subchart Data Fetching
Once a subchart is selected, the script fetches its OHLCV data (open, high, low, close) and a 200-period ATR (Average True Range) using request.security.
It then plots the subchart’s candlesticks in white (bullish) or red (bearish).
3. IFVG (Imbalance Fair Value Gap) Detection
The script defines custom types and arrays to track bullish and bearish IFVGs and their "invalidation" (when the gap is filled).
It detects IFVGs by looking for price gaps between the current and previous candles, filtered by ATR to avoid noise.
When a gap is detected, it is stored in an array with its coordinates and direction.
4. IFVG Management and Visualization
The script manages the lifecycle of each IFVG: it tracks when a gap is filled (invalidated) and moves it to a separate array.
It draws colored boxes and dashed lines on the chart to visualize the last few IFVGs, using green for bullish and red for bearish.
When a gap is filled, it places a label (▲ or ▼) at the fill point.
5. Alerts
The script sets up two alert conditions: one for a bullish IFVG fill, and one for a bearish IFVG fill.
These can be used to trigger TradingView alerts for trading signals.
6. Debugging and Info Labels
The script displays labels on the chart showing the detected ticker and the subpair being plotted, for clarity.
This indicator is even more reliable when combined with the Mirror 2 indicator, which shows the same system but mostly with the BTC pair in crypto.
Both the Mirror US10Y and Mirror 2 also allow you to see the main inverse pairs in stocks.

Ultimate Market Structure [Alpha Extract]Ultimate Market Structure
A comprehensive market structure analysis tool that combines advanced swing point detection, imbalance zone identification, and intelligent break analysis to identify high-probability trading opportunities.Utilizing a sophisticated trend scoring system, this indicator classifies market conditions and provides clear signals for structure breaks, directional changes, and fair value gap detection with institutional-grade precision.
🔶 Advanced Swing Point Detection
Identifies pivot highs and lows using configurable lookback periods with optional close-based analysis for cleaner signals. The system automatically labels swing points as Higher Highs (HH), Lower Highs (LH), Higher Lows (HL), and Lower Lows (LL) while providing advanced classifications including "rising_high", "falling_high", "rising_low", "falling_low", "peak_high", and "valley_low" for nuanced market analysis.
swingHighPrice = useClosesForStructure ? ta.pivothigh(close, swingLength, swingLength) : ta.pivothigh(high, swingLength, swingLength)
swingLowPrice = useClosesForStructure ? ta.pivotlow(close, swingLength, swingLength) : ta.pivotlow(low, swingLength, swingLength)
classification = classifyStructurePoint(structureHighPrice, upperStructure, true)
significance = calculateSignificance(structureHighPrice, upperStructure, true)
🔶 Significance Scoring System
Each structure point receives a significance level on a 1-5 scale based on its distance from previous points, helping prioritize the most important levels. This intelligent scoring system ensures traders focus on the most meaningful structure breaks while filtering out minor noise.
🔶 Comprehensive Trend Analysis
Calculates momentum, strength, direction, and confidence levels using volatility-normalized price changes and multi-timeframe correlation. The system provides real-time trend state tracking with bullish (+1), bearish (-1), or neutral (0) direction assessment and 0-100 confidence scoring.
// Calculate trend momentum using rate of change and volatility
calculateTrendMomentum(lookback) =>
priceChange = (close - close ) / close * 100
avgVolatility = ta.atr(lookback) / close * 100
momentum = priceChange / (avgVolatility + 0.0001)
momentum
// Calculate trend strength using multiple timeframe correlation
calculateTrendStrength(shortPeriod, longPeriod) =>
shortMA = ta.sma(close, shortPeriod)
longMA = ta.sma(close, longPeriod)
separation = math.abs(shortMA - longMA) / longMA * 100
strength = separation * slopeAlignment
❓How It Works
🔶 Imbalance Zone Detection
Identifies Fair Value Gaps (FVGs) between consecutive candles where price gaps create unfilled areas. These zones are displayed as semi-transparent boxes with optional center line mitigation tracking, highlighting potential support and resistance levels where institutional players often react.
// Detect Fair Value Gaps
detectPriceImbalance() =>
currentHigh = high
currentLow = low
refHigh = high
refLow = low
if currentOpen > currentClose
if currentHigh - refLow < 0
upperBound = currentClose - (currentClose - refLow)
lowerBound = currentClose - (currentClose - currentHigh)
centerPoint = (upperBound + lowerBound) / 2
newZone = ImbalanceZone.new(
zoneBox = box.new(bar_index, upperBound, rightEdge, lowerBound,
bgcolor=bullishImbalanceColor, border_color=hiddenColor)
)
🔶 Structure Break Analysis
Determines Break of Structure (BOS) for trend continuation and Directional Change (DC) for trend reversals with advanced classification as "continuation", "reversal", or "neutral". The system compares pre-trend and post-trend states for each break, providing comprehensive trend change momentum analysis.
🔶 Intelligent Zone Management
Features partial mitigation tracking when price enters but doesn't fully fill zones, with automatic zone boundary adjustment during partial fills. Smart array management keeps only recent structure points for optimal performance while preventing duplicate signals from the same level.
🔶 Liquidity Zone Detection
Automatically identifies potential liquidity zones at key structure points for institutional trading analysis. The system tracks broken structure points and provides adaptive zone extension with configurable time-based limits for imbalance areas.
🔶 Visual Structure Mapping
Provides clear visual indicators including swing labels with color-coded significance levels, dashed lines connecting break points with BOS/DC labels, and break signals for continuation and reversal patterns. The adaptive zones feature smart management with automatic mitigation tracking.
🔶 Market Structure Interpretation
HH/HL patterns indicate bullish market structure with trend continuation likelihood, while LH/LL patterns signal bearish structure with downtrend continuation expected. BOS signals represent structure breaks in trend direction for continuation opportunities, while DC signals warn of potential reversals.
🔶 Performance Optimization
Automatic cleanup of old structure points (keeps last 8 points), recent break tracking (keeps last 5 break events), and efficient array management ensure smooth performance across all timeframes and market conditions.
Why Choose Ultimate Market Structure ?
This indicator provides traders with institutional-grade market structure analysis, combining multiple analytical approaches into one comprehensive tool. By identifying key structure levels, imbalance zones, and break patterns with advanced significance scoring, it helps traders understand market dynamics and position themselves for high-probability trade setups in alignment with smart money concepts. The sophisticated trend scoring system and intelligent zone management make it an essential tool for any serious trader looking to decode market structure with precision and confidence.

Mohammad - OBs, BOS, S/R, Elliott Waves & Trend LinesProfessional Trading Indicator System - Technical Analysis Suite
Overview
Advanced technical analysis system integrating ICT/SMC methodologies with classical analysis tools. Features seven analytical components for comprehensive market structure analysis.
Components
1. Order Blocks (ICT/SMC)
Identifies institutional accumulation/distribution zones acting as future support/resistance.
Detection: Automatic identification based on price rejection patterns
Management: Dynamic updates and removal of invalidated blocks
Configuration: Sensitivity levels (High/Medium/Low), ATR-based parameters
Visual: Green support, red resistance with transparency
2. Break of Structure (BOS)
Detects significant structural breaks indicating trend changes.
Method: 5-bar swing point formation
Display: White horizontal lines with labels
Range: 50-bar maximum lookback
3. Support & Resistance
Classical horizontal levels from significant price pivots.
Analysis: 300-bar historical scan
Filter: 10-point duplicate tolerance
Display: Maximum 15 levels within 5% of current price
4. Fair Value Gaps (FVG)
Price inefficiencies that often get filled on return.
Types: Bullish gaps (up) and bearish gaps (down)
Size: Minimum 0.1 ATR or 5 points
Management: Auto-removal when filled
5. Elliott Wave Analysis
Advanced pattern recognition for impulse and corrective waves.
Patterns: 5-wave impulse (1-2-3-4-5), 3-wave corrective (A-B-C)
Adaptive: Auto-adjusts to timeframe (3-10 depth range)
Display: Small dots with large numbers, starts from hidden point 0
6. 45-Degree Momentum Lines
Revolutionary projection system based on consecutive candle sequences.
Bearish Lines (Red):
Trigger: 5+ consecutive red candles
Start: HIGH of first red candle
Labels: B1-B5
Bullish Lines (Green):
Trigger: 5+ consecutive green candles
Start: LOW of first green candle
Labels: T1-T5
Specifications:
Angle: 45° using ATR * 0.15
Extension: 30 bars forward
Display: 5 most recent patterns
7. Classical Trend Lines
Multi-touch diagonal support/resistance detection.
Validation: Minimum touch requirements
Tolerance: ATR-based touch detection
Display: Blue lines with optional labels
Configuration Summary
Global Settings:
Show/hide each component individually
Customizable colors and line widths
Label size options
Performance:
50-bar periodic cleanup
Maximum object limits (500 each)
Conditional processing on bar close
Trading Applications
Scalping: Order Blocks + FVGs + 45° Lines
Day Trading: All components with BOS emphasis
Swing Trading: Elliott Waves + Trend Lines
Position Trading: Major levels + Elliott Waves
Key Strategies:
Use 45° line bounces for entries
Combine Order Blocks with 45° lines for confluence
Confirm BOS breaks with 45° line violations
Place stops beyond projection lines
Technical Requirements
Platform: TradingView Pine Script v5
Minimum: 300 historical bars
Optimal: 15m-4H timeframes
Performance: Moderate CPU usage
Color Scheme
Green: Bullish/Support (#26a69a)
Red: Bearish/Resistance (#ef5350)
White: BOS/S&R lines
Blue: Elliott Waves/Trend Lines
Customizable: 45° projection lines
Risk Disclaimer
Educational tool only. Not financial advice. Combine with risk management and personal analysis. Past performance doesn't guarantee future results. Trading involves substantial risk.

MTF Candles [Fadi x MMT]MTF Candles
Overview
The MTF Candles indicator is a powerful tool designed for traders who want to visualize higher timeframe (HTF) candles directly on their current chart. Built with flexibility and precision in mind, this Pine Script indicator displays up to six higher timeframe candles, complete with customizable styling, sweeps, midpoints, fair value gaps (FVGs), volume imbalances, and trace lines. It’s perfect for multi-timeframe analysis, helping traders identify key levels, market structure, and potential trading opportunities with ease.
Key Features
- Multi-Timeframe Candles : Display up to six higher timeframe candles (e.g., 5m, 15m, 30m, 4H, 1D, 1W) on your chart, with configurable timeframes and visibility.
- Sweeps Detection : Identify liquidity sweeps (highs/lows) with customizable line styles, widths, and colors, plus optional alerts for confirmed bullish or bearish sweeps.
- Midpoint Lines : Plot the midpoint (average of high and low) of the previous HTF candle, with customizable color, width, and style for enhanced market analysis.
- Fair Value Gaps (FVGs) : Highlight gaps between non-adjacent candles, indicating potential areas of interest for price action.
- Volume Imbalances : Detect and display volume imbalances between adjacent candles, aiding in spotting significant price levels.
- Trace Lines : Connect HTF candle open, close, high, and low prices to their respective chart bars, with customizable styles and optional price labels.
- Custom Daily Open Times : Support for custom daily candle open times (Midnight, 8:30, or 9:30) to align with specific market sessions.
- Dynamic Labels : Show timeframe names, remaining time until the next HTF candle, and interval labels (e.g., day of the week for daily candles) with adjustable positions and sizes.
- Highly Customizable : Fine-tune candle appearance, spacing, padding, and visual elements to suit your trading style.
How It Works
The indicator renders HTF candles as boxes (bodies) and lines (wicks) on the right side of the chart, with each timeframe offset for clarity. It dynamically updates candles in real-time, tracks their highs and lows, and displays sweeps and midpoints when conditions are met. FVGs and volume imbalances are calculated based on candle relationships, and trace lines link HTF candle levels to their originating bars on the chart.
Sweep Logic
- A bearish sweep occurs when the current candle’s high exceeds the previous candle’s high, but the close is below it.
- A bullish sweep occurs when the current candle’s low falls below the previous candle’s low, but the close is above it.
- Sweeps are visualized as horizontal lines and can trigger alerts when confirmed on the next candle.
Midpoint Logic
- A midpoint line is drawn at the average of the previous HTF candle’s high and low, extending until the next HTF candle forms.
- Useful for identifying potential support/resistance or mean reversion levels.
Imbalance Detection
- FVGs : Identified when a candle’s low is above the next-but-one candle’s high (or vice versa), indicating a price gap.
- Volume Imbalances : Detected between adjacent candles where the body of one candle doesn’t overlap with the next, signaling potential liquidity zones.
Settings
Timeframe Settings
- HTF 1–6 : Enable/disable up to six higher timeframes (default: 5m, 15m, 30m, 4H, 1D, 1W) and set the maximum number of candles to display per timeframe (default: 4).
- Limit to Next HTFs : Restrict the number of active timeframes (1–6).
Styling
- Body, Border, Wick Colors : Customize bull and bear candle colors (default: light gray for bulls, dark gray for bears).
- Candle Width : Adjust the width of HTF candles (1–4).
- Padding and Spacing : Set the offset from the current price action and spacing between candles and timeframes.
Label Settings
- HTF Label : Show/hide timeframe labels (e.g., "15m", "4H") at the top/bottom of candle sets.
- Remaining Time : Display the countdown to the next HTF candle.
Interval Value: Show day of the week for daily candles or time for intraday candles.
- Label Position/Alignment : Choose to display labels at the top, bottom, or both, and align them with the highest/lowest candles or follow individual candle sets.
Imbalance Settings
- Fair Value Gap : Enable/disable FVGs with customizable color (default: semi-transparent gray).
- Volume Imbalance : Enable/disable volume imbalances with customizable color (default: semi-transparent red).
Trace Settings
- Trace Lines : Enable/disable lines connecting HTF candle levels to their chart bars, with customizable colors, styles (solid, dashed, dotted), and sizes.
- Price Labels : Show price levels for open, close, high, and low trace lines.
- Anchor : Choose whether trace lines anchor to the first or last enabled timeframe.
Sweep Settings
- Show Sweeps : Enable/disable sweep detection and visualization.
- Sweep Line : Customize color, width, and style (solid, dashed, dotted).
- Sweep Alert : Enable alerts for confirmed sweeps.
Midpoint Settings
- Show Midpoint : Enable/disable midpoint lines.
- Midpoint Line : Customize color (default: orange), width, and style (solid, dashed, dotted).
Custom Daily Open
Custom Daily Candle Open : Choose between Midnight, 8:30, or 9:30 (America/New_York) for daily candle opens.
Usage
- Add the indicator to your TradingView chart.
- Configure the desired higher timeframes (HTF 1–6) and enable/disable features via the settings panel.
- Adjust styling, labels, and spacing to match your chart preferences.
Use sweeps, midpoints, FVGs, and volume imbalances to identify key levels for trading decisions.
- Enable sweep alerts to receive notifications for confirmed liquidity sweeps.
Notes
Performance: The indicator is optimized for up to 500 boxes, lines, and labels, with a maximum of 5000 bars back. Can be slow at a time
Time Zone: Custom daily opens use the America/New_York time zone for consistency with major financial markets.
Compatibility: Ensure selected HTFs are valid (higher than the chart’s timeframe and divisible by it for intraday periods).

Automated Scalping Signals with TP/SL Indicator [QuantAlgo]🟢 Overview
The Automated Scalping Signals with Take Profit & Stop Loss Indicator is a multi-timeframe trading system that combines market structure analysis with directional bias filtering to identify potential scalping opportunities. It detects Points of Interest (POI) including Fair Value Gaps (FVG) and Order Blocks (OB) while cross-referencing entries with higher timeframe exponential moving average positioning to create systematic entry conditions.
The indicator features adaptive timeframe calculations that automatically scale analysis periods based on your chart timeframe, maintaining consistent analytical relationships across different trading sessions. It provides integrated trade management with stop loss calculation methods, configurable risk-reward ratios, and real-time performance tracking through dashboard displays showing trade statistics, bias direction, and active position status.
This advanced system is designed for low timeframe trading, typically performing optimally on 1 to 15-minute charts across popular instruments such as OANDA:XAUUSD , CME_MINI:MES1! , CME_MINI:ES1! , CME_MINI:MNQ1! , CBOT_MINI:YM1! , CBOT_MINI:MYM1! , BYBIT:BTCUSDT.P , BYBIT:ETHUSDT.P , or any asset and timeframe of your preference.
🟢 How It Works
The indicator operates using a dual-timeframe mathematical framework where higher timeframe exponential moving averages establish directional bias through cross-over analysis, while simultaneously scanning for specific market structure patterns on the POI timeframe. The timeframe calculation engine uses multiplication factors to determine analysis periods, ensuring the bias timeframe provides trend context while the POI timeframe captures structural formations.
The structural analysis begins with FVG detection, which systematically scans price action to identify imbalances where gaps exist between consecutive candle ranges with no overlapping wicks. When such gaps are detected, the algorithm measures their size against minimum thresholds to filter out insignificant formations. Concurrently, OB recognition analyzes three-candle sequences, examining specific open/close relationships that indicate potential institutional accumulation zones. Once these structural patterns are identified, the algorithm cross-references them against the higher timeframe bias direction, creating a validation filter that only permits entries aligned with the prevailing EMA cross-over state. When price subsequently intersects these validated POI zones, entry signals generate with the system calculating entry levels at zone midpoints, then applying the selected stop loss methodology combined with the configured risk-reward ratio to determine take profit placement.
To mirror realistic trading conditions, the indicator incorporates configurable slippage calculations that account for execution differences between intended and actual fill prices. When trades reach their take profit or stop loss levels, the algorithm applies slippage adjustments that worsen the exit prices in a conservative manner - reducing take profit fills and increasing stop loss impact. This approach ensures backtesting results reflect more realistic performance expectations by accounting for spread costs, market volatility during execution, and liquidity constraints that occur in live trading environments.
It also has a performance dashboard that continuously tracks and displays comprehensive trading metrics:
1/ Bias TF / POI TF: Displays the calculated timeframes used for bias analysis and POI detection, showing the actual periods (e.g., "15m / 5m") that result from the multiplier settings to confirm proper adaptive timeframe selection
2/ Bias Direction: Shows current market trend assessment (Bullish, Bearish, or Sideways) derived from EMA cross-over analysis to indicate which trade directions align with prevailing momentum
3/ Data Processing: Indicates how many price bars have been analyzed by the system, helping users verify if complete historical data has been processed for comprehensive strategy validation
4/ Total Trades: Displays the cumulative number of completed trades plus any active positions, providing volume assessment for statistical significance of other metrics
5/ Wins/Losses: Shows the raw count of profitable versus unprofitable trades, offering immediate insight into strategy effectiveness frequency
6/ Win Rate: Reveals the percentage of successful trades, where values above 50% generally indicate effective entry timing and values below suggest strategy refinement needs
7/ Total R-Multiple: Displays cumulative risk-reward performance across all trades, with positive values demonstrating profitable system operation and negative values indicating net losses requiring analysis
8/ Average R Win/Loss: Shows average risk-reward ratios for winning and losing trades separately, where winning averages approaching the configured take profit ratio indicate minimal slippage impact while losing averages near -1.0 suggest effective stop loss execution
9/ TP Ratio / Slippage: Displays the configured take profit ratio and slippage settings with calculated performance impact, showing how execution costs affect actual versus theoretical returns
10/ Profit Factor: Calculates the ratio of total winning amounts to total losing amounts, where values above 1.5 suggest robust profitability, values between 1.0-1.5 indicate modest success, and values below 1.0 show net losses
11/ Maximum Drawdown: Tracks the largest peak-to-trough decline in R-multiple terms, with smaller negative values indicating better capital preservation and risk control during losing streaks
🟢 How to Use
Start by applying the indicator to your chart and observe its performance across different market conditions to understand how it identifies bias direction and POI formations. Then navigate to the settings panel to configure the Bias Timeframe Multiplier for trend context sensitivity and POI Timeframe Multiplier for structural analysis frequency according to your trading preference and objectives.
Next, fine-tune the EMA periods in Bias Settings to control trend detection sensitivity and select your preferred POI types based on your analytical preference. Proceed to configure your Risk Management approach by selecting from the available stop loss calculation methods and setting the Take Profit ratio that aligns with your risk tolerance and profit objectives. Complete the setup by customizing Display Settings to control table visibility and trade visualization elements, adjusting UI positioning and colors for optimal chart readability, then activate Alert Conditions for automated notifications on trade entries, exits, and bias direction changes to support systematic trade management.
🟢 Examples
OANDA:XAUUSD
CME_MINI:MES1!
CME_MINI:ES1!
CME_MINI:MNQ1!
CBOT_MINI:YM1!
BYBIT:BTCUSDT.P
BINANCE:SOLUSD
*Disclaimer: Past performance is not indicative of future results. None of our statements, claims, or signals from our indicators are intended to be financial advice. All trading involves substantial risk of loss, not just upside potential. Users are highly recommended to carefully consider their financial situation and risk tolerance before trading.

10x HTF Candles Dynamic with LTF FVG and Key LevelsPurpose
The 10x HTF Candles Dynamic Pine Script is a versatile, all-in-one trading tool designed for TradingView to empower traders with actionable insights across multiple timeframes. It combines advanced price action analysis, Fair Value Gap (FVG) detection, market structure evaluation, and key level visualization into a single, highly customizable interface. Built for day traders, swing traders, and scalpers, this script enhances decision-making by providing a clear, multi-dimensional view of market dynamics, liquidity zones, and trend biases. Its purpose is to streamline technical analysis, reduce chart clutter, and deliver real-time, visually intuitive data to support precise trading strategies.
What the Script Does
How the Script Works:
The script leverages Pine Script v5’s advanced features to deliver a robust and efficient trading tool. Below is a step-by-step explanation of its functionality:
1. Initialization and Configuration:
- Initializes with @version=5, enabling dynamic requests, and sets limits for bars (500), lines, labels, boxes, and polylines to manage resources.
- Defines user inputs for candle settings, timeframe selection, FVG parameters, DWM levels, market structure table, and visual preferences.
- Dynamically calculates 10 higher timeframes based on the current chart timeframe (e.g., 1m chart → 5m, 15m, 60m, etc.) or allows custom timeframes.
2. Data Acquisition:
- Fetches OHLC data for up to 10 timeframes using request.security, storing it in optimized TfData objects (arrays for open, high, low, close).
- Loops through enabled timeframes to minimize redundant code, improving processing speed.
3. Candlestick Rendering:
- Draws HTF candlesticks at user-defined offsets, with customizable bullish/bearish colors, wick colors, and widths.
- Calculates bar types (Inside, Normal, Outside) and optionally labels them above candles for pattern analysis.
4. FVG Detection and Visualization:
- Scans for FVGs by comparing candle highs and lows across three bars (e.g., low of candle 1 > high of candle 3 for bullish FVG).
- Detects IFVGs based on user-selected methods (wick, close, or midpoint) and highlights them with distinct colors.
- Draws FVG boxes with configurable borders, midpoint lines, and labels, tracking mitigation status.
- Limits FVG display to a user-defined maximum (1–200) to maintain chart clarity.
5. Horizontal Levels and DWM Lines:
- Computes Highs, Lows, Midpoints, and Quarter Points for each timeframe, drawing lines with customizable styles and extensions.
- Plots DWM open, close, high, low, and control point lines, with optional alerts for high/low breaks.
- Supports session-based opening price lines (e.g., 09:30 Market Open) with similar customization.
6. Market Structure and Bias:
Calculates trend bias by comparing the current close to the midpoint of the timeframe’s range (highest high to lowest low).
Updates a market structure table with timeframe, bias, and premium/discount status, using color-coded cells for quick interpretation.
7. Countdown Timers:
- Converts timeframe strings to seconds and calculates the time remaining until the next candle using timenow.
- Renders countdown labels with timeframe names (e.g., “1h\n(00:45)”) at user-defined positions.
8. Optimization and Cleanup:
- Uses VisualElements UDTs to manage lines, wicks, and labels, reducing memory usage.
- Deletes outdated drawings when limits are exceeded, ensuring a clean and responsive chart.
- Employs loops and arrays to streamline repetitive tasks, enhancing performance.
How to Use the Script:
This script is user-friendly yet powerful, suitable for traders of all experience levels. Follow these steps to maximize its potential:
1. Add to TradingView:
- Copy the script into TradingView’s Pine Editor.
- Click “Add to Chart” to apply it to your active chart.
2. Customize Settings:
- Candle Settings: Adjust the number of candles (1–10), starting position, group spacing, bullish/bearish colors, wick colors, and candle width.
- Timeframe Settings: Enable/disable up to 10 timeframes, choosing dynamic (auto-selected) or custom timeframes (e.g., 3m, 60m, D).
- FVG Settings: Toggle FVG detection, set detection methods (wick/close/midpoint), adjust thresholds, and customize colors, borders, and midpoint lines.
- DWM Settings: Enable daily/weekly/monthly lines (open, close, high, low, midpoint), set colors, and configure alerts for high/low breaks.
- Market Structure Table: Show/hide columns for timeframe, trend bias, and premium/discount, and adjust table position (top-left, bottom-right, etc.).
- Countdown Timers: Enable timers, adjust offsets, and customize text/background colors.
- Label Settings: Configure price label precision, transparency, and offsets for clarity.
3.Interpret Visuals:
- Candlesticks: Analyze HTF candles to gauge trend direction and momentum across timeframes.
- FVGs: Look for unmitigated FVGs (colored boxes) as potential support/resistance zones or trade setups.
- Key Levels: Use Highs, Lows, Midpoints, and Quarter Points to identify breakout or reversal areas.
4. Market Structure Table: Check trend bias and premium/discount status to align trades with market conditions.
- DWM Lines: Monitor daily/weekly/monthly levels for institutional reference points.
- Countdown Timers: Time entries/exits based on upcoming candle formations.
5. Integrate with Strategy:
- Combine script insights with your trading plan (e.g., use FVGs for entries, key levels for stops/targets).
- Set alerts for high/low breaks or liquidity zone approaches to stay proactive.
- Export table data or screenshot visuals for documentation and analysis.
6. Optimize Performance:
Limit the number of candles, FVGs, and lines to match your device’s capabilities.
Regularly review settings to focus on the most relevant timeframes and features.
Why the Script is Original
The 10x HTF Candles Dynamic script stands out in the TradingView community due to its innovative design, comprehensive functionality, and trader-centric approach. Here’s what makes it unique:
1. Seamless Multi-Timeframe Integration:
- Unlike single-timeframe indicators, this script synthesizes data from up to 10 timeframes, offering a holistic view of market structure.
- Dynamic timeframe selection adapts to the chart’s timeframe, ensuring relevance across all trading styles.
2 . Advanced FVG and IFVG Detection:
- Provides granular control over FVG detection with three IFVG methods (wick, close, midpoint), a rarity in most scripts.
- Tracks mitigation status and highlights unmitigated FVGs, enabling traders to capitalize on high-probability setups.
- Visualizes FVGs with boxes, midpoint lines, and labels, enhancing clarity and usability.
3. Sophisticated Market Structure Analysis:
-The bias calculation, introduced in recent updates (2 days ago), uses a robust algorithm to assess trend direction based on range midpoints.
- The market structure table, with premium/discount zones (added 20 hours ago), offers a unique summary of market conditions, unmatched by standard indicators.
4. Comprehensive DWM and Session Support:
- Integrates daily, weekly, and monthly levels alongside session-based opening prices, catering to institutional and retail traders alike.
- Customizable alerts for high/low breaks add actionable functionality.
5. Visual Hierarchy and Clarity:
- Scales line widths and transparency by timeframe, prioritizing higher timeframes for strategic focus.
- Countdown timers provide real-time context, a feature rarely seen in multi-timeframe scripts.
6.Performance Optimization:
- Recent updates introduced loops and UDTs to reduce code redundancy and boost processing speed.
- Automated cleanup mechanisms prevent chart clutter, ensuring smooth operation even on low-resource devices.
7. High Customizability:
- Offers extensive settings for visuals, timeframes, FVGs, DWM lines, and alerts, accommodating diverse trading preferences.
- Balances complexity with accessibility, making it approachable for beginners and powerful for advanced users.
8.Continuous Evolution:
- Regular updates (e.g., bias filter table, premium/discount feature, code optimization) demonstrate ongoing commitment to improvement.
- Closed-source protection (noted 20 hours ago) ensures intellectual integrity while allowing free use, fostering trust in the TradingView community.
Conclusion
The 10x HTF Candles Dynamic Pine Script is a groundbreaking tool that redefines multi-timeframe analysis on TradingView. By combining candlestick visualization, FVG detection, market structure insights, DWM levels, and countdown timers, it provides traders with a comprehensive, real-time view of market dynamics. Its advanced optimization, customization options, and continuous updates make it a standout choice for traders seeking precision, clarity, and efficiency. Whether you’re scalping intraday moves or swing trading weekly trends, this script equips you with the tools to master the markets with confidence.
