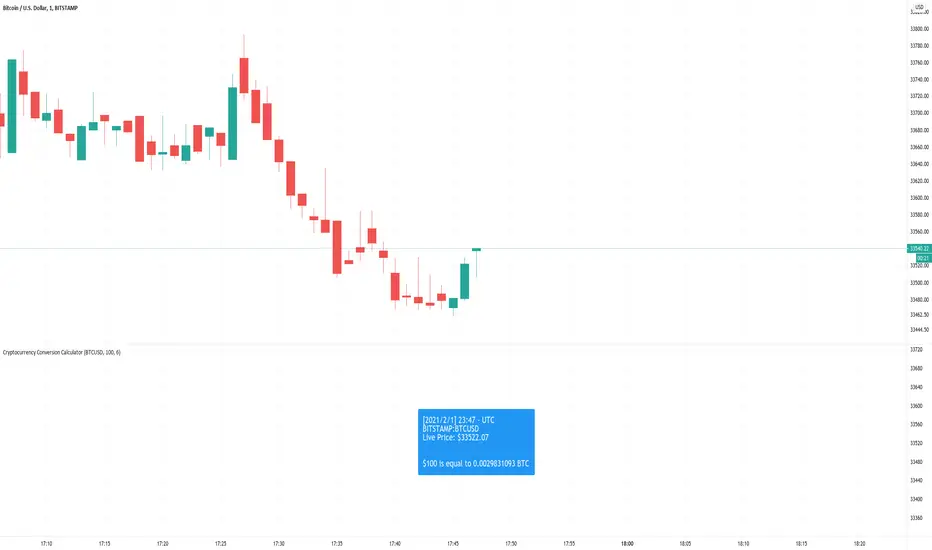
Cryptocurrency Conversion CalculatorA calculator that gives you the amount of a coin that is equal to the inputted value.
Options to configure are the ticker, amount in USD that will be converted, and how many digits you would want to be shown after the decimal point.
Currently, this only supports USD quote currencies. Ideally in the future, the code will be rewritten. Maybe.
Pesquisar nos scripts por "crypto"
Crypto USD(T) Premium Rate RTA-V1.0Crypto USD(T) Premium Rate RTA-V1.0 来自RTA学院,作者Ruomise Lin,公开指标。
Crypto USD(T) Premium Rate RTA-V1.0 中文名 数字货币市场BTCUSD(T)溢价值指标。
该指标聚合原BYBIT Premium Rate RTA-V1.0 与 USDT Premium Rate RTA-V1.0 两个指标
作用:
该指标专门分析交易所 BTCUSD 永续合约与交易所 BTCUSDT永续合约 与底层现货标的溢价情况。
当交易所 BTCUSD 永续合约>BTCUSD 现货时候,显示为绿色,反之为红色。
当交易所 BTCUSDT 永续合约>BTCUSDT 现货时候,显示为绿色,反之为红色。
功能:
可以调整是否显示BYBIT BTCUSD或BTCUSDT溢价率
可以调整是否显示BTCUSD或BTCUSDT MA
可以调节相对应的MA数值
其他:
该指标需要结合RTA课程使用,及B站《USDT为什么一跌再跌》视频使用。
BTCUSD现货指数包含
Coinbase
Bitstamp
Karken
Gemini
Bittrex
BTCUSDT现货指数包含
Binance
OKEX
Huobi
Bittrex
有任何意见或者建议欢迎联系作者,联系方式请看签名。
-----------------------------------------------------------------------
Crypto USD(T) Premium Rate RTA-V1.0 by RTA Academy, author Ruomise Lin, public indicator.
This indicator analyzes the premium of BYBIT BTCUSD PERP , BYBIT BTCUSDT PERP and the underlying BTCUSD spot.
When BYBIT BTCUSD perpetual contract > BTCUSD spot, the display is green bar, otherwise it is red bar,.
When BYBIT BTCUSDT perpetual contract > BTCUSDT spot, the display is green bar,, otherwise it is red bar,.
This indicator needs to be used in conjunction with the RTA courses.
BTCUSD spot index including,
Coinbase
Bitstamp
Karken
Gemini
Bittrex
BTCUSDT spot index including,
Binance
OKEX
Huobi
Bittrex
If you have any questions, please contact the author, please see the signature.

Crypto Base TickerAn example of using str.replace_all() function to extract a crypto ticker without its pair.
It can be useful if you didn't know syminfo.basecurrency existed.
I didn't know syminfo.basecurrency exists. Lol

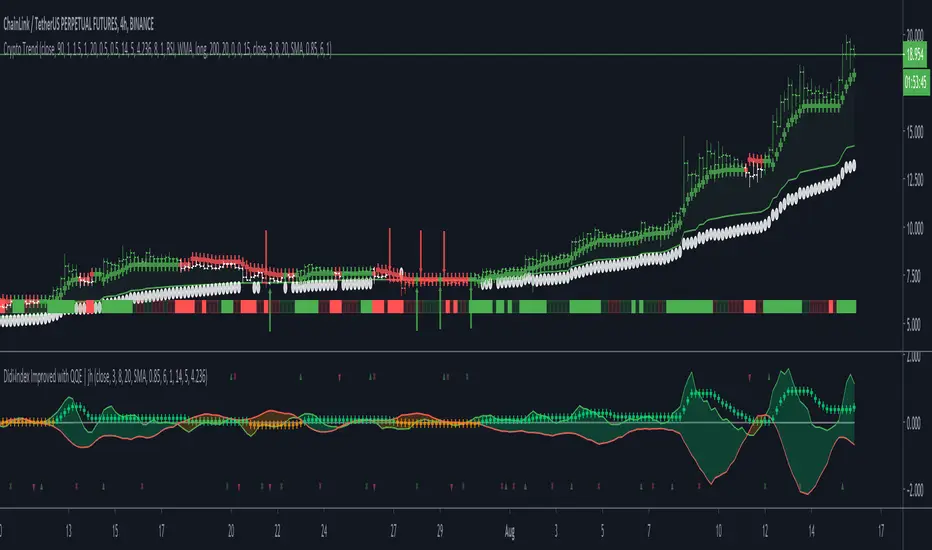
Crypto TrendThis indicator is based off of the Trend Follower system put together by jiehonglim:
This is a trend following system that combines 3 indicators which provide different functionalities, also a concept conceived by VP's No Nonsense FX / NNFX method. I’m primarily modifying this system for Crypto trading (mostly leveraged Crypto Futures). Suggestions/requests welcome.
New Features:
Added position inputs that will generate position labels
For leverage trading, position inputs will calculate your percentage-based stop loss given your entry, leverage and liquidation price
Added optional horizontal line plots for entry, stop loss, 50% take profit and 100% profit levels.
Added non-plotted Didi calculations for alert condition triggers
Added long and short alerts
These alerts will trigger for any of the 3 following conditions:
Baseline cross with volume confirmation
Didi two line cross with volume confirmation
Didi continuation with volume confirmation
1. Baseline
The main baseline filter is an indicator called Modular Filter created by Alex Grover
- www.tradingview.com
- Alex Grover - Modular Filter
-------
That's the moving average like baseline following price, filtering long and short trends and providing entry signals when the price crosses the baseline.
Entry signal indicated with arrows.
2. Volume / Volatility , I will called it Trend Strength
The next indicator is commonly known as ASH, Absolute Strength Histogram.
This indicator was shared by VP as a two line cross trend confirmation indicator, however I discovered an interesting property when I modified the calculation of the histogram.
- Alex Grover Absolute Strength
-------
My modification and other info here
- Absolute Strength Histogram v2
-------
I simplified the display of the trend strength by plotting squares at the bottom of the chart.
- Lighted Squares shows strength
- Dimmed Squares shows weakness
3. Second Confirmation / Exits / Trailing Stop
Finally the last indicator is my usage of QQE (Qualitative Quantitative Estimation), demonstrated in my QQE Trailing Line Indicator
- QQE Trailing Line for Trailing Stop
-------
Three usages of this amazing indicator, serving as :
- Second trend confirmation
- Exit signal when price crosses the trailing line
- Trailing stop when you scaled out the second trade
This indicator is plotted with crosses.
4. Position Calculator
For non-leveraged trades, set leverage to 1 and liquidation to 0
Fill out the rest of the position field to get labels that will tell you:
Your stop loss given your acceptable percentage of loss for your risk. So, for example if your actual investment is $200 and you’re trading on 20X leverage, you’d like to know what price would have to drop to for you to lose 15% of your $200 risk. This is what the position calculator is doing for you.
Your 50% take profit point
Your 100% take profit point
Check the “Show Position Lines” to plot horizontal lines for entry, stop loss, 50% TP and 100%TP
Alerts
You just get a Long Alert or Short Alert option. This was for two reasons, the first and most important was to reduce the number of alerts needed for this system to get maximum coverage. The second was just to keep things simple. Get an alert for your desired direction for any interesting signal and then check the chart manually to determine if a viable entry has presented itself. The three alert conditions are:
Main trend indicator, baseline cross with volume confirmation
Didi two line cross entry with volume confirmation
Didi continuation signal with volume confirmation
Additional plots and information
Bar Color
- Green for longs, Red for shorts, White when the baseline direction conflicts with the QQE trailing line direction
- When it's white, it's usually ranging and not trending, ASH will also keep you off ranging periods.
-------
ATR Filter
- White circles along the baseline, they will show up if the price has moved more than one ATR from the baseline
- The default allowance is 1 ATR.
-------
The previous and current ATR value
- Label on the right side of the chart showing the previous and current value of ATR
Crypto BULL signalThis BULL signal will pop up if the EMAs on the chart are looking bullish and the MACD crosses bullish. Of course it will never be a 100% hit rate, please practice good risk management.

Tradespot Trade PanelCryptocurrency based TA panel.
Features
- In depth trend analysis
- Momentum analysis
- Alt coin risk management
- Technical sentiment at a glance
- Much more coming as we iterate and update this panel over time

Crypto Daily-Weekly Range + KZsWeekly OHL + Daily OHL + Intraday Killzones
For markets that open the daily candle at 12AM UTC

Algorithm Builder CRYPTO (m5)Hello traders 👋
I. 💎 SCRIPTS ACCESS AND TRIALS 💎
1. Every 3 weeks trial request access has to be done through my website .
2. My website URL is in this script signature at the very bottom (you'll have to scroll down a bit and going past the long description) and in my profile status available here : Daveatt
3. Many video tutorials explaining clearly how all our indicators work are available on your website > guides section.
4. You may also contact me directly for more information regarding the trading method included in the indicator or how to access it
2.1 Forewords
This indicator is for the Intraday CRYPTO traders looking for fixed entries based on a trading method designed by 2 experienced traders.
It's a variation of our Algorithm Builder with a custom method for 5-minutes chart trading - can be coupled with the UNIVERSAL Algo Builder also,
We designed this framework for CRYPTO/USD and CRYPTO/CRYPTO pairing (ex: LTC/BTC, XRP/ETH, ...).
Made for crypto with enough trading volume (big and mid-caps)
ETH/BTC
XRP/ETH
EOS/USD
The tool works in m5 timeframe but won't work with any other timeframe . Even if applied on a 5-minutes chart; we included higher timeframe indicators to enter more securely.
It includes :
- our proprietary method with fixed entries
- a hard exit system (built-in stop-loss)
- 🔔 Compatible with dynamic alerts 🔔
Dynamic alerts are bringing automated trading to a whole new level. The third-party solutions capturing TradingView alerts are able to use them.
- (optional) we let the users decide to use or not our built-in Trade Manager.
Regardless of the Trade Manager is used or not, one must mandatory exit, once a vertical hard exit bar appears.
- the Algorithmic Supports and Resistances used as safeguards and take profit zones.
Final words
We made it as simple as we could (to be honest it's a very simple system for the end-user) - even with several hundreds of calculations in the indicator.
Please hit me up for any question/feedback/comment
Become the BEST trader that you deserve to be
Dave

Crypto Prices InfoPanel V2Hello traders
Following the introduction of ByBit to TradingView ByBit on TradingView
I decided to upgrade my previous Bitcoin InfoPanel Bitcoin-Prices-InfoPanel/
Now it's more dynamic (thumbs up) but only work with Bitcoin, Ethereum and Litecoin . If you select any other asset than those 3, the script won't work
This is due to a technical limitation on TradingView because I can't do more than 40 security calls per script
If you don't know what the security function is, here's a reminder : Security documentation . If you don't know what is TradingView... I cannot do anything for you...
Now you can use this panel to have a very cool arbitrage view directly from TradingView and use the info to gamble between brokers (not financial advice)
See you all tomorrow for a huge update regarding the Strategy Builder. I'll show you how to connect it to a Backtest system
____________________________________________________________
Feel free to hit the thumbs up as it shows me that I'm not doing this for nothing and will motivate to deliver more quality content in the future.
- I'm an officially approved PineEditor/LUA/MT4 approved mentor on codementor. You can request a coaching with me if you want and I'll teach you how to build kick-ass indicators and strategies
Jump on a 1 to 1 coaching with me
- You can also hire for a custom dev of your indicator/strategy/bot/chrome extension/python

BTC crypto bot indicator 3 MIN - PhilMEXBTC Crypto bot indicator
Can be used on all BTC USD / XBT USD
Must be used on 3 minutes timeframe only
Signals are pretty accurate and this code has no repaint.
Hope this help for your trading and Bitmex.
Some updates may come soon.

Strategy Builder Crypto V6Hello everyone
This indicator is the result of 7 years of trading (including 3 years of analyzing day and night how crypto assets behave).
I made it fully customizable but I wouldn't recommend changing the default values as they're the most optimal ones for now. Might change in the future but I'm very happy with the signals so far and I hope you'll be as well :)
Without further due, let's dig into it...
0 - Algo trading and Why
In the crypto trading, there is a lot of useless noise (we can probably thank Crypto Twitter for that :p) and a lot of useless data with the sole purpose is to lure you (who said Bitfinex Long/Short ratio or CME gaps ??)
I wanted to remove all the useless and only focus on Technical Analysis (TA) because I was deeply convinced that TA includes by design Fundamental Analysis (FA) and Pumponomics Analysis (PA) - PA being for instance when your favorite twitter guru will pump and dump on you
I heard that so many people got REKT from the previous bear market and I wanted to give back to the community - who helped me so much a few years back.
I worked hard to design the method and make it simple for the public and for FREE (so far as I want to collect feedbacks from the community and improving the indicator)
THIS IS MY GIFT TO YOU
1 - Input values
I'll explain later on through a medium article what each parameter means and how to set them up. For now, please used the optimized and recommended values already set in the indicator
2 - The method
This method works for intraday trading for timeframes between m5 and H1. Any timeframe above could work but would give signals too late - in this case, I would recommend changing the inputs with smaller values to adjust
I see a trend being composed of a main trend, and mini sub trends. In other words, for instance, a weekly bullish trend is made of smaller H4 bullish trends. Hope it makes sense so far
Let's call the weekly trend the MAIN trend and the H4 smaller trends the SECONDARY trends
That's exactly what this indicator is about
It will catch the best MAIN trend and all the SECONDARY trends in the same direction of the MAIN trend.
It's up to you if you want to take all the SECONDARY trends or only the first one in the sequence.
3 - Invalidation signal
A signal invalidation is used to make you exiting your position with a small loss before your stop loss will get hit. Very powerful way to save your capital and limit your losses.
You'll find the indicator here on tradingview for free under the name Trend signal with Alert (made by myself)
Trend signal with Alert
to invalidate entries. You'll need to request an invite
Briefly, let's assume we get a BUY signal. I would exit the position either if I'm getting a DOWN trend signal. It means, if the oblique/logarithmic trendline is broken, then it's better to exit the position and wait for the indicator to give another BUY signal later hopefully
Best case, it will limit your loss in case the asset will dump.
Worst case, this strict management strategy will make you exiting your position for no reason and you'll re-enter later (with a signal) at almost the same price or a bit higher
In the long run, this method will prevent you from having big losses
4 - Stop Loss and Take profits levels
It's really up to you. It depends of your capital and psychology
This indicator is made to give big moves but that's not 100% guaranteed. You can draw some trendlines or use moving averages in big timeframes to set your take profit and stop loss levels.
I personally use this also, along with fibonacci on the weekly/monthly timeframes for my take profit levels
As I'm a nice person, I'm linking the Fibonacci indicator that I use here
Automatic Multi-timeframes fibonacci zones
. You'll also need to request an invite for that one
4-bis - Trailing stop
Not financial advice but I use a supertrend and I have a software that will trail my stop according to that supertrend level
For LONG positions, we could set the trailing below the supertrend.
For SHORT positions, we could set the trailing above the supertrend.
You'll find the indicator here on tradingview for free under the name Supertrend V1.0 - Buy or Sell Signal
5 - Which assets
It's working with the default values on major/mid/small caps and for ALTS/BTC, ALTS/USD and ALTS/ETH pairing
YES, THIS IS MOST AWESOME THING OF THE ENTIRE UNIVERSE !!!
6 - Best setup
m15 timeframe is my preferred one for this method. Best Risk/Reward/Invalidations ratio among all other timeframes
I strongly recommend to use the Trend Signal with the input value 14 for the invalidations
If you enter on a BUY signal, and get a RED trend signal, exit immediately the position without waiting for any other confirmation/pullback or anything else
If you enter on a SELL signal, and get a BLUE trend signal, exit immediately the position without waiting for any other confirmation/pullback or anything else
For the trailing stop/Supertrend value, it depends of your capital and how big your stop loss should be. I personally use the settings in the Supertrend indicator
7 - Alerts
You can setup alerts for the primary and secondary signals in Tradingview so that you won't have to stare at the charts all day long. You mental healthy is my priority above everything else :)
8 - More to come
I personally use the alerts from this indicator coupled with a system to take the trades given by the tradingview alerts. I'll publish it later on if I feel the indicator collects enough interest from you guys


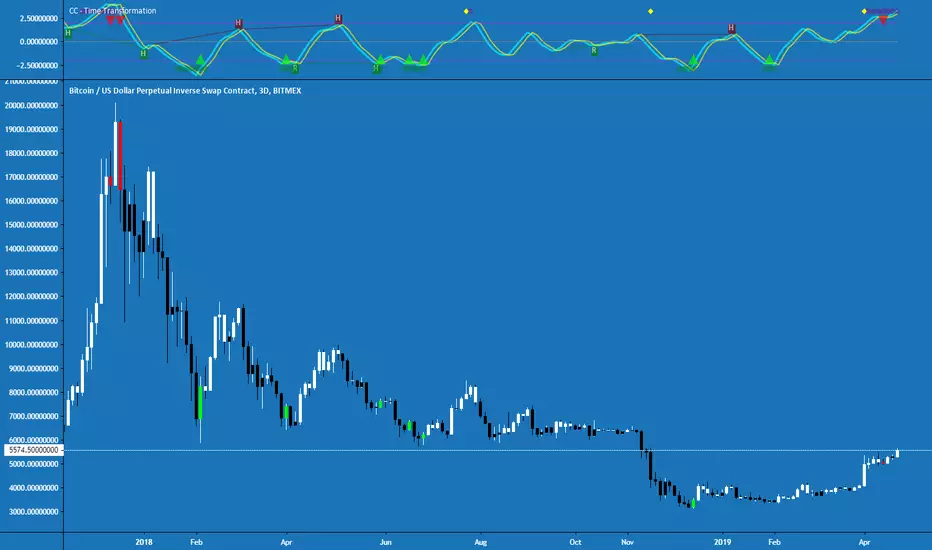
Cracking Cryptocurrency - Time TransformationTime Transformation is the creation of the Cracking Cryptocurrency Premium Trading Group . It's purpose is to provide volume , momentum, trend, and divergence at a glance. This limits the restrictions of a trader dramatically, by providing them with a powerful tool applicable on any asset, any time frame.
Momentum:
Time Transformation accurately interprets precise entry and exit positions in a ranging market via overbought and oversold conditions. When an asset is trending, these levels also indicate short-term exhaustion, and ideal profit taking levels.
These levels are completely customization, by adjusting the Cycle Length, and the boundaries of overbought and oversold itself. Also, with an advanced algorithm that calculates advanced price action, you can adjust this measurement for optimum results. One can even look at the momentum on a different time frame.
Trend:
Utilizing the power of Heikin Ashi to identify the dominant trend, this allows a trader to filter out the noise of Japanese candlesticks while still looking at their more accurate OHLC price information. Bars are colored pursuant to the dominant Heikin Ashi trend. One can also look at the Heikin Ashi trend of a higher or lower time frame to adjust the noise filtration.
Volume:
All traders know that we need volume for profitable movements. This indicator succinctly points out periods of unnatural volume , alerting a trader that a potential reversal or breakout may be occurring.
Divergence:
This Indicator understands fractal patterns of price action and oscillator movement. This allows for both Regular and Hidden divergence to be detected and displayed on the screen in real-time. One of the most powerful features of this indicator.
This Indicator boasts Multi-Time Frame features for both it's Momentum Oscillator and Trend Pattern Function, as well as fully adjustable settings for every function. Alerts are coded for every possible occurrence a trader could want.
Begin your journey towards market domination today. Allow this Indicator to Transform your Trading as it Transforms Time.
For access to this and all other Cracking Cryptocurrency Proprietary Indicators and Strategies, visit Cracking Cryptocurrency Premium Trading Group
Update Log:
-Adjusted default aesthetics to make Signal and Trigger Line more visible on a variety of backgrounds.
-Adjusted default aesthetics of zero line, overbought, oversold.
-Updated entire script to Pine Script Version 3.
-Updated Heikin Ashi Bar Recoloring Script - Will not re-paint, monitors the open and closing price and switches colors faster.
-Updated Input Setings for Multi-Time Frame feature. Much easier and more intuitive to select Time Frames from the drop-down menu.
-Simplified Input Settings, making them more intuitive.
-Updated Alert Messages to ease language barrier difficulties.
By Request: Added Alert Function for regular crosses.
Upcross = Fisher Crossing Over Signal Line.
Downcross = Fisher Crossing Under Signal Line.
Note that these are not buy/sell signals as per the Time Transformation strategy, as those crosses must occur in either overbought or oversold territory. :)
Crypto Multi-setting Ichimoku Cloud by MozzarelloEasy way to switch between Traditional, Single, Double and Crypto 24/7 Settings

Crypto trader for coins paired to USDCrypto base study to accompany the strategy I have published as I believe strategies aren't able to have alert conditions added.
Have altered the previous one and added a Trailing stop and adjusted it so it doesn't keep plotting entries if it's already in a trade. Feel free to comment or PM for any other details

Crypto Signal Warnings ( Margin/Exchange )Crypto Signal Alert is an intuitive and easy-to-use graphing buying tool that helps traders save time and maximize profits ^$$$^
- Features:
+ Optimized trading methods for multiple time frames 5M 15M 1H 4H (including Margin and Exchange Trading).
+ Build the rule of Stoploss / Takeprofit according to the risk management method according to the trader's strategy.
+ Real-time push alert system + Email + Popup on your desktop, laptop, tablet and smartphone => have time to enjoy trading live.
+ Our system runs 24/7.
*** Sign up for a 3-day trial here : goo.gl

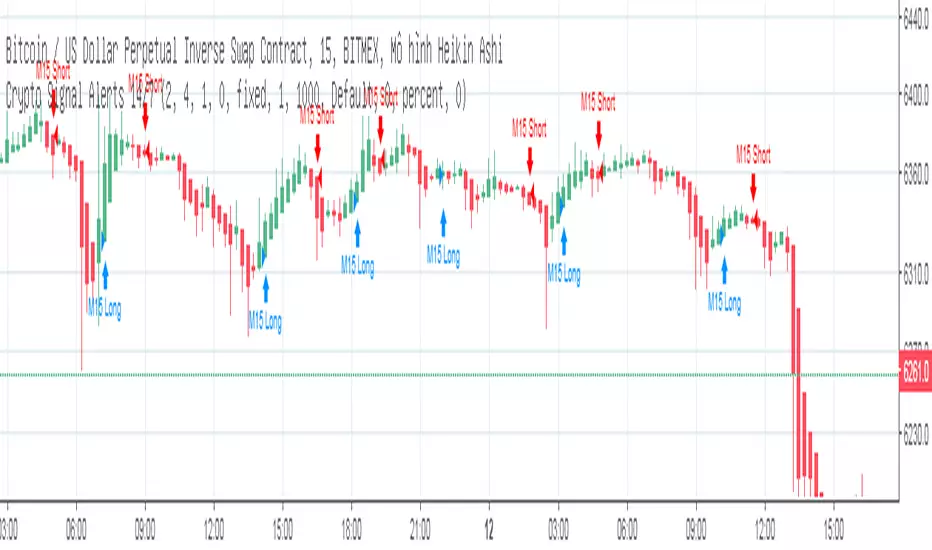
Crypto Signal Alerts ( Margin/Exchange )Crypto Signal Alert is an intuitive and easy-to-use graphing buying tool that helps traders save time and maximize profits ^$$$^
- Features:
+ Optimized trading methods for multiple time frames 5M 15M 1H 4H (including Margin and Exchange Trading).
+ Build the rule of Stoploss / Takeprofit according to the risk management method according to the trader's strategy.
+ Real-time push alert system + Email + Popup on your desktop, laptop, tablet and smartphone => have time to enjoy trading live.
+ Our system runs 24/7.
*** Sign up for a 3-day trial here : goo.gl
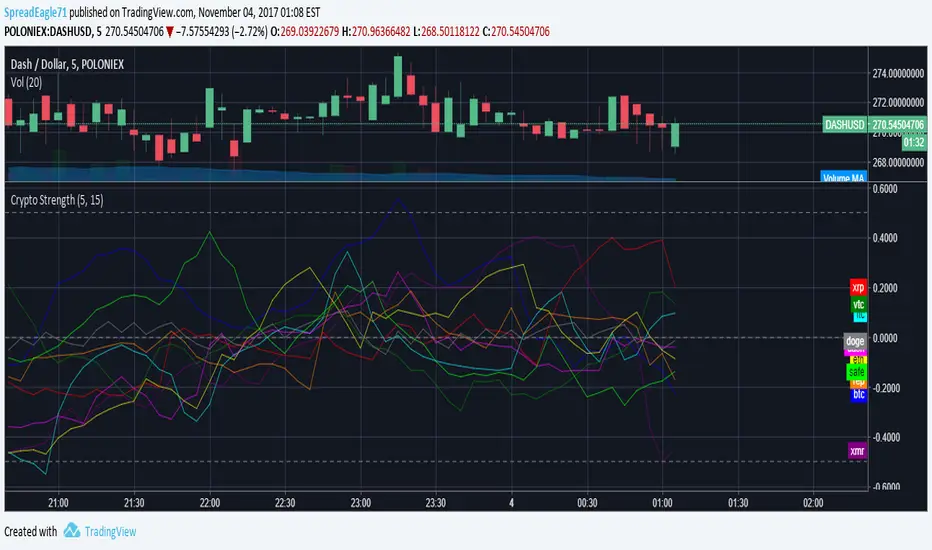
Crypto StrengthThis is a cryptocurrency strength meter based on an earlier post by Glaz who created a strength meter for forex trading.
Its based on the true strength indicator. It is good but not perfect.
May the Force be with you.
-SpreadEagle71
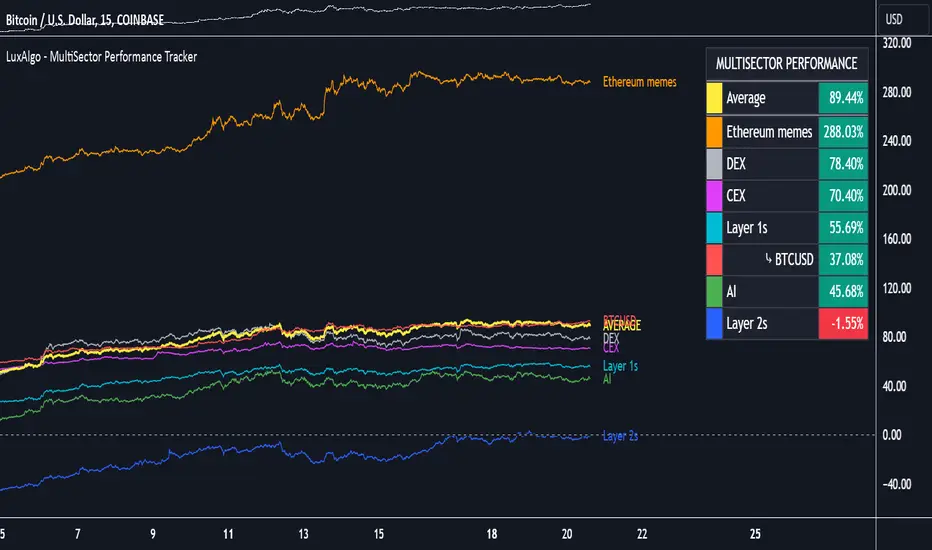
MultiSector Performance Tracker [LuxAlgo]The MultiSector Performance Tracker tool shows the overall performance of different crypto market sectors within a selected time frame, overlaid on a single chart for easy comparison.
Users can customize the time frame to suit their specific needs, whether daily, weekly, monthly, or yearly.
🔶 USAGE
The tool displays the performance of up to 6 crypto sectors within a selected time period, such as each day, week, month or year, or from the beginning of the year for any of the last 4 years.
The sectors and tickers within each sector are as follows:
Layer 1: CRYPTOCAP:ETH CRYPTOCAP:SOL CRYPTOCAP:TON
Layer 2: SEED_DONKEYDAN_MARKET_CAP:MATIC TSX:MNT AMEX:ARB
CEX: CRYPTOCAP:BNB CRYPTOCAP:OKB NYSE:BGB
DEX: CRYPTOCAP:UNI LSE:JUP CRYPTOCAP:RUNE
AI: CRYPTOCAP:NEAR GETTEX:TAO CRYPTOCAP:ICP
Ethereum Memes: CRYPTOCAP:PEPE CRYPTOCAP:SHIB CRYPTOCAP:FLOKI
Traders can compare the relative performance of a custom ticker against the sector of their choice and view the average of all sectors.
The tool is fully customizable, allowing traders to enable or disable any of the features or sectors.
🔹 Dashboard
The tool also displays the data in an ascending or descending sector performance dashboard, allowing traders to see at a glance which sectors are overperforming or underperforming.
Other dashboard features include custom ticker vs. sector comparison and sectors average, and traders can choose the location and size of the dashboard.
🔶 SETTINGS
Period: View all data by time period, daily, weekly, etc. Or view data from last year, last 2 years, etc.
Relative Performance Against: Enable/Disable relative performance comparison against a sector.
Use chart ticker: Enable the use of the chart ticker or a custom ticker for relative performance comparison.
🔹 Dashboard
Show Dashboard: Enable / disable Dashboard display.
Order: Choose between ascending and descending order.
Position: Selection of dashboard location.
Size: Selection of dashboard size.
🔹 Style
Show Sectors Labels: Enable / disable sector labels
Layer 1: Enable / disable Layer 1 sector
Layer 2: Enable / disable Layer 2 sector
CEX: Enable / disable CEX sector
DEX: Enable / disable DEX sector
AI: Enable / disable AI sector
Ethereum Memes: Enable / disable Ethereum Memes sector
Average: Enable / disable sectors average display
Custom Ticker: Enable / disable custom ticker display
Dominion - Bitcoin Altcoin Dominance [mutantdog]A simple and easy reference tool displaying a plot of the market cap dominance values for several significant cryptocurrencies.
The most widely used of these is bitcoin dominance (the top indicator shown above) which calculates the total market cap of bitcoin in relation to the total cryptocurrency market cap, displayed as a percentage. This is commonly used by traders to assess the strength of bitcoin in relation to the broader crypto market; increasing values being indicative of larger bitcoin moves and decreasing values often indicative of potential altcoin cycles. Likewise, ethereum dominance (the bottom indicator shown above) is frequently used as a means to indicate the strength of ethereum in relation to the broader crypto market.
Included options for marketcap dominance values are:
Bitcoin : CRYPTOCAP:BTC.D
Ethereum : CRYPTOCAP:ETH.D
Total DeFi (a composite of multiple top defi tokens): CRYPTOCAP:TOTALDEFI.D
Stablecoins (shows the combined dominance values for usdt and usdc): CRYPTOCAP:USDT.D + CRYPTOCAP:USDC.D
Flippening (shows the difference between bitcoin and ethereum dominance values): CRYPTOCAP:BTC.D - CRYPTOCAP:ETH.D
When used in combination with each other, these can provide a good overview of the general flow of capital within the crypto market.
Additional functionality:
up to three optional moving averages with a choice of SMA, EMA, WMA and RMA for each.
multi timeframe selector
alert condition presets for various moving average crosses.
Please be aware that, while useful as reference, dominance calculations are known to repaint frequently. As such the use of this indicator and its alerts should require caution.

Degen Dominator - (Crypto Dominance Tool) - [mutantdog]A fairly simple one this time. Another crypto dominance tool, consider it a sequel to Dominion if you will. Ready to go out-of-the-box with a selection of presets at hand.
The premise is straightforward, rather than viewing the various marketcap dominance indexes as their standard percentage values, here we have them represented as basic oscillators. This allows for multiple indexes to be viewed in one pane and gives a decent overview of their relative changes and thus the flow of capital within the overall crypto market. As a general rule-of-thumb, when a plot is above zero then the dominance is climbing, thus capital is likely flowing in that direction. The inverse applies when below zero. When the market is quiet, all will be close to zero. Basic overbought/oversold conditions can also be inferred too.
Active as default are:
Bitcoin (0range): CRYPTOCAP:BTC.D
Ethereum (Blue): CRYPTOCAP:ETH.D
Stablecoins (Red): CRYPTOCAP:USDT.D + CRYPTOCAP:USDC.D
Altcoins (Green): 100 - (all of the above)
These are plotted according to the selected oscillator preset and it's length parameter. The default is set to 'EMA Centre'. An optional RMA(3) smoothing filter is also included and active as default. Each index plot has its own colour and opacity settings available on the main page.
Additionally, the following are also available (deactivated as default):
Total DeFi : CRYPTOCAP:TOTALDEFI.D
Current Symbol : Will try to match corresponding dominance index for the chart symbol if available.
Custom Input : Manual text input, will try to match if available.
-------------
The included presets determine the oscillator type used, all are fairly simple and easy to interpret:
EMA Centre
SMA Centre
Median Centre
Midrange Centre
The first 4 are all variations on the same theme, simply calculated as the difference between the actual value and its respective average. EMA is the default and is my personal preference, if you generally favour using an SMA then perhaps that would be your better choice. Like the two MAs, median and midrange are also dependant on the length parameter. Midrange is calculated from the difference between highest and lowest values within the length period, with a little extra smoothing from an RMA(3).
Simple Delta
Weighted Delta
Running Delta
Often referred to as momentum, delta is just change over time. 'Simple' is the most basic of these, the difference between the current value and the value (length) bars prior. A more long-winded way of calculating this would be to take the difference between each bar and its previous then average them with an SMA which results in the same value. 'Weighted' adopts that principle but instead uses a WMA, likewise 'Running' is the same but using an RMA. The latter is actually the basis of RSI calculations before any normalisation is applied, as you can see in the next preset.
RSI
CMO
RSI really should not need explaining, it is however applied a little differently here to the usual, in this case centred around 0. The x100 multiplication factor has been dropped too for the sake of consistency. The same principle applies with CMO, which is basically a 'Simple Delta' version of RSI.
Hard Floor
Soft Floor
These last two are a little different but both can provide useful interpretations. The floor here is simply the lowest value within the chosen length period. 'Hard' plots the difference between the current value and the floor, thus giving a value that is always above 0. In this case, focus should be given to the relative heights of each with a simple interpretation that capital is flowing into those that are climbing and out of those descending. 'Soft' is essentially the same except that the floor is smoothed with an RMA(3), the result being that when new lows are made, the plot will break below 0 before the floor corrects a few bars later. This soft break provides additional information to that given by 'Hard' so is probably the more useful of the two.
------------
To finish it off, a bunch of preset alerts are included for the various 0 crossings.
So that just about covers everything then, all quite straightforward really. Future updates may include some extra stuff, the composition of the stablecoin index may change if necessary too. While this is not really a tweaker's tool like some of my other projects, there's still some room for experimentation here. The 'current' and 'custom' indexes can provide some useful data for compatible altcoins and the possibility to compare inter-related tokens (eg: Doge vs Shib). While i introduced this as a sort of sequel to Dominion, it is not intended as a replacement but more of a companion. This initially started as a feature intended for that one but it quickly grew into its own thing. Both the oscillator view here and the more traditional view have merits, i personally use this one primarily now but frequently refer to Dominion for confirmations etc.
That's it for now anyway. As always, feedback is welcome below. Enjoy!

Salience Theory Crypto Returns (AiBitcoinTrend)The Salience Theory Crypto Returns Indicator is a sophisticated tool rooted in behavioral finance, designed to identify trading opportunities in the cryptocurrency market. Based on research by Bordalo et al. (2012) and extended by Cai and Zhao (2022), it leverages salience theory—the tendency of investors, particularly retail traders, to overemphasize standout returns.
In the crypto market, dominated by sentiment-driven retail investors, salience effects are amplified. Attention disproportionately focused on certain cryptocurrencies often leads to temporary price surges, followed by reversals as the market stabilizes. This indicator quantifies these effects using a relative return salience measure, enabling traders to capitalize on price reversals and trends, offering a clear edge in navigating the volatile crypto landscape.
👽 How the Indicator Works
Salience Measure Calculation :
👾 The indicator calculates how much each cryptocurrency's return deviates from the average return of all cryptos over the selected ranking period (e.g., 21 days).
👾 This deviation is the salience measure.
👾 The more a return stands out (salient outcome), the higher the salience measure.
Ranking:
👾 Cryptos are ranked in ascending order based on their salience measures.
👾 Rank 1 (lowest salience) means the crypto is closer to the average return and is more predictable.
👾 Higher ranks indicate greater deviation and unpredictability.
Color Interpretation:
👾 Green: Low salience (closer to average) – Trending or Predictable.
👾 Red/Orange: High salience (far from average) – Overpriced/Unpredictable.
👾 Text Gradient (Teal to Light Blue): Helps visualize potential opportunities for mean reversion trades (i.e., cryptos that may return to equilibrium).
👽 Core Features
Salience Measure Calculation
The indicator calculates the salience measure for each cryptocurrency by evaluating how much its return deviates from the average market return over a user-defined ranking period. This measure helps identify which assets are trending predictably and which are likely to experience a reversal.
Dynamic Ranking System
Cryptocurrencies are dynamically ranked based on their salience measures. The ranking helps differentiate between:
Low Salience Cryptos (Green): These are trending or predictable assets.
High Salience Cryptos (Red): These are overpriced or deviating significantly from the average, signaling potential reversals.
👽 Deep Dive into the Core Mathematics
Salience Theory in Action
Salience theory explains how investors, particularly in the crypto market, tend to prefer assets with standout returns (salient outcomes). This behavior often leads to overpricing of assets with high positive returns and underpricing of those with standout negative returns. The indicator captures these deviations to anticipate mean reversions or trend continuations.
Salience Measure Calculation
// Calculate the average return
avgReturn = array.avg(returns)
// Calculate salience measure for each symbol
salienceMeasures = array.new_float()
for i = 0 to array.size(returns) - 1
ret = array.get(returns, i)
salienceMeasure = math.abs(ret - avgReturn) / (math.abs(ret) + math.abs(avgReturn) + 0.1)
array.push(salienceMeasures, salienceMeasure)
Dynamic Ranking
Cryptos are ranked in ascending order based on their salience measures:
Low Ranks: Cryptos with low salience (predictable, trending).
High Ranks: Cryptos with high salience (unpredictable, likely to revert).
👽 Applications
👾 Trend Identification
Identify cryptocurrencies that are currently trending with low salience measures (green). These assets are likely to continue their current direction, making them good candidates for trend-following strategies.
👾 Mean Reversion Trading
Cryptos with high salience measures (red to light blue) may be poised for a mean reversion. These assets are likely to correct back towards the market average.
👾 Reversal Signals
Anticipate potential reversals by focusing on high-ranked cryptos (red). These assets exhibit significant deviation and are prone to price corrections.
👽 Why It Works in Crypto
The cryptocurrency market is dominated by retail investors prone to sentiment-driven behavior. This leads to exaggerated price movements, making the salience effect a powerful predictor of reversals.
👽 Indicator Settings
👾 Ranking Period : Number of bars used to calculate the average return and salience measure.
Higher Values: Smooth out short-term volatility.
Lower Values: Make the ranking more sensitive to recent price movements.
👾 Number of Quantiles : Divide ranked assets into quantile groups (e.g., quintiles).
Higher Values: More detailed segmentation (deciles, percentiles).
Lower Values: Broader grouping (quintiles, quartiles).
👾 Portfolio Percentage : Percentage of the portfolio allocated to each selected asset.
Enter a percentage (e.g., 20 for 20%), automatically converted to a decimal (e.g., 0.20).
Disclaimer: This information is for entertainment purposes only and does not constitute financial advice. Please consult with a qualified financial advisor before making any investment decisions.

Smart DCA StrategyINSPIRATION
While Dollar Cost Averaging (DCA) is a popular and stress-free investment approach, I noticed an opportunity for enhancement. Standard DCA involves buying consistently, regardless of market conditions, which can sometimes mean missing out on optimal investment opportunities. This led me to develop the Smart DCA Strategy – a 'set and forget' method like traditional DCA, but with an intelligent twist to boost its effectiveness.
The goal was to build something more profitable than a standard DCA strategy so it was equally important that this indicator could backtest its own results in an A/B test manner against the regular DCA strategy.
WHY IS IT SMART?
The key to this strategy is its dynamic approach: buying aggressively when the market shows signs of being oversold, and sitting on the sidelines when it's not. This approach aims to optimize entry points, enhancing the potential for better returns while maintaining the simplicity and low stress of DCA.
WHAT THIS STRATEGY IS, AND IS NOT
This is an investment style strategy. It is designed to improve upon the common standard DCA investment strategy. It is therefore NOT a day trading strategy. Feel free to experiment with various timeframes, but it was designed to be used on a daily timeframe and that's how I recommend it to be used.
You may also go months without any buy signals during bull markets, but remember that is exactly the point of the strategy - to keep your buying power on the sidelines until the markets have significantly pulled back. You need to be patient and trust in the historical backtesting you have performed.
HOW IT WORKS
The Smart DCA Strategy leverages a creative approach to using Moving Averages to identify the most opportune moments to buy. A trigger occurs when a daily candle, in its entirety including the high wick, closes below the threshold line or box plotted on the chart. The indicator is designed to facilitate both backtesting and live trading.
HOW TO USE
Settings:
The input parameters for tuning have been intentionally simplified in an effort to prevent users falling into the overfitting trap.
The main control is the Buying strictness scale setting. Setting this to a lower value will provide more buying days (less strict) while higher values mean less buying days (more strict). In my testing I've found level 9 to provide good all round results.
Validation days is a setting to prevent triggering entries until the asset has spent a given number of days (candles) in the overbought state. Increasing this makes entries stricter. I've found 0 to give the best results across most assets.
In the backtest settings you can also configure how much to buy for each day an entry triggers. Blind buy size is the amount you would buy every day in a standard DCA strategy. Smart buy size is the amount you would buy each day a Smart DCA entry is triggered.
You can also experiment with backtesting your strategy over different historical datasets by using the Start date and End date settings. The results table will not calculate for any trades outside what you've set in the date range settings.
Backtesting:
When backtesting you should use the results table on the top right to tune and optimise the results of your strategy. As with all backtests, be careful to avoid overfitting the parameters. It's better to have a setup which works well across many currencies and historical periods than a setup which is excellent on one dataset but bad on most others. This gives a much higher probability that it will be effective when you move to live trading.
The results table provides a clear visual representation as to which strategy, standard or smart, is more profitable for the given dataset. You will notice the columns are dynamically coloured red and green. Their colour changes based on which strategy is more profitable in the A/B style backtest - green wins, red loses. The key metrics to focus on are GOA (Gain on Account) and Avg Cost .
Live Trading:
After you've finished backtesting you can proceed with configuring your alerts for live trading.
But first, you need to estimate the amount you should buy on each Smart DCA entry. We can use the Total invested row in the results table to calculate this. Assuming we're looking to trade on BITSTAMP:BTCUSD
Decide how much USD you would spend each day to buy BTC if you were using a standard DCA strategy. Lets say that is $5 per day
Enter that USD amount in the Blind buy size settings box
Check the Blind Buy column in the results table. If we set the backtest date range to the last 10 years, we would expect the amount spent on blind buys over 10 years to be $18,250 given $5 each day
Next we need to tweak the value of the Smart buy size parameter in setting to get it as close as we can to the Total Invested amount for Blind Buy
By following this approach it means we will invest roughly the same amount into our Smart DCA strategy as we would have into a standard DCA strategy over any given time period.
After you have calculated the Smart buy size , you can go ahead and set up alerts on Smart DCA buy triggers.
BOT AUTOMATION
In an effort to maintain the 'set and forget' stress-free benefits of a standard DCA strategy, I have set my personal Smart DCA Strategy up to be automated. The bot runs on AWS and I have a fully functional project for the bot on my GitHub account. Just reach out if you would like me to point you towards it. You can also hook this into any other 3rd party trade automation system of your choice using the pre-configured alerts within the indicator.
PLANNED FUTURE DEVELOPMENTS
Currently this is purely an accumulation strategy. It does not have any sell signals right now but I have ideas on how I will build upon it to incorporate an algorithm for selling. The strategy should gradually offload profits in bull markets which generates more USD which gives more buying power to rinse and repeat the same process in the next cycle only with a bigger starting capital. Watch this space!
MARKETS
Crypto:
This strategy has been specifically built to work on the crypto markets. It has been developed, backtested and tuned against crypto markets and I personally only run it on crypto markets to accumulate more of the coins I believe in for the long term. In the section below I will provide some backtest results from some of the top crypto assets.
Stocks:
I've found it is generally more profitable than a standard DCA strategy on the majority of stocks, however the results proved to be a lot more impressive on crypto. This is mainly due to the volatility and cycles found in crypto markets. The strategy makes its profits from capitalising on pullbacks in price. Good stocks on the other hand tend to move up and to the right with less significant pullbacks, therefore giving this strategy less opportunity to flourish.
Forex:
As this is an accumulation style investment strategy, I do not recommend that you use it to trade Forex.
STRATEGY IN ACTION
Here you see the indicator running on the BITSTAMP:BTCUSD pair. You can read the indicator as follows:
Vertical green bands on historical candles represents where buy signals triggered in the past
Table on the top right represents the results of the A/B backtest against a standard DCA strategy
Green Smart Buy column shows that Smart DCA was more profitable than standard DCA on this backtest. That is shown by the percentage GOA (Gain on Account) and the Avg Cost
Smart Buy Zone label marks the threshold which the entire candle must be below to trigger a buy signal (line can be changed to a box under plotting settings)
Green color of Smart Buy Zone label represents that the open candle is still valid for a buy signal. A signal will only be generated if the candle closes while this label is still green
Below is the same BITSTAMP:BTCUSD chart a couple of days later. Notice how the threshold has been broken and the Smart Buy Zone label has turned from green to red. No buy signal can be triggered for this day - even if the candle retraced and closed below the threshold before daily candle close.
Notice how the green vertical bands tend to be present after significant pullbacks in price. This is the reason the strategy works! Below is the same BITSTAMP:BTCUSD chart, but this time zoomed out to present a clearer picture of the times it would invest vs times it would sit out of the market. You will notice it invests heavily in bear markets and significant pullbacks, and does not buy anything during bull markets.
Finally, to visually demonstrate the indicator on an asset other than BTC, here is an example on CRYPTO:ETHUSD . In this case the current daily high has not touched the threshold so it is still possible for this to be a valid buy trigger on daily candle close. The vertical green band will not print until the buy trigger is confirmed.
BACKTEST RESULTS
Now for some backtest results to demonstrate the improved performance over a standard DCA strategy using all non-stablecoin assets in the top 30 cryptos by marketcap.
I've used the TradingView ticker (exchange name denoted as CRYPTO in the symbol search) for every symbol tested with the exception of BTCUSD because there was some dodgy data at the beginning of the TradingView BTCUSD chart which overinflated the effectiveness of the Smart DCA strategy on that ticker. For BTCUSD I've used the BITSTAMP exchange data. The symbol links below will take you to the correct chart and exchange used for the test.
I'm using the GOA (Gain on Account) values to present how each strategy performed.
The value on the left side is the standard DCA result and the right is the Smart DCA result.
✅ means Smart DCA strategy outperformed the standard DCA strategy
❌ means standard DCA strategy outperformed the Smart DCA strategy
To avoid overfitting, and to prove that this strategy does not suffer from overfitting, I've used the exact same input parameters for every symbol tested below. The settings used in these backtests are:
Buying strictness scale: 9
Validation days: 0
You can absolutely tweak the values per symbol to further improve the results of each, however I think using identical settings on every pair tested demonstrates a higher likelihood that the results will be similar in the live markets.
I'm presenting results for two time periods:
First price data available for trading pair -> closing candle on Friday 26th Jan 2024 (ALL TIME)
Opening candle on Sunday 1st Jan 2023 -> closing candle on Friday 26th Jan 2024 (JAN 2023 -> JAN 2024)
ALL TIME:
BITSTAMP:BTCUSD 80,884% / 133,582% ✅
CRYPTO:ETHUSD 17,231% / 36,146% ✅
CRYPTO:BNBUSD 5,314% / 2,702% ❌
CRYPTO:SOLUSD 1,745% / 1,171% ❌
CRYPTO:XRPUSD 2,585% / 4,544% ✅
CRYPTO:ADAUSD 338% / 353% ✅
CRYPTO:AVAXUSD 130% / 160% ✅
CRYPTO:DOGEUSD 13,690% / 16,432% ✅
CRYPTO:TRXUSD 414% / 466% ✅
CRYPTO:DOTUSD -16% / -7% ✅
CRYPTO:LINKUSD 1,161% / 2,164% ✅
CRYPTO:TONUSD 25% / 47% ✅
CRYPTO:MATICUSD 1,769% / 1,587% ❌
CRYPTO:ICPUSD 70% / 50% ❌
CRYPTO:SHIBUSD -20% / -19% ✅
CRYPTO:LTCUSD 486% / 718% ✅
CRYPTO:BCHUSD -4% / 3% ✅
CRYPTO:LEOUSD 102% / 151% ✅
CRYPTO:ATOMUSD 46% / 91% ✅
CRYPTO:UNIUSD -16% / 1% ✅
CRYPTO:ETCUSD 283% / 414% ✅
CRYPTO:OKBUSD 1,286% / 1,935% ✅
CRYPTO:XLMUSD 1,471% / 1,592% ✅
CRYPTO:INJUSD 830% / 1,035% ✅
CRYPTO:OPUSD 138% / 195% ✅
CRYPTO:NEARUSD 23% / 44% ✅
Backtest result analysis:
Assuming we have an initial investment amount of $10,000 spread evenly across each asset since the creation of each asset, it would have provided the following results.
Standard DCA Strategy results:
Average percent return: 4,998.65%
Profit: $499,865
Closing balance: $509,865
Smart DCA Strategy results:
Average percent return: 7,906.03%
Profit: $790,603
Closing balance: $800,603
JAN 2023 -> JAN 2024:
BITSTAMP:BTCUSD 47% / 66% ✅
CRYPTO:ETHUSD 26% / 33% ✅
CRYPTO:BNBUSD 15% / 17% ✅
CRYPTO:SOLUSD 272% / 394% ✅
CRYPTO:XRPUSD 7% / 12% ✅
CRYPTO:ADAUSD 43% / 59% ✅
CRYPTO:AVAXUSD 116% / 151% ✅
CRYPTO:DOGEUSD 8% / 14% ✅
CRYPTO:TRXUSD 48% / 65% ✅
CRYPTO:DOTUSD 24% / 35% ✅
CRYPTO:LINKUSD 83% / 124% ✅
CRYPTO:TONUSD 7% / 21% ✅
CRYPTO:MATICUSD -3% / 7% ✅
CRYPTO:ICPUSD 161% / 196% ✅
CRYPTO:SHIBUSD 1% / 8% ✅
CRYPTO:LTCUSD -15% / -7% ✅
CRYPTO:BCHUSD 47% / 68% ✅
CRYPTO:LEOUSD 9% / 11% ✅
CRYPTO:ATOMUSD 1% / 15% ✅
CRYPTO:UNIUSD 9% / 23% ✅
CRYPTO:ETCUSD 27% / 40% ✅
CRYPTO:OKBUSD 21% / 30% ✅
CRYPTO:XLMUSD 11% / 19% ✅
CRYPTO:INJUSD 477% / 446% ❌
CRYPTO:OPUSD 77% / 91% ✅
CRYPTO:NEARUSD 78% / 95% ✅
Backtest result analysis:
Assuming we have an initial investment amount of $10,000 spread evenly across each asset for the duration of 2023, it would have provided the following results.
Standard DCA Strategy results:
Average percent return: 61.42%
Profit: $6,142
Closing balance: $16,142
Smart DCA Strategy results:
Average percent return: 78.19%
Profit: $7,819
Closing balance: $17,819
