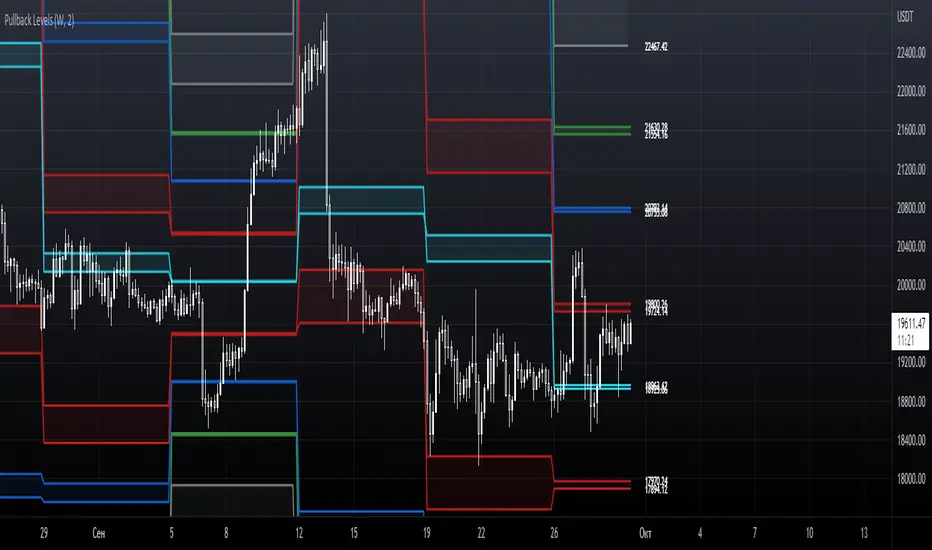
Pullback LevelsPullback Levels is a technical indicator for predicting large price movements by calculating support and resistance levels. It is used to determine the general market trend on different timeframes. Pullback levels are used when prices are built above or below them, indicating the priority direction of movement.
Analysis of support and resistance levels often coincides with the action levels of large players, similar to the analysis of a trend line. When analyzing Pullback levels, the first support and resistance levels are calculated using the width of the trading range and the volume traded during this period. The second support and resistance levels are calculated using the larger trading range width given the highs and lows.
It also provides the ability to flexibly adjust the levels, their visualization, style, calculation methods and the used timeframe. For the convenience of backtesting, all historical levels are saved on the chart. To analyze current price movements and determine pullbacks, all prices are displayed next to the levels.
-------------------------------------------
Pullback levels – технический индикатор для прогнозирования крупных ценовых движений путем расчета уровней поддержки и сопротивления . Используется для определения общего рыночного тренда на различных таймфреймах. Pullback levels используются при построение цены выше или ниже них, указывая на приоритетное направление движения.
Анализ уровней поддержки и сопротивления часто совпадает с уровнями действия крупных игроков, наподобие анализа трендовой линии. При анализе Pullback уровней первые уровни поддержки и сопротивления рассчитываются с использованием ширины торгового диапазона и объёмом проторгованным за этот период. Вторые уровни поддержки и сопротивления рассчитываются с использованием более старшей ширины торгового диапазона учитывая максимумы и минимумы.
Он так же предоставляет возможность гибкой настройки уровней - их визуальной составляющей, стиля, методов расчёта и используемого таймфрейма. Для удобства бэктестинга все исторические уровни сохраняются на графике. Для анализа текущих ценовых движений и определении точек разворота, все цены находятся рядом с уровнями.
Pesquisar nos scripts por "crypto"
Crypto Breakout AlertThe indicator plots breakout events of user-defined assets list, providing alert setting for breakout events.
Any big trend begins with a couple of price breakouts. By watching breakout events, we overlook the panorama of the whole market.
---------- Features --------------
User-Defined Crypto / or any Asset List, Up To 30 Assets
User-Defined Breakout Threshold
Accessible for wide timeframes: 5s - 1 Month
Plot the Breakouts History of whole market
Progressive color according to the strength of the breakthrough
--------- Indicator Settings -----------
"Show Bull or Bear?": To show Bull Breakout, Bear Breakout or Both
"User-Defined Breakout Threshold": User can defined the threshold of breakout, default value 999 means using default set up, as following - "Default Breakout Threshold"
"A rate to decrease Bitcoin Threshold": Bitcoin has much lower volatility than other coins, so this rate is usded to lower the threshold for Bitcoin, defval = 0.5
"Use Green for Bull? ": Toggle color for Bull, defval: true, if your region use red for bull, toggle it.
"Exchange": Your exchange name, which is used to defined tickerid, defval="BINANCE", optional - can be empty
"Asset PostFix": postfix of your asset symbol, which is used to define tickerid, defval="USDTP", change it if necessary, this can not be empty.
"Toggle Notice Label": close or open the notice label
--------- Default Breakout Threshold For Popular Timeframes-------------
5s 0.5%
15s 0.75%
30s 0.9%
1m 1.2%
2m 1.4%
3m 1.6%
5m 1.8%
8m 2%
15m 3%
20m 3.5%
30m 4%
60m 5%
120m 6.5%
240m 8%
480m 10%
1D 12%
1W 20%
---------- Versions Description ----------
The features may change later without advance notice.
DEMO version has basic features.
---------- Access to Indicators ----------
Contact the author by Private Chat for access to Invite-Only versions and a trial.
---------- Install Invite Only Version----------
Open the chart -> Add Indicators (On the Top or press /) -> Invite-Only Scripts (last button of the left bar)
Like/Favorite the indicator
Click to install on the chart
---------- About Loading Time ----------
It may take up to 1-3 minutes for your browser to load a new setting, depending on the your computer and network speed. For convenience, you can keep related pages open continuously.
---------- FAQ -----------
1. Why can't I see older breakout labels?
Due to system limit, 500 is the maximum of labels.
In order to see older breakout events, please Select Bull or Bear, instead of Both; Or Increase to filter weak breakouts.
2. How to watch more than 30 coins?
Due to system limit, 30 assets is the maximum.
In order to watch more assets, user can open the indicator in another chart, add your 2nd assets list, save 2nd layout, set alerts for different lists respectively.
---------- Disclaimer ----------
By using or requesting access to the indicator, you acknowledge that you have read and accepted that the indicator and any related content, including but not limited to: user manual, tutorials, ideas, videos, chats, emails, blog, are for the purpose of trading strategies studying and paper trading.
If a customer or user uses the indicator or related content mentioned above for live trading or investment, she/he should take all risks and responsibility of her/his own trading and investment activities.
---------- Updates ----------
The latest updates override the previous description.
To activate a update: Close the browser, Reopen the chart and apply the indicator.
【加密货币突破预警】指标绘制一系列资产的突破事件,提供突破预警
任何大趋势都开始于一系列的价格突破。通过监控突破事件,可以俯瞰市場的運動
---------- 产品特征------------
用户自定义的加密货币品种列表,或者其他资产列表,多达30个品种
用户自定义的突破门槛
适用于宽泛的时间维度:5秒--1月
绘制整个市场的突破历史
漸進顏色 根據突破的力度
------------- 指标设置说明 -------------------
"展示牛熊突破?": 展示牛突破,熊突破或者两者
“用户自定义突破门槛”: 自己定义突破门槛,999代表默认的设置,详见下方“默认的突破门槛”
"比特币突破门槛修正": 比特币的波动性远远低于其他加密货币,这个比率用来调低比特币的门槛
"切换通知标签": 用来开关通知标签
"綠色為牛?": 切換標籤顏色,默認綠色為牛
“交易所”:用来定义资产名称,可以为空
“资产后缀”: 用来定义资产名称,不可以为空
---------默認的突破門檻-------------
5s 0.5%
15s 0.75%
30s 0.9%
1m 1.2%
2m 1.4%
3m 1.6%
5m 1.8%
8m 2%
15m 3%
20m 3.5%
30m 4%
60m 5%
120m 6.5%
240m 8%
480m 10%
1D 12%
1W 20%
---------- 版本描述 ----------------
產品特徵後續可能變化,恕不事先通知
DEMO版本供試用
----------- 獲取指標使用權 ------------
通過私信聯繫作者,要求訂閱或試用
----------- 安裝指標 -----------------
加指標 -》 Invite-Only (左邊欄目)
點贊或者收藏指標
點擊安裝指標
----------- 關於載入時間 ---------------
可能需要1--3分鐘來完成載入,取決於用戶的電腦和網絡速度,方便起見可以保持相關頁面持續開啟
------- FAQ ----------
1. 如何查看更早的突破歷史
由於系統限制,500 個標籤是上限
為了查看更早的突破,請選擇牛或者熊,而不是兩者;或者提高"用戶自定義突破門檻" 來過濾掉弱突破
2. 如何監控更多資產?
由於系統限制,30個資產是上限
為了監控更多資產,可以在第二個圖表加載指標,保存圖表,分別在不同的圖表設置突破預警
---------- 免責聲明 ----------
在要求獲得本指標使用權之前以及在使用本指標之前,用戶認可已經完全了解和接受:本指標僅供學習交流目的, 它不構成任何交易建議或者投資建議。用戶如果將指標用於其他用途,應自行承擔所有風險和責任。
本指標的開發者並非專業投資顧問,因此不對用戶的任何行为負責。
最近的更新會覆蓋之前的說明。請參閱更新來查看指標的新特徵和功能。

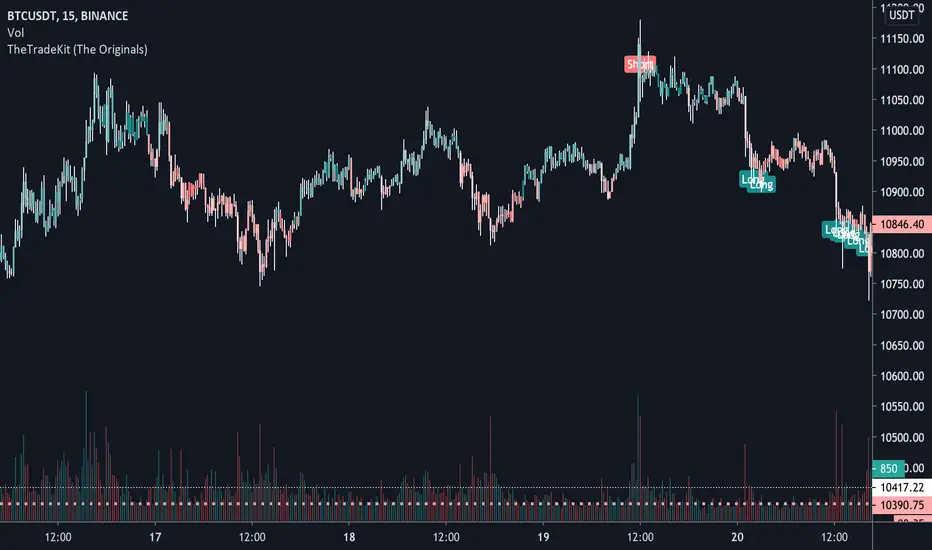
TheTradeKit (The Originals)TheTradeKit (lifetime) Indicator Suite
A data first approach. Community Second. Transparent always.
Designed for traders of any market including:
- Crypto
- Forex
- Stocks
- Commodities
With a little configuration and insight into your trading style. TheTradeKit has been designed to be as simple as selecting a pair and let the market present opportunities for you. Built with all intent of taking the emotion out of trading.
Messages me for “The Originals” access - this will be the area for beta releases whilst we build success here at TheTradeKit and for our community.
Strategy Returns optimal Buy/Sell, S/L and Target Zones with the help of confirming indicators such as:
#MovingAverages
#RelativeStregthIndex
#PivotPoints
Indicator Suite (Tuesday, 22nd September 2020)
We are constantly including beta releases; it is suggested by legal friends to take this opportunity to mention this indicator dictates research based on history only and will not forecast the future. What you perceive to be the result of the plot function may not in fact be that of what I nor, any other perceives.
ICT Killzone For Crypto Markets.Adjusted for Crypto 24/7 markets
Adjusted for UTC
i have hidden the asian open range and daily bars on my charts , you can choose to have them on
Less screen clutter
London Open 8:00 - 4:30 - Killzone 7:00 - 9:00
NewYork Open 9:30 - 4:00 Killzone 8:00 - 10:00
Shanghai open 9:15 Killzone 8:00 - 10:00
NOT MY ORIGINAL SCRIPT. JUST MODIFIED VERSION

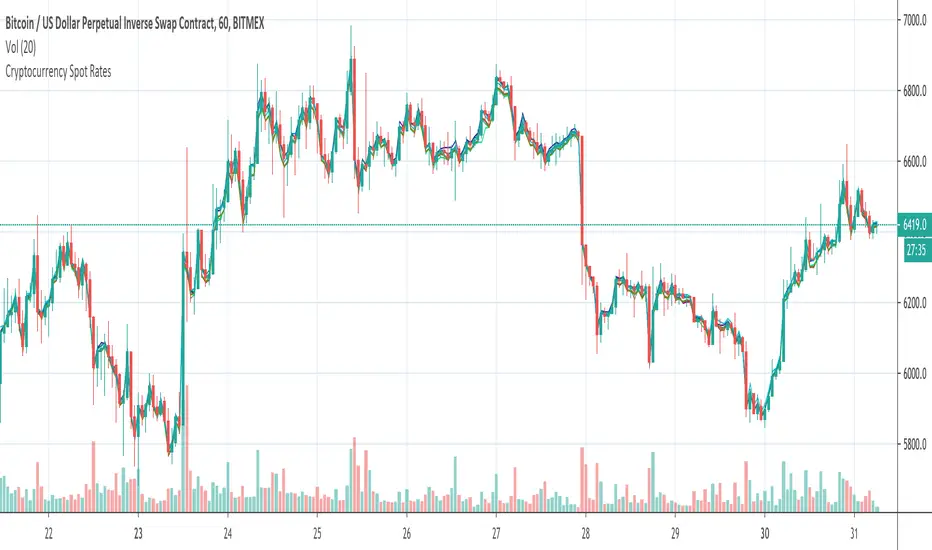
Cryptocurrency Spot RatesThis is an overlay indicator on the chart that will plot cryptocurrency spot prices of the following exchanges:
- Coinbase
- Poloniex
- OKCOIN
- Binance
- Huobi
- Bittrex
- HitBTC
- Kraken
- Bitfinex
Additionally it plots the price average of all those exchanges.
This overlay is intended to be used on charts with derivatives/futures such as BitMEX/Deribit/...
It works with all USD and Tether pairs on the main chart (for example BTCUSD, ETHUSD, BCHUSD,...)
Cracking Cryptocurrency - ParalloxParallox
Many traders are familiar with or utilize the Relative Strength Index ( RSI ) and/or the Commodity Channel Index ( CCI ). For good reason, these classic and simple to understand indicators have made their way into many traders indicator bays with mixed results. As we often do with our trading style and indicators here at Cracking Cryptocurrency is take things that traders have used one way and attempt to view it in a different light to improve our trading efficiency and performance. That is what we have done with Parallox.
Parallox harnesses the calculations of both the Relative Strength Index and Commodity Channel Index , but through a calculation for a new breed of trader and a new market. RSI and CCI were designed to work in the stock markets of old, and their effectiveness nowadays is more-so due to the "self fulfilling prophecy" concept of so many traders using them rather then their technical applicability to any particular market or market circumstance. Moreover, because so many retail traders now utilize the RSI and CCI , trading it the traditional way, for reversals, has created a golden zone of opportunity for larger traders, institutions, and whales to come in and grab the liquidity of counter-trend retail traders basing their signals off of overbought and oversold conditions in the market utilizing RSI and CCI .
What Parallox does is quite different. Instead of relying on the readings of RSI and CCI , it looks at the value of RSI relative to the value of CCI . By looking at the convergence or divergence of these two indicators, a much more accurate reading of the directional trend can be established. No more using these oscillators to pick false tops and bottoms, instead we can utilize their relative conditions to determine market trend. Not only that, but we can identify objective signals when we cross the barrier between convergence and divergence, therefore giving us clear buy and sell signals for any trading asset.
However, we haven't left reversal traders completely by the way side. What is often an "entry" point for reversal traders, when one has determined that the particular direction of the market is at it's extreme, is where Parallox crosses back the other way, identifying an "overbought" and "oversold" region of sorts, from which we can utilize as an exit indicator when in deeply profitable trending trades.
How to Use
Using Parallox is quite simple. It can be utilized as an Initiator or Confirmer, or also as a longer-term directional marker on any time frame. In it's most simple form, the Parallox Line will cross zero from below and the line will turn green. This is an indication that the market has moved from a bearish zone of control to a bullish zone of control, and can be viewed as a potential buy signal. Conversely, when the line crosses zero from above, the line will turn red, indicating the opposite and can be viewed as a potential short sell signal.
For exit indications in strongly trending markets, when the line goes below the lower dashed line when bearish , and above the upper dashed line when bullish , and comes either back below or back above, those can be seen as trend exhaustion signals and often represent great moments to take profit or to go flat in the market until another trend establishes itself.
Settings
Let's take a look at the settings of Parallox.
First, we can input the look back length we want for our RSI and CCI indicators. You will notice that the defaults are unnatural, that is because they are tuned specifically for the BTC USD market. When trading a different asset, you will want to experiment with the optimum look back length for the best signals.
We then take a moving average of our indicators to have plotted values to work with. As above, the look back lengths for the two moving averages are optimized for BTC USD. The same caveats for optimization apply.
Then we can select the smoothing, or type of moving average we wish to utilize. Parallox performs well with different types of moving average smoothing, and I recommend that you experiment with your style of trade to find the signals that best suit your trading system.
We can also select the source of our indicator values. By default, this is hl2 , which I find to be the best for most indicators, in a close tie with hlc3.
Strategy
Please let me know of your success stories, as well as any features you think would be helpful to add. If you notice any errors within it, please notify me so I can fix them. Trade Safely.

Triple RSI - by cryptotradingresource.com -This simple combination of 3 different RSI can help you to find a good entry or exit point.
Default RSI's are: 5, 13, 50. You can simple change them on values you like to use more.
For buy the background color will change into green and for sell, red. Play around and find the best settings that fits your trading setup.
Check out also my other indicators.
Happy trading
+++ use this tool on your own risk. i'm not responsible for your loses +++

-- Prince Angel 2.0 -- By @CryptoNTez --Script designed for prince angel as requested.
The script is private and is only for the requestor or their partners.
Script based on different trading indicators to plot buy or sell signals.
Happy trading.

Complete Ichimoku Trader *modified*I just found this script from @kingthies here and like it. So i just made some changes and added some little code into it.
Reduced some noise for the signals. Hope anyone can enjoy it. But keep in mind, did not test it on live trading! Had just some time and love to work in pine :)
Original
Happy Trading


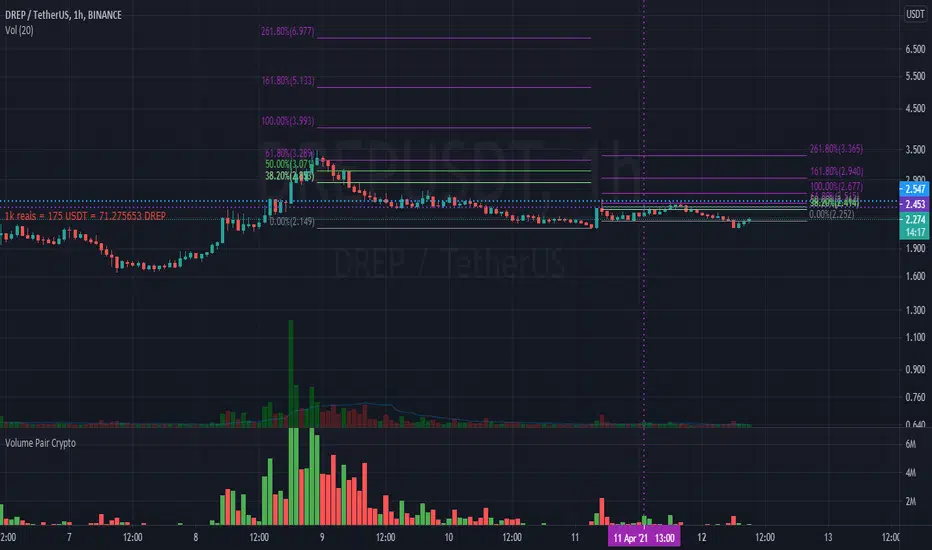
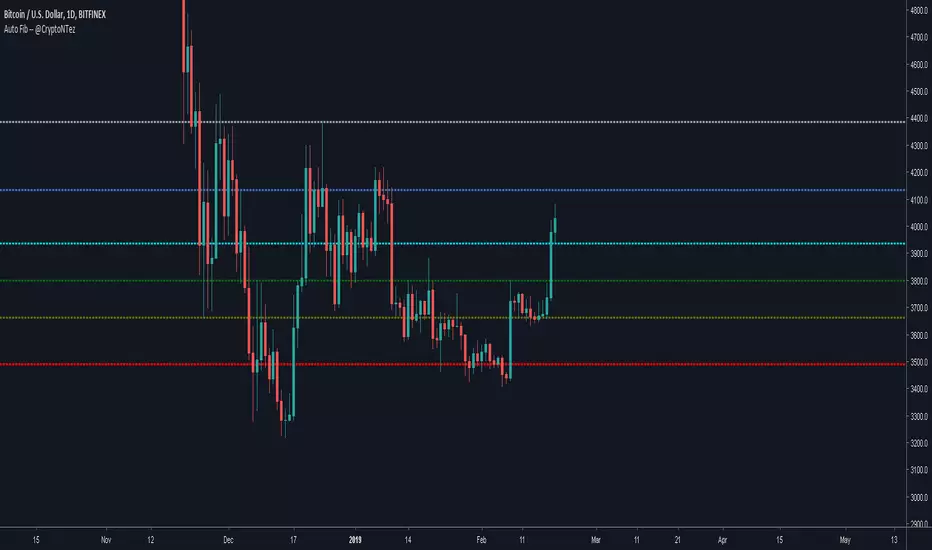
Auto Fibonacci Retracement -- @CryptoNTezTired of searching that HIGH point in the chart? and where is the lowest? Oh men, I cant draw it with 100% accuracy... no more.
A simple tool to plot Fibonacci retracements without the need of drawing them.
Happy Trading.
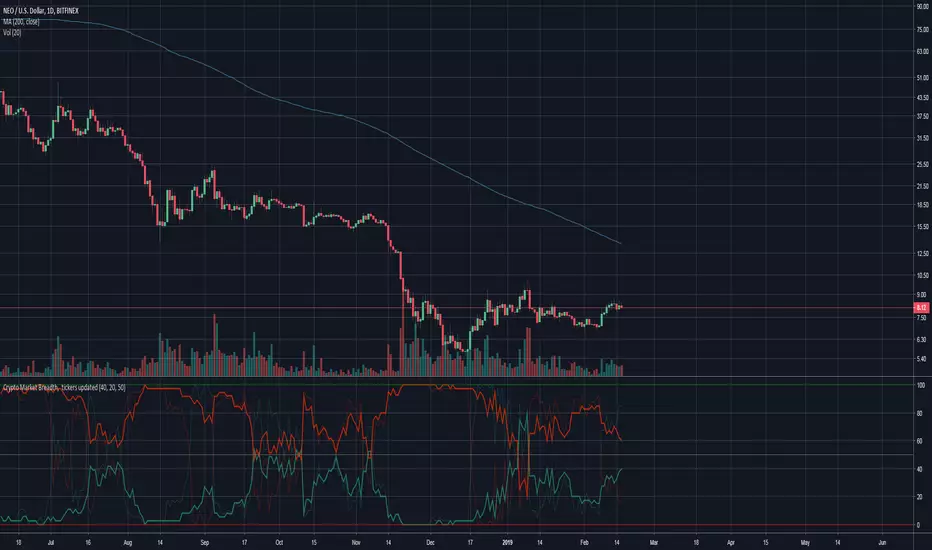
Bitcoin StableCoins Histogram -- @CryptoNTezThe script will let you see the histogram volume of TrueUSD -- USDTether -- USD or the combination of them.
The values are being pulled from all the available pairs in Tradingview. Once new pairs hit the site I will be adding them aswell
enjoy :)

10D vs 20D SMA Cross + PPO DIV -- @TheEyeofCrypto110D vs 20D SMA Cross + PPO Div analysis for Potential buy/sell signals.
idea from @TheEyeofCrypto1 (Check his twitter).

@CryptoGat Strategy 3EMAs CrossStrategy based on this video from @CryptoGat www.youtube.com
Longs and exits are displayed on the chart for better reference

Crypto Reversal Scalper STARTER KIT AlertsThis is alerts for automated trading for:
This is a starter kit for people to try out.
Since many people were confused to how to properly config the original script, I decided to create this script.
This script uses the original script but is compiled to have presets.
Simple to use, EASY AS 1,2,3
1. Choose PAIR
2. Sync chart with chosen pair (Symbol and Timeframe)
3. DONE!
4. (Optional) Adjust Stoploss and Takeprofit
This will be FREE for people to consider giving it a try.
To automate the trades, you will need to have the alerts for the script.
If you want to automate the trades, PM me.

Crypto Reversal Scalper DEMO / FREE BacktesterCrypto Reversal Scalper Lite
This is a lite version of:
This script allows anyone to try out the capability of the script with restrictions to some features. If you want to unlock all the features, consider upgrading.
Full version also includes alerts for automated trading.

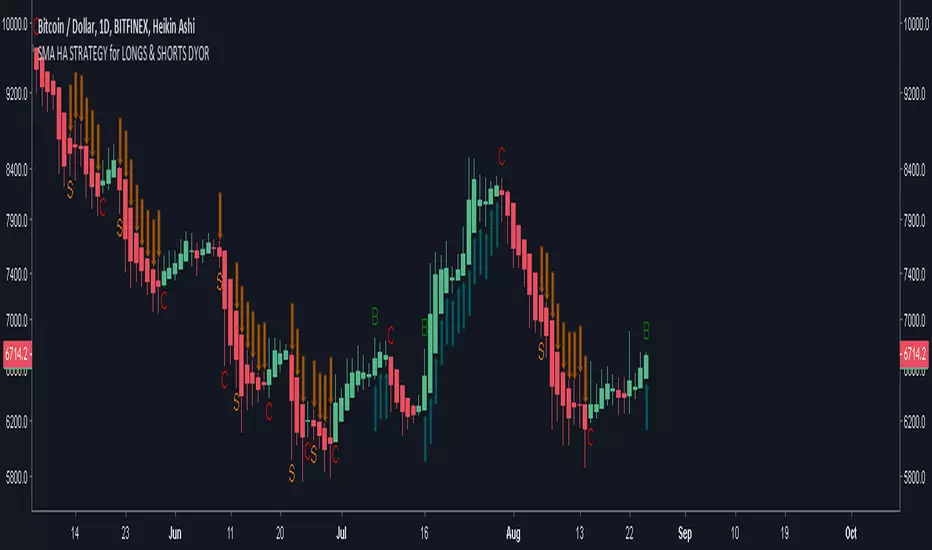
SMA HA STRATEGY for LONGS & SHORTS DYOR (10D v 20D)Script around SMA crossing.
10Dv20D
Usefull for Longs and Shorts signals.


EMA Cross for Long and Short with Stoch/MACD/RSI + IchimokuPrimary and Secondary EMA Cross analysis for Long and Short with Stoch/MACD/RSI Analysis + Ichimoku Cloud
The script will let you choose to show (or not):
*Primary EMA Trend
*Secondary EMA Trend
*Stochastic Alerts
*MACD Alerts
*RSI Alerts
*LONG or SHORT Alerts
It will also let you configure the EMA periods. ichimoku, MACD and RSI seetings
The cost to the tool is 0.005BTC.
For custom scripts send me a PM.

EMA analysis with Stoch OverSold/Bought indicator + IchimokuThe script will analyze trend around EMAs (configurable periods) and let you know when to short or long the market.
It will also tell you when there is a Overbought / Oversold Cross over Stochastic indicator
The script also includes a Ichimoku cloud so you can add this to your analysis for a trading action.
There will be more indicators coming into this script since im constantly working on Trading view scripts and analysing new strategys.
If you want access to it, contact me. (Its not free but also not expensive)
Best Regards.
