Cyatophilum Scalper [ALERTSETUP]This indicator comes with a backtest and alert version. This is the alert version. Its purpose is to create low timeframe and scalping strategies, by choosing from a list of built-in entry points which are described in detail below, and by configuring a risk management system to your liking.
Before diving into the entry points, I will explain the strategy and risk management settings.
These 3 settings allow to choose your strategy direction, and main behavior.
- Go Long ↗: activate or deactivate long entry points.
- Go Short ↘: activate or deactivate short entry points.
- Reversal strategy ↗↘↗↘: Activate this option will allow trades to reverse position from an opposite entry point. Keep it deactivated and trades will either wait a TakeProfit(TP) or StopLoss(SL) to be closed. When neither SL nor TP or set, this option is automatically activated.
StopLoss settings:
Both Long and Short SL can be activated and configured.
The base % price is the starting point of the stoploss, in a percentage of current price.
Trailing stop, when activated, works with 2 settings:
- % Price to Trigger: a percentage of current price the price should move in a bar to trigger a trailing movement.
- % Price Movement: the stoploss variation in a percentage of current price that moves on each bar.
TakeProfit settings:
Both Long and Short TP can be activated and configured.
The base % price is the value of the TP, in a percentage of current price.
Trailing Profit Deviation %: Percent deviation for the trailing take profit.
DCA:
DCA stands for Dollar Cost Average. The idea is to open additional orders from the base order so as to improve risk management.
These additional orders are also called Safety Orders. The indicator can handle up to 9 safety orders.
The strategy will exit either from a take profit based on percentage from base order or from a total volume percentage (Configurable in the parameters).
The steps spacing (space between each step) and safety orders volume (order size) can both scale by adding a scale multiplier.
By choosing from the base strategy dropdown menu, the indicator will generate entry points.
1. BUY SELL:
-> Low timeframes spot trading, with simple buy and sell orders.
How it works:
The indicator used is a combination of QQE (Atr based trend following indicator) and RMA 100 trendline.
I think the QQE does a great job in low timeframes because it is not impacted by the noise.
The RMA which is the moving average used in the RSI, will help giving confirmation to the entry points.
How to use:
It is meant to be used as a reversal strategy, but you can add a TP or SL if you want.
When comparing to Buy & Hold, make sure to deactivate the "Short results in the backtest" setting.
2. TREND SCALPING
-> A strategy for low timeframes trading.
How it works:
The strategy creates high volatility entries filtered by a duo convergence of adaptive trendlines (Adaptive HULL MA using the chart's resolution, Adaptive Tilson T3 using 1H resolution) and a higher timeframe (1H) RSI filter (long threshold: 70, short threshold: 40, RSI length: 10).
How to use:
Must be used on charts with a resolution smaller than 1H. Recommended: from 1m to 30m.
Must NOT be used as reversal strategy. Use it with a take profit and stop loss, and DCA if you can.
Sample risk management settings:
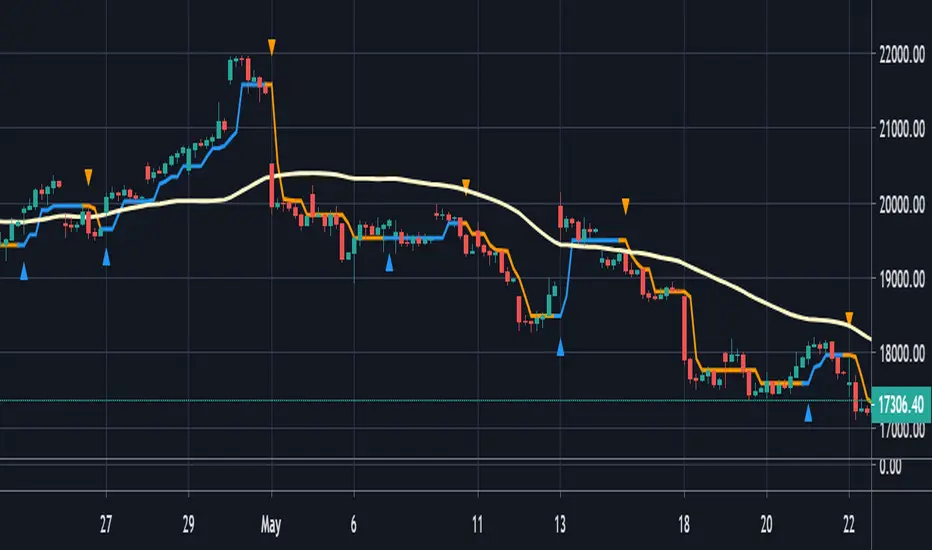
3. Support/Resistance BREAKOUTS
-> Trade low timeframes pivot points breakouts.
How it works:
The indicator calculates the 100 previous bars swing high and low. Any break above high or below low will trigger an entry point.
The entry is however filtered by an Adaptive Tilson T3 Trendline, an ADX 30 minimum threshold and a minimum average volume threshold.
How to use:
I recommend to click "Reversal" Strategy and set a Takeprofit target.
Find the best timeframe between 1m and 30m using the backtest version.
Example here with BTCUSDTPERP on 15m:
4. AGGRESSIVE SCALPING
-> Lots of trades in low timeframes.
How it works:
Created using Cyato AI, Higher/Lower Highs and Lows and 2 HULLMA crosses as entries, and 2 Adaptive Tilson T3 as trendfilter, a 25 ADX threshold filter and a volume filter.
How to use:
Recommended Risk Management settings: Takeprofit, Stoploss and DCA (Safety orders).
Find which timeframe work the best from 30 min and below. Should not be used above 30 min since this is the resolution for the MTF Tilson.
How to create Alerts:
Click Add alert, then select the indicator, and choose the alert for your order.
Most used alerts are "LONG ENTRY", "SHORT ENTRY" and "ALL EXITS".
You will find a description of each alert in the default alert message.
To gain access to this paid indicator, please use the link below.
Pesquisar nos scripts por "TRENDLINES"

Cyatophilum Scalper [BACKTEST]This indicator comes with a backtest and alert version. This is the backtest version. Its purpose is to create low timeframe and scalping strategies, by choosing from a list of built-in entry points which are described in detail below, and by configuring a risk management system to your liking.
Before diving into the entry points, I will explain the strategy and risk management settings.
These 3 settings allow to choose your strategy direction, and main behavior.
- Go Long ↗: activate or deactivate long entry points.
- Go Short ↘: activate or deactivate short entry points.
- Reversal strategy ↗↘↗↘: Activate this option will allow trades to reverse position from an opposite entry point. Keep it deactivated and trades will either wait a TakeProfit(TP) or StopLoss(SL) to be closed. When neither SL nor TP or set, this option is automatically activated.
StopLoss settings:
Both Long and Short SL can be activated and configured.
The base % price is the starting point of the stoploss, in a percentage of current price.
Trailing stop, when activated, works with 2 settings:
- % Price to Trigger: a percentage of current price the price should move in a bar to trigger a trailing movement.
- % Price Movement: the stoploss variation in a percentage of current price that moves on each bar.
TakeProfit settings:
Both Long and Short TP can be activated and configured.
The base % price is the value of the TP, in a percentage of current price.
Trailing Profit Deviation %: Percent deviation for the trailing take profit.
DCA:
DCA stands for Dollar Cost Average. The idea is to open additional orders from the base order so as to improve risk management.
These additional orders are also called Safety Orders. The indicator can handle up to 9 safety orders.
The strategy will exit either from a take profit based on percentage from base order or from a total volume percentage (Configurable in the parameters).
The steps spacing (space between each step) and safety orders volume (order size) can both scale by adding a scale multiplier.
By choosing from the base strategy dropdown menu, the indicator will generate entry points.
1. BUY SELL:
-> Low timeframes spot trading, with simple buy and sell orders.
How it works:
The indicator used is a combination of QQE (Atr based trend following indicator) and RMA 100 trendline.
I think the QQE does a great job in low timeframes because it is not impacted by the noise.
The RMA which is the moving average used in the RSI, will help giving confirmation to the entry points.
How to use:
It is meant to be used as a reversal strategy, but you can add a TP or SL if you want.
When comparing to Buy & Hold, make sure to deactivate the "Short results in the backtest" setting.
2. TREND SCALPING
-> A strategy for low timeframes trading.
How it works:
The strategy creates high volatility entries filtered by a duo convergence of adaptive trendlines (Adaptive HULL MA using the chart's resolution, Adaptive Tilson T3 using 1H resolution) and a higher timeframe (1H) RSI filter (long threshold: 70, short threshold: 40, RSI length: 10).
How to use:
Must be used on charts with a resolution smaller than 1H. Recommended: from 1m to 30m.
Must NOT be used as reversal strategy. Use it with a take profit and stop loss, and DCA if you can.
Sample risk management settings:
3. Support/Resistance BREAKOUTS
-> Trade low timeframes pivot points breakouts.
How it works:
The indicator calculates the 100 previous bars swing high and low. Any break above high or below low will trigger an entry point.
The entry is however filtered by an Adaptive Tilson T3 Trendline, an ADX 30 minimum threshold and a minimum average volume threshold.
How to use:
I recommend to click "Reversal" Strategy and set a Takeprofit target.
Find the best timeframe between 1m and 30m using the backtest version.
Example here with BTCUSDTPERP on 15m:
4. AGGRESSIVE SCALPING
-> Lots of trades in low timeframes.
How it works:
Created using Cyato AI, Higher/Lower Highs and Lows and 2 HULLMA crosses as entries, and 2 Adaptive Tilson T3 as trendfilter, a 25 ADX threshold filter and a volume filter.
How to use:
Recommended Risk Management settings: Takeprofit, Stoploss and DCA (Safety orders).
Find which timeframe work the best from 30 min and below. Should not be used above 30 min since this is the resolution for the MTF Tilson.
How to create Strategy Alerts:
Write your alert messages for EXIT, LONG and SHORT orders in the settings (Backtest section).
Then click add alert, and in the alert message, write the following:
{{strategy.order.alert_message}}
BACKTEST PARAMETERS
- Inital capital: 10 000$
- Base order size: 0.1 contract (0.1 btc)
- Safety order size: 0.1 contract (0.1 btc)
- Commission: 0.1%
- Slippage: 100 ticks
Oldest trade: 2020-08-31
Backtest Period: From 2020-08-31 to 2020-11-12
Configuration used: see the live chart configuration panel at the top.
To gain access to this paid indicator, please use the link below.

Aggregate BTC CandlesThis script creates candles based on an aggregated Index price from various BTC exchange tickers. Since the early years in particular have a lot of exchange specific flash crash wicks, missing data, erraticness compared to other exchanges particularly in their first few months, this is an attempt to clean up the price history, be it for TA (trendlines, S/R etc.) or use in algos or other indicators, without reliance on one exchange. It uses the new Array functionality to generate median and averages, and is entirely original work.

RedOBVOBV where you can choose a specific timeframe. Also I duplicated it, so now it could be easier to draw trendlines if you pick dots and line.
The main idea is to spot divergence between the price and OBV. Big buys or sells could be well camouflaged on the 4H 1D candles, but it's much harder to hide something on 1-5 min timeframes.

Responsive Linear Regression ChannelsThis is a linear trend indicator that can:
- automagically adjust to different chart resolutions
- snap to day/session boundaries on intraday
- totally not do the above and use ye olde good fixed lookback window
- show the regression trend and its RMSE channels
- disregard the trend and just show the period average and standard deviation lines (often acting as support and resistance)
The main idea was to allow you to quickly view linear trends for different time periods without having to calculate the required amount of bars.
By default, you will be able to quickly switch between 1-3 months, 6 months, 1 year, 2 years and 5 years of data, as well as various daily lookback periods.
Please adjust resolution settings to your liking.
Caveats:
- More data means more noise and slower calculations.
- HLC3 source is recommended, especially at resolutions above hourly.
- Trend will be slightly different if you use extended hours.
- If you use extended hours and don't have a data subscription, trend will be SUBSTANTIALLY different, especially at smaller resolutions like 1m.
- You might want to use 3.5 days per week for crypto (it's 7 days by default).
Known problems:
- If you can't see the trendlines, scroll to the left or zoom out - the origin could be outside of your viewport.
- Futures' sessions start on the previous day. We currently snap only to day boundaries, not session breaks.
- UVXY and the like that have extremely high price datapoints. The calculations will be wrong on some resolutions.
- Replay can freeze circa bar_index 244 — disable smart lookback and keep your window under 240 bars if you encounter this.
ACKNOWLEDGEMENTS:
Many thanks to alexgrover for his extremely efficient functions (used with permission)

Noro's Trendlines IndicatorTo create the script I used the LonesomeTheBlue code. Thank him for his code.
The indicator shows trend lines. Up to three support lines (red) and up to three resistance lines (lime). There can be up to 6 lines at a time. However, most often there will be from 0 to 1 line. Trend lines may be extended to the right. For this purpose there is a checkbox in the setting. This is the way you may adjust line thickness.
For example, how to use
The indicator shows you the support line (red) and the resistance line (lime). If the line is crossed, the price may move a lot towards the breakout.
In a few days.

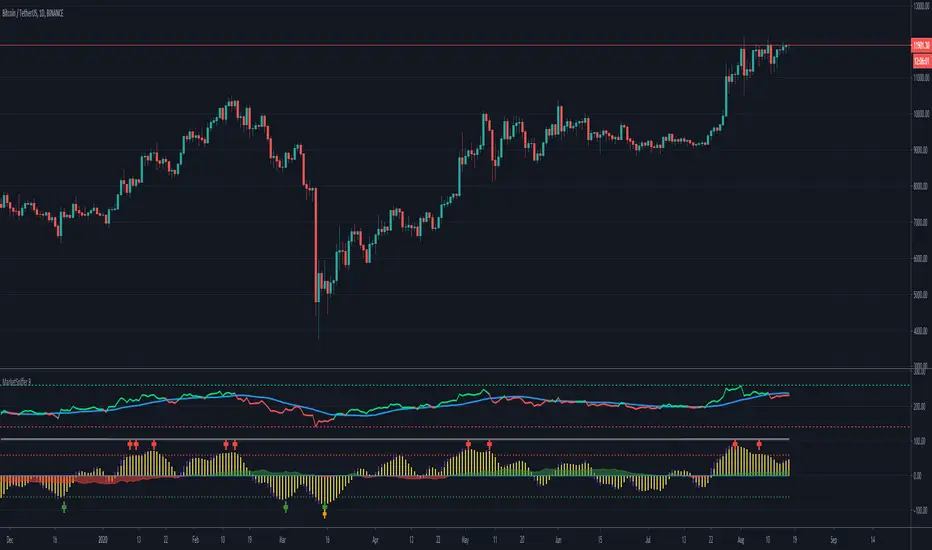
MarketSniffer BMarketSniffer B is a custom made indicator made by 2 friends that combined 2 strategies to make 1 indicator. It can detect good moments to buy and sell based on our strategy.
The indicator gives the same signals als marketsniffer A but has a diffrent way of showing it by using a histogram to make the momentum more clear when a buy / sell signal will be printed.
Marketsniffer B can be used in any market since its for a big part based on momentum. Although we recommend using it in the crypto market since it was tested and mainly made for crypto.
How to use it: MarketSniffer B can be used in many ways, own strategies can be made.
Example strategy: Lower timeframes (anything below the 1d) if the price is trading above the yellow 200 EMA, take the buy signals. If its trading below the 200 ema and you see a sell signal then sell / short
Example strategy: Higher timeframes (anything above the 1d) Any timeframe above the 1d, the 200 ema rule doesn't exist. Any buy signals should be good for taking a spot position. The sell signals therfore are NOT short signals but sell signals. Its just points to take profit from the buy signal.
Example strategy: Divergences and trendlines can be drawn on the waves as strategy. This indicator also had a RSI with EMA that can be used for this.
Its recommended to use the small timeframe signals (anything below 1d) for leverage trading. Any signals above 1day timeframe should be spot trading.
This indicator should be used in combination with MarketSniffer A
Use the link on our profile to get acces to this indicator.
sDEFI Synthetix ExchangeTradingView allows combining/summing up to a maximum of only 10 tickers in its search field. Their support staff suggested I could combine up to 40 by using Pine Script, so here it is, for a specific 'basket' of crypto tokens.
This study displays the combination of price history for Synthetix Exchange’s sDEFI index.
Tokens included in the index are COMP, MKR, KNC, SNX, ZRX, REP, LEND, REN, LRC, BNT, BAL and UMA. You will see the prices only go back as far as July 31st 2020, which is when the most recent of the compilation (UMA) started its trading history on TradingView. (The study can only display prices for days that *all* the tickers were trading.)
The price history will display as a study, below an existing chart. You will need to resize the windows, to see this study at a larger size. (Grab the window border and move it up, once you have added this study to a chart)
Unfortunately you will not be able to interact with it like a normal chart, i.e. drawing trendlines, adding moving averages, notes or annotations, etc.
May I suggest you send a support request to TradingView, asking for them to allow us to enter more than 10 (perhaps up to 40) tickers with + symbol between them, in the search field, which gives a ‘proper’ chart to analyse?
Please note that when publishing this script, I was required to choose a category from a list that does not contain a relevant category. Given that I had to choose something from the list to proceed, I used 'Support and Resistance', since chartists can see S and R levels by looking at this study.
I trust this study is useful for you sDEFI traders.

Scrip Drip v317 (by faken)This Script Is a combination of Moving Averages and Macd.
The green circles show when the pinbar is above the moving average and has a positive macd, and red circles are the opposite.
The upwards/downwards triangles are shown when a candle is on both sides of the ma line, which can indicate a break.
Make sure to watch for a confirmation candle after one of these breaks to make sure it is not a fakeout.
This works well for stocks and crypto, but the timeframes I would recommend are 2/4h for crypto and 1h or lower for stocks, as stocks have more definitive trendlines compared to crypto.
I am still developing it heavily, to find the best entry and exit points.
Thanks for support.

Two Fractals TrendlinesThis study draws a trend line for the last two Bill Williams up-fractals and down-fractals.
Trend line break signals and alerts can optionally be added.

[KY]McClellan Summation Index RSIThis script contains McClellan Summation Index(MSI) and McClellan Oscillator(MO)
(1) What is McClellan Summation Index(MSI)
McClellan Summation Index(MSI) is a breadth indicator derived the McClellan Oscillator(MO),
which is a breadth indicator based on Net Advances (advancing issues less declining issues).
The Summation Index is simply a running total of the McClellan Oscillator values.
To identify the market direction, I prefer to use the relative strength(RSI) of MSI rather than MSI itself
because MSI is a summation so it's difficult to compare with previous market patterns. So I use RSI applied MSI.
Reference: Stockcharts.com has a nice set of detailed explanation about MSI.
school.stockcharts.com
(2) How to use this script
- Add this script to your chart.
- You can choose one of two options ("MSI RSI" or "MO").
- You can also choose the market from three options ("Nasdaq", "NYSE", "Nasdaq+NYSE")
(3) "MSI RSI" or "MO"
a) "MSI RSI"
For swing trade(sevelal weeks), MSI RSI is much better to identify the broad market direction.
I backtested last several years of S&P500. The result was not symmetrical between MT bear/bull market.
For bull side, when MSI RSI curls up from the bottom(e.g. RSI 30 level), 90% of times out of them the market rallied.
For bear side, when MSI RSI rolles over to downside from the top(e.g. RSI 70 level), only 60% of times out of them the market declined.
So the market tends to hit negatively diverrgent high from advancing/declining issues perspective. Be careful to use MSI oscilator.
b) "MO"
For short term trade(intraday, 2-3 days of holding), MO is better because MSI is a summation so lags several days. MO is quick.
MO is sometimes very noisy, so you need to draw trendlines or horizontal levels to compare with the previous cases.
For beginners, I recommend to use "MSI RSI".

Fractal Series History SummaryThis script presents a summarized view of a series by drawing lines between series samples taken at power-of-two intervals from the current value.
The intent is to provide a visualization of trendlines at multiple scales, without having to untangle those that my overlap each other.
It doesn't overlay a price-chart as written; it could, but IMHO that would be redundant. It's intended to augment oscillators and other kinds of indicators that don't necessarily scale with a price chart.
The script does not attempt to provide buy or sell triggers, but rather, to provide a visualization tool and a line-drawing tech-demo.

Fibonacci EMA TrendlinesSimple EMAs based on the Fibs plus the 200 EMA - Default inputs are 8,13, 21, 55, 200. Inspired by Philakones EMAs.

Easy Loot Money MakerEasy Loot Money Maker Script
This indicator uses modified Bollinger Bands & Ichimoku Clouds to generate the best opportunities to buy & sell
Works best on lower timeframes, so if you're a day trader or scalper, this indicator is for you
I recommend using anywhere from 5 minute, 15 minute, 1 hour, to 2 hour timeframe to give you the best opportunities on entry & exit price
Obviously mix in your own technical analysis such as support, resistance, and trendlines in addition to using this indicator to make a decision on whether to buy or sell.
This chart here looking at the 1H chart of S&P500 (SPX), you can clearly see that the indicator called the top as well as these miniature swing highs and lows.
To add this indicator to your chart, simply press the 'like' button and it will be added to your favorites under the 'Indicators' tab at the top of your chart.
Please let me know if you have any questions or concerns regarding this indicator, as well as feedback on using it whilst trading.
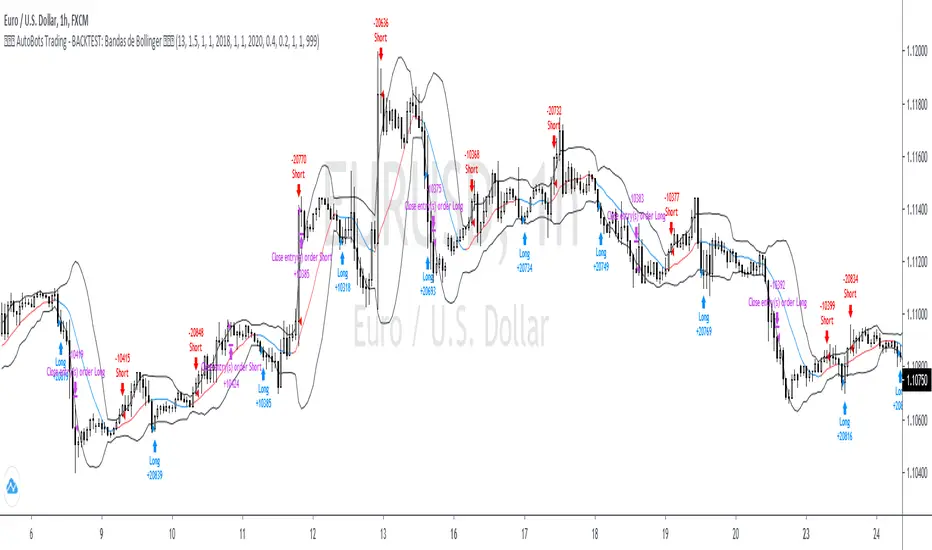
4. AutoBots Trading - BACKTEST: Bollinger BandsBACKTEST: Bollinger Bands
1. Description: a technical analysis tool defined by a set of trendlines plotted two standard deviations (positively and negatively) away from a simple moving average ( SMA ) of a security's price, but which can be adjusted to user preferences.
2. Strategy rules: defined based on the component, signal count, entry prices, open order count, position check, position averages, conditional closes and close signals.
3. Risk management: system was defined based on the choice of only long, only short or both sides. Defining the choice of take profit, stop loss and trailing stos (no repaint).
4. Symbol: EURUSD (only)
5. Suggested Timeframe: 1H
6. Parameter for optimization: 13, 1.5, side: both, tp: 0.4%, sl: 0.2%, ts: na
7. Walk forward simulation
7.1. In sample period: jan/2018-jan/2020
7.2. Out of sample period: jan/2020 - ago/2020
** For purpose educate only
Market Sniper - Trading/Scalping SuiteWelcome to Market Sniper.
Market sniper is meant to be a suite for trading/scalping alongside my indicators script, RSI, Stochastic and Horizontals.
It is based on over 15 Indicators/Oscillators so there is no need for convoluted charts and constantly changing charts/indicators for a better understanding of the market.
Warnings:
I can't stress this enough! This isn't a magic pill that will transform your illiterate grandmother into an expert trader! This is a very powerful tool whose function is to complement your trading/save time (and yes, with practice be your main trading tool).
This algorithm requires setting up and training to be used correctly, please do not expect to load it up and immediately be scalping the 1s charts.
This algorithm is heavy and might require constant refreshes of the browser on slower computers.
Labels overlap at the moment, working on this part at the moment. So, always zoom in before doing a trade / change the "+- signals in settings"
Candlestick patterns need tweaking, I personally have it off and use my own judgement atm.
What it includes:
Trend reversal / continuation (Macd, Stochastics, money flow , CCI , momentum, DIOSC (automatic trendlines ), SuperTrend, Moving averages, etc, etc.)
RSI divergence drive / drive counter (base code from Libertus, check his profile as he has very helpful scripts)
Bull Market expansions for longterm take profit and increasing position
Candlestick patterns
Trend reversal / Continuation
Green = Bullish reversal
Red = Bearish trend reversal
Orange = Trend continuation / strengthening
Trend Continuation/Strengthening
A warning here, trend strengthening also means that many times the indicators are overextended or close to it
------
The numbers reflect the amount of indicators that are signaling a reversal over the specified period on the settings.
For higher timeframes this setting should be on a lower value and the opposite for lower timeframes.
This works on every market and every timeframe(according to months of my own paper and real trading). Remember that each market/asset/commodity has different soft spots so tweaking, backtesting and present accuracy review should be of maximum priority.
Bull Market expansion phase
Warning:
The indicator purposely does not show any signals during bear markets. It is my opinion bear markets complexity render this tool close to useless.
It was designed to be used in higher timeframes, tough it SEEMS to have a good track record / be useful in lower timeframes.
it will ALWAYS give a fake signal at the end of a bull market because of the very nature of the code.
It is based of EMAs, RSI and Stochastic
Candlestick Patterns
Bullish candlestick patterns:
Hammer
Inverted Hammer
Dragonfly
Gravestone
Bearish candlestick pattern:
Shooting Star
Hanging Man
Gravestone
Dragonfly
RSI divergence drive
- Credit to Libertus for the base code of this section
The green triangle means there are at least 2 drives of valid divergence, yellow for 3 and red for 4+.
The script shows triangles when confirmation candle closes.
You need to know how divergence works to use this section. investopedia can easily get you there.
For cryptos I use 2-4h+ timeframes, for traditional markets I use 15min+ for forex I use it basically in every timeframe.
For questions/suggestions and access PM me in the platform itself and don't forget -> FEEDBACK IS IMPORTANT
Thank you all

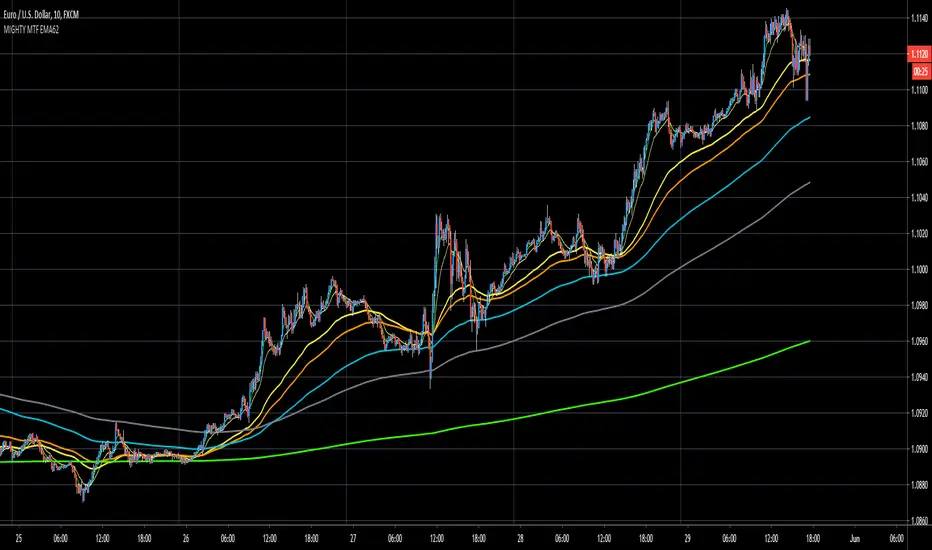
MIGHTY MTF EMA62EMA62 comes from Rob Booker trend trading system.
I do now own this, nor do I claim or charge money for this system.
More information about this system can be found on: www.robbooker.com
What I did:
1. hard coded all multi timeframe ema62.
2. using colorcoding for each timeframe:
EMA62 MTF (minutes)
1M = white
5M = purple
10M = yellow
15M = orange
30M = aqua
1H = gray
4H = green
8H = yellow
Daily = red
Note:
I've only tested this on Forex, I dont have experience with stocks-crypto.
Note:
This system is used to gauge Daily trend, intraday trend.
Strongly recommend to use it with other confirmation like support/resistance lines, trendlines, pitchforks, momentum oscillators.
Note:
Strongly recommend to read PDF if you want to trade this as stand alone.
Note:
Strongly recommend to use MTF analysis for better entries and understanding of higher timeframe trends.
Note:
When multiple ema62 are on top of eachother then we have no trend, suggesting consolidating market.
This occurs often at major support/resistance lines, Wedges, momentum oscillators OB/OS.
When multiple ema62 are opening up (upwards/downwards) then there's a suggestion of a trending market
VLM SpikeFeeling tired and just took a week break away from the busy and tough life. 🎊
Nothing special to mention today, just post a script I coded long time ago when I studied volume.
People always underestimate the importance of volume while drawing tons of trendlines on their charts .
A volume spike is a key to trading because it can tell us three messages, including the top, the bottom and the breakout.
Using Bollinger Band as a proxy, we can always spot two scenarios.
One ,when volume is declining below 1/2 SD of its average, price tends to move in one direction. But unusual volume above 1/2 SD of its average can reverse the original trend.
Hope u find it helpful and don't forget to follow my little account!!😄

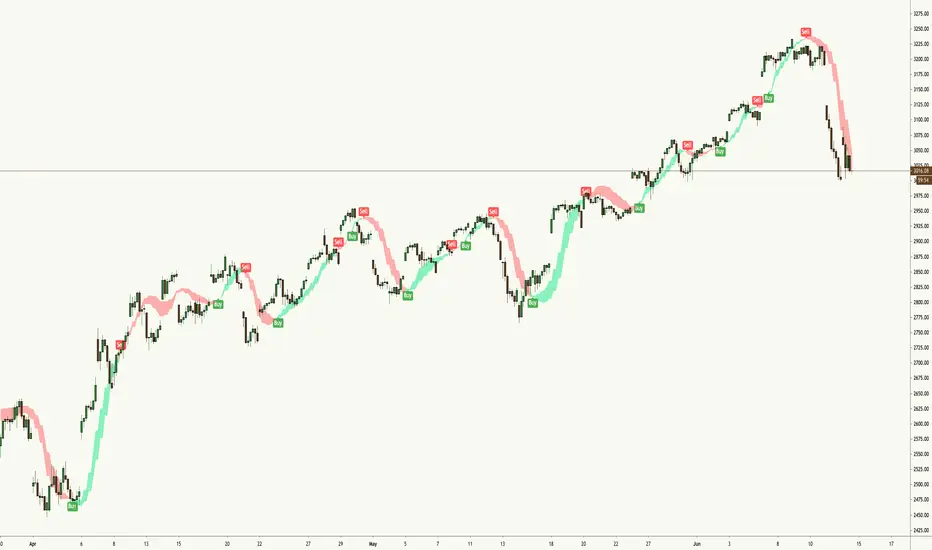
Xtreme TrendDisclaimer: This base Script is derived and tweaked from Half Trend. But unlike halftrend, it doesn't repaint and signals come at different logic.
Background:
I was using this script and trading with this for a while. Few weeks back I had come across a similar Script being sold as premium in Tradingview for $100 per month. The seller has a lots of videos in youtube and claims that he has created this script by investing lakhs and it also takes consideration of price action !!! . No doubt he is a successful trader but if you watch his other videos you will realize that he trades with S/R, trendlines and price action. He speaks quite well, and the morphed videos give impressions that all his profits are from using this indicator. I fell for it, but then after using for a few days I had realized that both the indicators are almost same, but giving signals at different time. When I edited my indicator for a few settings, it appeared that now signals are also coming exactly at same point. I never wanted to publish this script, but this person was going on and on fooling people. So, I have decided to publish it here, as a protected code. Again this is no holy grail. Works well in trending market and hell in sideways.
How to Use:
PLEASE WAIT TILL CANDLE CLOSE, take entry in the beginning of next candle. Time frame: 5 mins for index, 15 mins - 30 mins for stocks
Add 200 EMA over it ( Personally I love using 50 MA) and buy when signal and price both are on same side. Example, buy when there is buy signal + price is above 200 EMA
Sell: When price is below 200 EMA and there is a sell signal on the indicator.
Seems better when you mix it with pivots, S/R etc.
please comment, if you find this useful.
BTC Fibonacci DMA350 TrendlinesAdapted from Tim Graham's Code.
See Original Inspiring Article from Phillip Swift at: @positivecrypto
When looking into BITSTAMP:BTCUSD 1D data in spreadsheet. Historically, BTC Highs Hit (Simple Daily Moving Average 350 Days) DMA350 in reverse Fibonacci Sequence Order
2013 Hit DMA350*8 before All Time High (ATH)
2017 Hit DMA350*5 before ATH
I expect 2021 to hit DMA350*3 ATH. When BTC hits DMA350*3 ATH, I suggest selling!

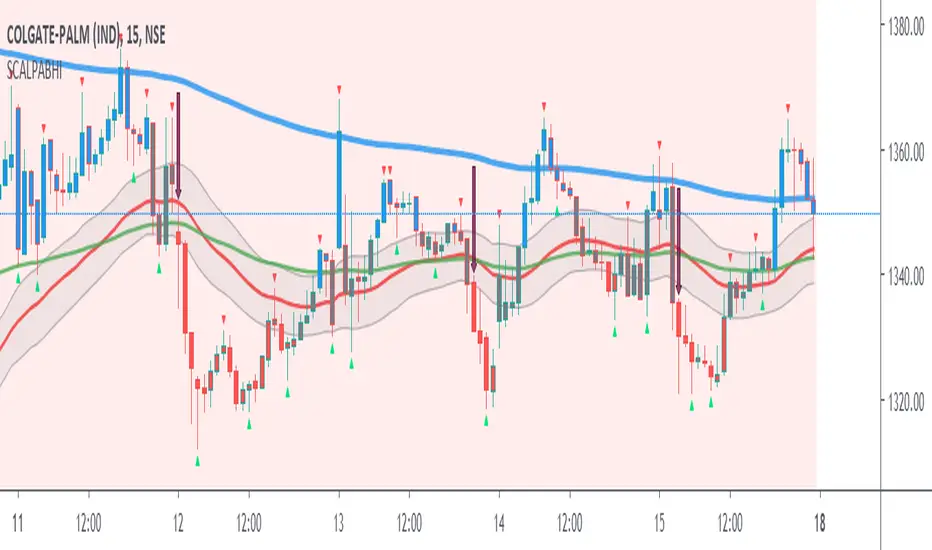
Scalping PullBack by AbhiSetup and hints:
When price is above the PAC(blue bars) we are only looking to buy as price comes back to the PAC, when price is below the PAC(red bars), we are only looking to sell when price comes back to the PAC
What we’re looking for when price comes back into the PAC we draw mini Trendlines (TL) utilising the Fractals and HH/LL points to guide your TL drawing.
Now look for the trend to pull back and break the drawn mini TL. That's is where we can place the scalp trade.
So we are looking for continuation signals in terms of a strong, momentum driven pullbacks of the PAC EMA(34).
The other EMAs are there to check for other Pullbacks when PAC EMA (34) is broken.
Other than the "SweetSpot Gold RN" indicator, you should not need any other indicator to scalp for pullbacks.
If you want to trade shallower Pullbacks for quicker scalps, try reducing the PAC and EMA combination lengths for example:
- 21 PAC and 55, 144, 377 for fast, medium, slow EMAs
- 13 PAC and 34, 89, 233 for fast, medium, slow EMAs
Each alert should be evaluated on it's own merits, the alerts are designed to highlight possible scalping trades from Pullback recoveries around the PAC.
Relative StrengthThis indicator is called Relative Strength and is no way related to RSI ( Relative strength indicator).
It is simply a ratio of asset A to asset B plotted. Usually it is used to look for strength vs a particular index. Since it is a ratio, all the trendlines work on it. The default index is NIFTY. You can change it any index/script you want to compare:
1. Script vs Index
2. Index vs Index

SpiralGrinder Ultimate Trading System SpiralGrinder Ultimate Trading System
SpiralGrinder Ultimate (SGU) is a unique type of Trading System dedicated for leverage-trading BTC on Bitmex platform. Since it's highly customized to give statistically reliable signals based exclusively on BTC/USD Perpetual Swaps BITMEX chart BITMEX:XBTUSD , using it with other BTC charts will give usable, but less reliable signals!
SpiralGrinder’s Ultimate first iteration was SpiralSwinger V1 indicator released in march 2019, since then much has been changed, different algos were developed and then thrown into the bin, until after 6 months of intensive work current version was developed, backtested on XBT/USD Perpetual Inverse Swap Contract chart from Bitmex exchange on whole chart history from late 2015 until January 2020, on these timeframes – 1d, 12h, 8h, 6h, 4h, 3h, 2h, 90m, 1h.
Indicator algo is based on idea of price being a so called "fractal" - when same price action patterns occur over and over from time to time on different timeframes be it 1D, 4h, 1h or even 15m! Every time a particular timeframe (TF) has suitable volatility and price action is exhibiting wave structure with distinct highs and lows there will be a situations when high probability trade setups are possible. To predict those recurrent situations SGU tracks more than 30 parameters (godmode oscillator and some it’s experimental derivatives, historical volatility coefficients, some time-based variables, ATR-based Trend lines, regular divergences… etc) comparing them against each other, so when “all stars are aligned” based on statistical model built into its algo and when price has enough potential to move in particular direction reaching some measured move target a SIGNAL to enter position is generated.
Theoretical True Winrate of this indicator is around 60%, while practical is somewhat under 50%. True Winrate is a percentage of trades that reached PREDICTED target be it 1R or 20R prediction, instead of just being a common winrate (used by most traders) - percentage of all profitable trades even though many of them didn’t reach initially predicted targets. True WinRate is tied to a signal generating algo implemented in SGU and cannot be changed unless a new more sophisticated algo is found by the developer of this indicator and is implemented in future updates!
Main User Interface of SGU consists of many elements that are developed to help manage trades more efficiently without any emotional impact on decision making process. Apart from obvious Long/Short signals there are also predicted targets that should be hit with some probability for every given signal, suggested stop loss levels corresponding to predicted RR. There are 4 ATR-based trendlines that help determine trend bias on current timeframe and to set intermediate take profit points on the way toward target, also there are indicators of regular divergences to show us weakness during uptrends and downtrends, also there are special warnings included when price closes behind particularly important ATR line with strength enough to continue further it’s movement in initial direction. Also there are 2 candle color-based systems available: one of monitoring how overbought or oversold is price on current TF, second is created to tell us overall trend sentiment - how strong is movement of price in particular direction.
Since price could move in the same fashion during prolonged periods of time there could be a particular TF when signals will be absent till price volatility and oscillator readings doesn’t change its character and become favorable (become synchronized with price action) for signals to be generated. That’s why this indicator should be monitored on multiple TFs at once – you’ll never know on which TF next signal will appear. There will be a multiple signals going on parallel at the SAME TIME, simultaneously in DIFFERENT DIRECTIONS: for example swing long trade based on signal from 12h TF, while having a scalp short at the same time based on 1h chart. Exploring this kind of optimized multi-tasking could be done only by splitting bankroll on multiple accounts registered on Bitmex platform.
Suggested timeframes to monitor for potential signals are empirically chosen that their round multiples should give 24H or 1440m=(24h x 60m) : 12h x 2 = 24h, 3h x 8 = 24h, 144m x 10 = 1440m=24h.
Therefore main timeframes are: 1D, 12h, 8h, 6h, 4h, 3h, 2h, 90m and 1h.
Additional timeframes to watch are: 288m, 144m, and 72m.
Timeframes under 1h aren’t tested yet, but could be traded with additional caution: 45m, 36m and 30m.
To track effectively all signals generated by SGU one should have at least PRO subscription plan paid on TradingView as this allows to use non-standard timeframes and maximum of 10 server-side alerts on price/indicators necessary to work with this indicator.
To do in near future: add volume weighted macd with custom settings as an additional confluence in algo to increase average win rate of signals.
Attention! Past performance of this indicator is not indicative of future results!
For those interested to dig deeper into logic behind using SGU a full 20-page pdf user manual is available for download here: drive.google.com
To gain free test access just write me a DM.
