Trendline Breakouts With Volume Strength [TradeDots]Trendline Breakouts With Volume Strength is an innovative indicator designed to identify potential market turning points using pivot-based trendline detection and volume confirmation. By merging dynamic trendline analysis with multi-tiered volume filters, this tool helps traders quickly spot breakouts or breakdowns that may signal significant shifts in price action.
📝 HOW IT WORKS
1. Pivot-Based Trendline Detection
The script automatically scans for recent pivot highs and lows over a user-defined lookback period.
When it finds higher pivot lows, it plots green uptrend lines; when it finds lower pivot highs, it plots red downtrend lines.
These dynamic lines update as new pivots form, providing continuously refreshed trend guidance.
2. Volume Ratio Analysis
A moving average of volume is compared against the current bar’s volume to calculate a ratio (e.g., 1.5×, 2×).
Higher ratios suggest above-average volume, often interpreted as stronger participation.
The script applies color-coded cues to highlight the intensity of volume surges.
3. Breakout & Breakdown Detection
Each trendline is monitored for a defined “break threshold,” which helps avoid minor penetrations that can trigger premature signals.
When price closes beyond a threshold below an uptrend line, the indicator labels it a “BREAKDOWN.” If it closes above a threshold on a downtrend line, it labels it a “BREAKOUT.”
Volume surges accompanying these breaks are highlighted with contextual emojis and distinct color gradients for quick visual reference.
4. Trend Direction Table
A small on-chart table provides a snapshot of the current market trend—Uptrend, Downtrend, or Sideways—based on a simple moving average slope and the number of active uptrend or downtrend lines.
This table also displays quick stats on how many lines are actively tracked, helping traders assess the broader market posture at a glance.
🛠️ HOW TO USE
1. Choose a Timeframe
This script works on multiple timeframes. Intraday traders can monitor minute or hourly charts for frequent pivot updates, while swing and position traders may prefer daily or weekly intervals to reduce noise.
2. Observe Trendlines & Labels
Watch for newly drawn green/red lines connecting pivots.
When you see a “BREAKOUT” or “BREAKDOWN” label, confirm whether volume was abnormally high based on the ratio or color-coded bars.
3. Consult the Trend Table
Use the table in the bottom-right corner to quickly check if the market is trending or range-bound.
Look at the count of active uptrend vs. downtrend lines to gauge broader sentiment.
4. Employ Additional Analysis
Combine these signals with other tools (e.g., candlestick patterns, oscillators, or fundamental analysis).
Validate potential breakouts using standard techniques like retests or support/resistance checks.
❗️LIMITATIONS
Delayed Pivots: Trendlines only adjust once new pivot highs or lows form, which can introduce a slight lag in highly volatile environments.
Choppy Markets: Rapid, back-and-forth price moves may produce conflicting trendline signals and frequent breakouts/breakdowns.
Volume Data Reliability: Gaps in volume data or unusual market conditions (holidays, low-liquidity sessions) can skew ratio readings.
RISK DISCLAIMER
Trading any financial instrument involves substantial risk, and this indicator does not guarantee profits or prevent losses. All signals and visual cues are for educational and informational purposes only; past performance does not assure future outcomes. You retain full responsibility for your trading decisions, including proper risk management, position sizing, and the use of additional confirmation methods. Always consider the possibility of losing some or all of your original investment.
Pesquisar nos scripts por "TRENDLINES"

Indicator: Volatility Candle Based 📊 Volatility Candle-Based Indicator (Pine Script v6)
This custom TradingView indicator is designed for futures traders who want to analyze volatility, candle patterns, and support/resistance zones within specific market hours. It overlays price charts and provides visual signals that help determine potential momentum shifts, trend continuations, or reversals.
🔧 Core Features
⏰ Futures Time Filter
The indicator activates only during specific trading hours, customized per futures contract (e.g., NQ, ES, GC).
Time is adjusted to the New York (EST) timezone.
This ensures the logic only runs during relevant futures market sessions.
💹 Contract-Specific Multipliers
Applies custom point multipliers for futures contracts (e.g., GC = 30, ES = 24).
Supports three types of multipliers:
Trailing Stop
Trailing Plot Stop
Stop Loss
Ensures accurate backtesting and risk modeling for each contract.
📈 Trendline Support & Resistance
Uses pivot high/low logic to dynamically plot:
Central pivot zones
Step-like support/resistance lines
These trendlines update based on price behavior and can indicate bullish or bearish control.
🔍 Candle Momentum Analysis
Evaluates each candle's:
Body-to-range ratio (e.g., Marubozu, Doji)
Shadow dominance (upper/lower wicks)
Detects important reversal or continuation patterns such as:
Bullish/Bearish Inside Candles
Doji Star formations
Uses a custom moving average to confirm directional bias.
🕯️ Plotter Candle Signals
Identifies BullishPlotter and BearishPlotter candles:
Highlights candles likely to signal upcoming momentum.
Also accounts for neutral signals when no clear bias is detected.
Tracks the high/low of recent signal candles for reference.
📌 Visual Elements (not shown in snippet but implied by logic)
Signal arrows, dashed current levels, and filled support/resistance zones can be plotted to provide real-time feedback.
These are useful for both manual trading and strategy development.
🎯 Use Case
Perfect for intraday or short-term futures traders on instruments like:
🟡 Gold (GC), 🟠 Silver (SI)
📉 Nasdaq (NQ/MNQ), S&P 500 (ES/MES)
This script provides both structural context (trendlines, pivots) and price action signals (candle formations, momentum shifts), helping traders align their decisions with the underlying market flow.

Multi-Period ChartsThis Pine Script v6 indicator is titled "Multi-Period Charts" and is designed to provide traders with dynamic support/resistance levels, momentum-based trendlines, and shaded areas representing higher timeframes—all layered over the current chart to offer multi-timeframe market context.
🔍 Overview
The script offers a comprehensive view of market structure, combining:
Pivot-based support and resistance
Momentum-driven trendlines
MACD-style candle coloring
Higher-timeframe box overlays
Each element is modular and can be customized through inputs for different strategies and timeframes.
🧱 Key Features
1. Pivot-Based Support & Resistance Lines
Uses ta.pivothigh and ta.pivotlow to detect significant swing highs/lows.
A dynamic centerline is calculated from recent pivots.
Generates TUp and TDown bands that evolve with price action.
Determines the trend direction based on whether the price is above or below these bands.
2. Trendline Signal Support
Based on moving averages of high/low and close prices across a long period.
Draws a support line with a slope-check to determine if the market is bullish or bearish.
Support lines are color-coded to reflect the directional bias (bullish, bearish, or neutral).
3. Candle Coloring Logic
Candles are categorized into:
LongCandles (above both trend and support lines)
ShortCandles (below both lines)
NeutralCandle (between them)
Candles can also be shaded differently when they are downward candles, even within a bullish setup.
4. Multi-Timeframe Box Overlays
Automatically selects a higher timeframe (HTF) based on the current chart.
Draws boxes that represent the range of the selected HTF bar (e.g., day, week, month).
Boxes are colored based on whether price closed up or down.
Supports multiple methods to determine the top/bottom of the box:
High/Low Range (HLR)
True Range (TR)
Heikin Ashi Range (HAR)
5. Period Line
Calculates a smoothed line from the average of each HTF box’s top/bottom.
Useful for identifying long-term trend alignment.
⚙️ Inputs & Customizations
Pivot settings: Number of bars to look back and forward, factor, and spread.
Trendline settings: Moving average lengths and slope sensitivity.
HTF box settings: Resolution (manual or auto), color options, calculation method.
📈 Visual Output
Trendline and support line (optional display).
HTF range boxes (highlighting bullish or bearish sessions).
Color-coded candles indicating alignment or divergence from trend.
Invisible PeriodLine for advanced strategy developers.
💡 Use Case
This indicator is ideal for:
Swing and intraday traders who want to trade in the direction of larger trends.
Traders who rely on multi-timeframe analysis to find confluence.
Users looking to combine price structure (pivot-based) and momentum (moving average-based) for trend validation.

The Traders Support & Resistance LevelsThis script automatically detects pivot-based support and resistance levels and draws dynamic trendlines based on recent price action.
🔹 Support & Resistance Levels
Pivot points are calculated using customizable left/right bar logic. A pivot high (or low) is confirmed when leftBars candles to the left and rightBars candles to the right are lower (or higher).
Triangles are plotted when a level is confirmed:
🔻 🟡 Yellow Down Triangle = Confirmed Resistance
🔺 🟣 Purple Up Triangle = Confirmed Support
Lines are drawn at confirmed levels.
If enough lines are confirmed, the oldest one is converted into a zone using a thick, semi-transparent line.
🔹 Trendline Logic
Trendlines are drawn between the last two support points (for uptrend) and last two resistance points (for downtrend).
The slope and price relationship determine trend strength, visualized by color:
Condition Color Meaning
Uptrend + Price Above + Steep 🟨 Yellow Strong Uptrend
Uptrend + Price Above 🔷 Blue Weak Uptrend
Downtrend + Price Below + Steep 💗 Fuchsia Strong Downtrend
Downtrend + Price Below 🟣 Purple Weak Downtrend
Otherwise ⚪️ Gray Neutral / No Trend
⚙️ Customizable Inputs
leftBars, rightBars: Adjust sensitivity of pivot detection
previewBars: Show early "draft" lines before confirmation
volumeThresh: Reserved for future enhancements

PowerHouse SwiftEdge AI v2.10 with Custom Filters & AI AnalysisPowerHouse SwiftEdge AI v2.10 with Custom Filters & AI Analysis
Overview
PowerHouse SwiftEdge AI v2.10 is an advanced TradingView Pine Script indicator designed to identify high-probability trading setups by combining pivot-based structure analysis, multi-timeframe trend detection, and adaptive AI-driven signal filtering. The script integrates Change of Character (CHoCH) and Break of Structure (BOS) signals with customizable momentum, volume, breakout, and trend filters to enhance trade precision. Additionally, it offers an optional AI Market Analysis module that predicts future price trends across multiple timeframes, providing traders with a comprehensive market outlook.
The script is highly customizable, allowing users to tailor inputs to their trading style, whether for scalping, swing trading, or long-term strategies. It is suitable for all asset classes, including stocks, forex, crypto, and commodities, and performs optimally on timeframes ranging from 1-minute to daily charts.
Key Features
Pivot-Based Signal Generation:
Identifies pivot highs and lows to detect CHoCH (reversal patterns) and BOS (continuation patterns).
Signals are plotted as "Buy" or "Sell" labels with optional "Get Ready" pre-signals to prepare traders for potential setups.
Take-profit (TP) levels are automatically calculated based on user-defined points, with optional TP box visualization.
Multi-Timeframe Trend Analysis:
Analyzes trends across seven timeframes (1M, 5M, 15M, 30M, 1H, 4H, D) using EMA and VWAP to determine bullish, bearish, or neutral conditions.
Displays a futuristic AI-Trend Matrix dashboard showing trend direction, strength, and confidence levels for quick decision-making.
Customizable Signal Filters:
Momentum Filter: Ensures signals align with significant price changes, adjusted dynamically using ATR-based volatility.
Higher Timeframe Trend Filter: Requires signals to align with the trend of a user-selected higher timeframe (e.g., 1H).
Lower Timeframe Trend Filter: Prevents signals that conflict with the trend of a user-selected lower timeframe (e.g., 5M).
Volume Filter: Optionally requires above-average volume to confirm signals.
Breakout Filter: Optionally requires price to break previous highs/lows for signal validation.
Repeated Signal Restriction: Prevents consecutive signals in the same trend direction until the trend changes on a user-defined timeframe.
AI-Driven Adaptivity:
Incorporates Cumulative Volume Delta (CVD) to assess buying/selling pressure and classify market volatility (Low, Medium, High).
Uses ATR to dynamically adjust momentum thresholds, ensuring signals adapt to current market conditions.
Optional AI Market Analysis module predicts trends across multiple timeframes by combining trend, momentum, and volatility scores.
Visual Elements:
Plots CHoCH and BOS levels as horizontal lines with distinct colors (aqua for CHoCH sell, lime for CHoCH buy, fuchsia for BOS sell, teal for BOS buy).
Draws dynamic support and resistance trendlines based on short and long-term price action, colored by trend strength.
Displays TP levels and pivot highs/lows for easy reference.
How It Works
The script combines several technical analysis concepts to create a robust trading system:
Market Structure Analysis:
Pivot highs and lows are identified using a user-defined lookback period (Pivot Length).
CHoCH occurs when price crosses below a pivot high (bearish reversal) or above a pivot low (bullish reversal).
BOS occurs when price breaks a previous pivot low (bearish continuation) or pivot high (bullish continuation).
Trend and Momentum Integration:
Trends are determined by comparing price to EMA and VWAP on multiple timeframes.
Momentum is calculated as the percentage price change, with thresholds adjusted by ATR to account for volatility.
"Get Ready" signals appear when momentum approaches the threshold, preparing traders for potential CHoCH or BOS signals.
Signal Filtering:
Filters ensure signals align with user-defined criteria (e.g., trend direction, volume, breakouts).
The Restrict Repeated Signals option prevents over-signaling by requiring a trend change on a specified timeframe before generating a new signal in the same direction.
AI Market Analysis:
The optional AI module calculates a score for each timeframe based on trend direction, momentum, and volatility (ATR compared to its SMA).
Scores are translated into predictions (▲ for bullish, ▼ for bearish, — for neutral), displayed in a dedicated table.
CVD and Volatility Context:
CVD tracks buying vs. selling pressure by accumulating volume based on price direction.
Volatility is classified using CVD magnitude, influencing the script’s visual cues and signal sensitivity.
Why This Combination?
The integration of pivot-based structure analysis, multi-timeframe trend filtering, and AI-driven adaptivity addresses common trading challenges:
Precision: CHoCH and BOS signals focus on key market turning points, reducing noise from minor price fluctuations.
Context: Multi-timeframe analysis ensures trades align with broader market trends, improving win rates.
Adaptivity: ATR and CVD adjustments make the script responsive to changing market conditions, avoiding static thresholds that fail in volatile or quiet markets.
Customization: Extensive input options allow traders to adapt the script to their preferred markets, timeframes, and risk profiles.
Predictive Insight: The AI Market Analysis module provides forward-looking trend predictions, helping traders anticipate market moves.
This combination creates a self-contained system that balances responsiveness with reliability, making it suitable for both novice and experienced traders.
How to Use
Add to Chart:
Apply the indicator to your TradingView chart for any asset and timeframe.
Recommended timeframes: 5M to 1H for scalping/day trading, 4H to D for swing trading.
Configure Inputs:
Pivot Length: Adjust (default 5) to control sensitivity to pivot highs/lows. Lower values for faster signals, higher for stronger confirmations.
Momentum Threshold: Set the minimum price change (default 0.01%) for signals. Increase for stricter conditions.
Take Profit Points: Define TP distance (default 10 points). Adjust based on asset volatility.
Signal Filters: Enable/disable filters (momentum, trend, volume, breakout) to match your strategy.
Higher/Lower Timeframe: Select timeframes for trend alignment (e.g., 1H for higher, 5M for lower).
AI Market Analysis: Enable for predictive trend insights across timeframes.
Get Ready Signals: Enable to see pre-signals for potential setups.
Interpret Signals:
Buy/Sell Labels: Act on green "Buy" or red "Sell" labels, confirming with TP levels and trend direction.
Get Ready Labels: Yellow "Get Ready BUY" or orange "Get Ready SELL" indicate potential setups; prepare but wait for confirmation.
CHoCH/BOS Lines: Use aqua/lime (CHoCH) and fuchsia/teal (BOS) lines as key support/resistance levels.
AI-Trend Matrix: Check the top-right dashboard for trend strength (%), confidence (%), and timeframe-specific trends.
AI Market Analysis Table: If enabled, view predictions (▲/▼/—) for each timeframe to anticipate market direction.
Trading Tips:
Combine signals with other indicators (e.g., RSI, MACD) for additional confirmation.
Use higher timeframe trend alignment for higher-probability trades.
Adjust TP and signal distance based on asset volatility and trading style.
Monitor the AI-Trend Matrix for trend strength; values above 50% or below -50% indicate strong directional bias.
Originality
PowerHouse SwiftEdge AI v2.10 stands out due to its unique blend of:
Adaptive Signal Generation: ATR-based momentum thresholds and CVD-driven volatility context ensure signals remain relevant across market conditions.
Multi-Timeframe Synergy: The script’s ability to filter signals based on both higher and lower timeframe trends provides a rare balance of precision and context.
AI-Powered Insights: The AI Market Analysis module offers predictive capabilities not commonly found in traditional indicators, simulating institutional-grade analysis.
Visual Clarity: The futuristic dashboard and color-coded trendlines make complex data accessible, enhancing usability for all trader levels.
Unlike standalone pivot or trend indicators, this script integrates multiple layers of analysis into a cohesive system, reducing false signals and providing actionable insights without requiring external tools or research.
Limitations
False Signals: No indicator is foolproof; signals may fail in choppy or low-volume markets. Use filters to mitigate.
Timeframe Sensitivity: Performance varies by timeframe and asset. Test settings thoroughly.
AI Predictions: The AI Market Analysis is based on historical data and simplified scoring; it’s not a guaranteed forecast.
Resource Usage: Enabling all filters and AI analysis may slow performance on lower-end devices.

GIGANEVA V6.61 PublicThis enhanced Fibonacci script for TradingView is a powerful, all-in-one tool that calculates Fibonacci Levels, Fans, Time Pivots, and Golden Pivots on both logarithmic and linear scales. Its ability to compute time pivots via fan intersections and Range interactions, combined with user-friendly features like Bool Fib Right, sets it apart. The script maximizes TradingView’s plotting capabilities, making it a unique and versatile tool for technical analysis across various markets.
1. Overview of the Script
The script appears to be a custom technical analysis tool built for TradingView, improving upon an existing script from TradingView’s Community Scripts. It calculates and plots:
Fibonacci Levels: Standard retracement levels (e.g., 0.236, 0.382, 0.5, 0.618, etc.) based on a user-defined price range.
Fibonacci Fans: Trendlines drawn from a high or low point, radiating at Fibonacci ratios to project potential support/resistance zones.
Time Pivots: Points in time where significant price action is expected, determined by the intersection of Fibonacci Fans or their interaction with key price levels.
Golden Pivots: Specific time pivots calculated when the 0.5 Fibonacci Fan (on a logarithmic or linear scale) intersects with its counterpart.
The script supports both logarithmic and linear price scales, ensuring versatility across different charting preferences. It also includes a feature to extend Fibonacci Fans to the right, regardless of whether the user selects the top or bottom of the range first.
2. Key Components Explained
a) Fibonacci Levels and Fans from Top and Bottom of the "Range"
Fibonacci Levels: These are horizontal lines plotted at standard Fibonacci retracement ratios (e.g., 0.236, 0.382, 0.5, 0.618, etc.) based on a user-defined price range (the "Range"). The Range is typically the distance between a significant high (top) and low (bottom) on the chart.
Example: If the high is $100 and the low is $50, the 0.618 retracement level would be at $80.90 ($50 + 0.618 × $50).
Fibonacci Fans: These are diagonal lines drawn from either the top or bottom of the Range, radiating at Fibonacci ratios (e.g., 0.382, 0.5, 0.618). They project potential dynamic support or resistance zones as price evolves over time.
From Top: Fans drawn downward from the high of the Range.
From Bottom: Fans drawn upward from the low of the Range.
Log and Linear Scale:
Logarithmic Scale: Adjusts price intervals to account for percentage changes, which is useful for assets with large price ranges (e.g., cryptocurrencies or stocks with exponential growth). Fibonacci calculations on a log scale ensure ratios are proportional to percentage moves.
Linear Scale: Uses absolute price differences, suitable for assets with smaller, more stable price ranges.
The script’s ability to plot on both scales makes it adaptable to different markets and user preferences.
b) Time Pivots
Time pivots are points in time where significant price action (e.g., reversals, breakouts) is anticipated. The script calculates these in two ways:
Fans Crossing Each Other:
When two Fibonacci Fans (e.g., one from the top and one from the bottom) intersect, their crossing point represents a potential time pivot. This is because the intersection indicates a convergence of dynamic support/resistance zones, increasing the likelihood of a price reaction.
Example: A 0.618 fan from the top crosses a 0.382 fan from the bottom at a specific bar on the chart, marking that bar as a time pivot.
Fans Crossing Top and Bottom of the Range:
A fan line (e.g., 0.5 fan from the bottom) may intersect the top or bottom price level of the Range at a specific time. This intersection highlights a moment where the fan’s projected support/resistance aligns with a key price level, signaling a potential pivot.
Example: The 0.618 fan from the bottom reaches the top of the Range ($100) at bar 50, marking bar 50 as a time pivot.
c) Golden Pivots
Definition: Golden pivots are a special type of time pivot calculated when the 0.5 Fibonacci Fan on one scale (logarithmic or linear) intersects with the 0.5 fan on the opposite scale (or vice versa).
Significance: The 0.5 level is the midpoint of the Fibonacci sequence and often acts as a critical balance point in price action. When fans at this level cross, it suggests a high-probability moment for a price reversal or significant move.
Example: If the 0.5 fan on a logarithmic scale (drawn from the bottom) crosses the 0.5 fan on a linear scale (drawn from the top) at bar 100, this intersection is labeled a "Golden Pivot" due to its confluence of key Fibonacci levels.
d) Bool Fib Right
This is a user-configurable setting (a boolean input in the script) that extends Fibonacci Fans to the right side of the chart.
Functionality: When enabled, the fans project forward in time, regardless of whether the user selected the top or bottom of the Range first. This ensures consistency in visualization, as the direction of the Range selection (top-to-bottom or bottom-to-top) does not affect the fan’s extension.
Use Case: Traders can use this to project future support/resistance zones without worrying about how they defined the Range, improving usability.
3. Why Is This Code Unique?
Original calculation of Log levels were taken from zekicanozkanli code. Thank you for giving me great Foundation, later modified and applied to Fib fans. The script’s uniqueness stems from its comprehensive integration of Fibonacci-based tools and its optimization for TradingView’s plotting capabilities. Here’s a detailed breakdown:
All-in-One Fibonacci Tool:
Most Fibonacci scripts on TradingView focus on either retracement levels, extensions, or fans.
This script combines:
Fibonacci Levels: Static horizontal lines for retracement and extension.
Fibonacci Fans: Dynamic trendlines for projecting support/resistance.
Time Pivots: Temporal analysis based on fan intersections and Range interactions.
Golden Pivots: Specialized pivots based on 0.5 fan confluences.
By integrating these functions, the script provides a holistic Fibonacci analysis tool, reducing the need for multiple scripts.
Log and Linear Scale Support:
Many Fibonacci tools are designed for linear scales only, which can distort projections for assets with exponential price movements. By supporting both logarithmic and linear scales, the script caters to a wider range of markets (e.g., stocks, forex, crypto) and user preferences.
Time Pivot Calculations:
Calculating time pivots based on fan intersections and Range interactions is a novel feature. Most TradingView scripts focus on price-based Fibonacci levels, not temporal analysis. This adds a predictive element, helping traders anticipate when significant price action might occur.
Golden Pivot Innovation:
The concept of "Golden Pivots" (0.5 fan intersections across scales) is a unique addition. It leverages the symmetry of the 0.5 level and the differences between log and linear scales to identify high-probability pivot points.
Maximized Plot Capabilities:
TradingView imposes limits on the number of plots (lines, labels, etc.) a script can render. This script is coded to fully utilize these limits, ensuring that all Fibonacci levels, fans, pivots, and labels are plotted without exceeding TradingView’s constraints.
This optimization likely involves efficient use of arrays, loops, and conditional plotting to manage resources while delivering a rich visual output.
User-Friendly Features:
The Bool Fib Right option simplifies fan projection, making the tool intuitive even for users who may not consistently select the Range in the same order.
The script’s flexibility in handling top/bottom Range selection enhances usability.
4. Potential Use Cases
Trend Analysis: Traders can use Fibonacci Fans to identify dynamic support/resistance zones in trending markets.
Reversal Trading: Time pivots and Golden Pivots help pinpoint moments for potential price reversals.
Range Trading: Fibonacci Levels provide key price zones for trading within a defined range.
Cross-Market Application: Log/linear scale support makes the script suitable for stocks, forex, commodities, and cryptocurrencies.
The original code was from zekicanozkanli . Thank you for giving me great Foundation.

EQS by SiriusProtected Script Description: "EQS by Sirius"
This indicator is protected and published as invite-only due to its original multi-timeframe structure, advanced visual logic, and proprietary handling of liquidity zones and equal high/low detection. The complexity of its design—featuring adaptive time-based plotting, contextual tooltips, and dynamic zone tracking—reflects a level of custom development intended for professional use, necessitating source protection.
Purpose and Core Logic
“EQS by Sirius” is designed to detect and visualize Equal Highs and Equal Lows (EQS) across multiple timeframes. These levels are commonly interpreted as potential liquidity zones or key market structures, often used by traders for identifying breakout traps, stop hunts, or reversal points. The script applies a precision-based algorithm to identify these EQS levels, providing users with visual cues to support decision-making in various market contexts.
The detection logic is based on comparing the difference between two successive highs (or lows) relative to the high-low range of the bars, allowing the user to fine-tune sensitivity via a precision parameter. When valid EQS conditions are met, horizontal lines are drawn at the detected price level, accompanied by optional shadow trendlines to represent liquidity channels.
Visual Outputs and Features
The indicator provides a rich and customizable visual environment, including:
Multi-Timeframe EQS Detection: Configurable from 1-minute to 4-hour timeframes with automatic sequencing.
Zone Highlighting: Optional background shading for designated date intervals.
Dynamic Shadow Mode: Projects angled trendlines representing potential liquidity zones based on EQS formations.
Touch Counters: Real-time counting of price interactions with plotted EQS levels.
Tooltips: Each label includes a timestamp and price breakdown to provide contextual clarity.
Line Customization: Adjustable color, width, and transparency for each EQS type and its shadow projections.
Auto-zoom Scaling: Adapts visual density based on the active chart’s timeframe.
Visibility Filters: Adjustable proximity thresholds ensure only relevant lines are displayed based on current price action.
How to Use in Trading
Traders can use this tool to:
Identify liquidity targets where price may reverse or accelerate due to stop hunts or breakout traps.
Analyze multi-timeframe confluence by comparing EQS zones from higher timeframes with local market structure.
Monitor touch counts to assess the strength or weakening of support/resistance levels.
Visualize trendline-based liquidity zones using the “shadow mode” to infer possible manipulation or price magnet areas.
Integrate with existing strategies for entry/exit timing, particularly in breakout and mean-reversion models.
Due to the high level of customizability and visual control, the script is suitable for discretionary traders, smart money concept practitioners, and those seeking to combine structural analysis with liquidity mapping.

TICK+ [Pt]█ TICK+ – Advanced US Market Internals & TICK Distribution Tool
TICK+ is a comprehensive indicator that decodes US market internals by leveraging the TICK index—the net difference between stocks ticking up and those ticking down. Unlike many standard TICK tools that only plot raw values, TICK+ provides multiple visualization modes, dynamic moving averages, an independent MA Ribbon, a detailed distribution profile, divergence and pivot analysis, and real-time data tables. This integrated approach offers both visual and quantitative insights into intraday market breadth, trend sustainability, and potential reversals—making it an indispensable tool for trading US indices, futures, and blue‑chip stocks.
Market internals enthusiasts often consider the TICK index indispensable for trading these markets. By offering an immediate snapshot of sentiment and confirming trends through additional analytics, TICK+ gives traders a decisive edge—helping to determine whether a rally is truly supported by broad participation or if caution is warranted.
--------------------------------------------------------------------------------------------------------
█ Key Features:
► Market Internal – Multiple Display Modes:
Line Mode: Plots the TICK index as a continuous line for a clear view of real‑time values and trend direction.
Bar Mode: Uses traditional bar charts to represent the TICK index, emphasizing the magnitude of changes.
Heikin Ashi Mode: Applies the Heikin Ashi technique to smooth out fluctuations, making the underlying trend easier to discern.
Iceberg TICK Mode: Fills the area between zero and the highs in green, and between zero and the lows in red—highlighting how long the market remains in positive versus negative territory.
How It Works & Usage:
These display modes enable traders to select the visualization that best fits their analysis style. For instance, Iceberg TICK Mode highlights the duration of market strength or weakness, a critical factor for intraday directional assessment.
Comparison of Display Modes
► Dual Moving Average – Fast & Slow:
Computes two moving averages on the TICK index:
• Fast MA – reacts quickly to recent changes.
• Slow MA – confirms the overall trend.
Crossovers provide clear signals:
• Fast MA crossing above the slow MA indicates rising bullish momentum.
• Fast MA crossing below the slow MA indicates increasing bearish pressure.
How It Works & Usage:
These dual moving averages assist in detecting momentum shifts. Crossover signals can be used to time entries and exits to align with prevailing market sentiment.
Dual MA Crossover Example
► Moving Average / Smoothed MA – Smoothed & Base Moving Averages:
Calculates a Base MA and a Smoothed MA on the TICK index to reduce short‑term volatility.
Helps clarify the prevailing trend, providing additional confirmation alongside the dual moving averages.
How It Works & Usage:
These averages filter out noise and offer extra validation of the current trend, enhancing the reliability of trading signals.
Base and Smoothed MA Example
► Moving Average Ribbon – MA Ribbon:
Independently plots several moving averages together as a “ribbon,” each line customizable in length and type.
Visually reflects overall market directional strength:
• Consistent green color indicate sustained bullish conditions.
• Uniform red color indicate prevailing bearish sentiment.
How It Works & Usage:
The MA Ribbon provides a layered perspective on market internals. It enables traders to quickly gauge the robustness of a trend or identify early signs of a potential reversal.
MA Ribbon Trend and Shading
► Divergence - Pivot based – Divergence & Pivot Analysis:
Integrates divergence detection with pivot-based trendline analysis.
Identifies instances when the TICK index and price action diverge, serving as an early warning of a weakening trend.
How It Works & Usage:
Divergence signals help refine trade entries and exits by indicating potential trend reversals or adjustments in market sentiment.
Divergence Analysis
► TICK Distribution Profile – TICK Distribution Profile:
Divides the TICK index range into multiple bins to create a profile of how TICK values are distributed.
Identifies the point of control—the level where most TICK readings concentrate—relative to zero.
Allows adjustment of the lookback period to detect shifts in market bias, such as a move from a neutral zone toward extreme levels.
How It Works & Usage:
By visualizing the distribution of TICK readings, traders can monitor changes in market internals that may precede significant trend changes.
TICK Distribution Profile
► ZigZag – ZigZag:
Applies a zigzag algorithm to filter out minor fluctuations and identify significant swing highs and lows.
Highlights trend extremities and potential reversal points.
Offers an optional extension to the last bar for dynamic trend tracking.
How It Works & Usage:
The ZigZag feature helps traders focus on the major price swings that define market structure, eliminating the noise of insignificant movements.
ZigZag Example
► Pivot Trendline – Pivot Trendline:
Draws trendlines connecting pivot highs and pivot lows.
Provides settings to display only the most recent trendline or extend the last trendline.
Assists in identifying evolving support and resistance levels.
How It Works & Usage:
Pivot trendlines offer clear visual cues for key price levels and potential reversal zones, aiding in the timing of trades.
Pivot Trendline Example
► TICK Levels – TICK Levels:
Defines key thresholds for the TICK index, including neutral levels, trend zones, and overbought/oversold (OB/OS) extremes.
Highlights these levels to assist in identifying conditions that may trigger caution or present opportunities.
How It Works & Usage:
Marking these levels provides an immediate reference for assessing when the TICK index enters critical zones, guiding risk management and trade planning.
TICK Levels
► Background Color – Background Color:
Optionally changes the chart background based on TICK or moving average thresholds.
Provides additional visual cues regarding shifts in market sentiment.
How It Works & Usage:
Background color changes help reinforce key signals by immediately indicating shifts in market internals, enhancing overall situational awareness.
Background Color Example
► Data Tables – Data Table:
Displays essential market data in a single, easy-to-read table, including the TICK index source, market sentiment (e.g. Bullish, Bearish, or Neutral), trend status (such as Accelerating ⇗ or Retracing ⇘), and the current TICK value with color-coded strength.
Consolidates numerical data for a quick and precise assessment of market internals.
How It Works & Usage:
The data tables provide live, numerical feedback that complements the visual analysis, making it easy to monitor market sentiment and trend changes at a glance.
Data Table Display with Metrics
--------------------------------------------------------------------------------------------------------
█ Customization & Input Flexibility:
TICK+ offers extensive input options organized into feature‑specific groups, enabling traders to tailor the tool to various strategies:
► Market Internals Group:
Selects the primary TICK index source (with an optional custom override).
Provides a choice of display modes (Line, Bar, Heikin Ashi, Iceberg TICK) with configurable color schemes.
Includes options for iceberg overlays and highlighting.
► Moving Averages Groups (Dual, Smoothed/Base, MA Ribbon):
Dual MA group: Settings for fast and slow moving averages, including type, length, color, and crossover alerts.
Smoothed/Base MA group: Additional methods to filter out short‑term noise and confirm trends.
MA Ribbon group: Independently plots multiple moving averages as a ribbon, with full customization for each line.
► Divergence & Profile Groups:
Includes inputs for divergence detection (source, pivot lookback) and customization of the TICK Distribution Profile (lookback period, color thresholds, layout details).
► ZigZag & Pivot Trendline Groups:
Allows customization of zigzag parameters to highlight trend extremities.
Provides settings for pivot trendline appearance and behavior.
► TICK Levels & Background Colors:
Defines thresholds for neutral, trend, and extreme levels.
Offers color selections for level markers and optional background shading.
► Data Table Configuration:
Enables setting of table location, lookback intervals, and font size to present essential TICK metrics in a user‑friendly format.
--------------------------------------------------------------------------------------------------------
█ Additional Insights:
► TICK Index Fundamentals:
Monitors the net difference between stocks ticking up and down.
A positive reading indicates broader market participation, while a negative reading suggests increased selling pressure.
Understanding how long the TICK stays above or below zero is crucial for gauging intraday momentum.
► Role of Moving Averages:
Smooth out short‑term fluctuations, helping to highlight the prevailing trend.
Crossovers between fast and slow MAs can serve as clear signals for market momentum shifts.
► Interpreting the MA Ribbon:
Provides a layered perspective on market direction.
Consistent color and alignment confirm a strong trend, while variations may hint at reversals.
► Utility of the Distribution Profile:
Breaks down the TICK index into bins, identifying the point of control.
Changes in this control zone—particularly over different lookback periods—can signal potential trend changes.
► Precision of Data Tables:
Supplies live numerical feedback on key market internals, ensuring trading decisions are based on precise, real‑time measurements.
► Comparative Advantage:
Unlike many TICK tools that simply plot raw values, TICK+ provides an integrated, multidimensional analysis of market internals.
Its advanced features—ranging from unique display modes to sophisticated analytical components—make it indispensable for trading US indices, futures, and blue‑chip stocks.
--------------------------------------------------------------------------------------------------------
Disclaimer
This indicator is provided for educational and research purposes only and does not constitute financial advice. Trading involves risk, and thorough testing on historical data is recommended before applying any strategy using TICK+ in live markets.

Geometric Momentum Breakout with Monte CarloOverview
This experimental indicator uses geometric trendline analysis combined with momentum and Monte Carlo simulation techniques to help visualize potential breakout areas. It calculates support, resistance, and an aggregated trendline using a custom Geo library (by kaigouthro). The indicator also tracks breakout signals in a way that a new buy signal is triggered only after a sell signal (and vice versa), ensuring no repeated signals in the same direction.
Important:
This script is provided for educational purposes only. It is experimental and should not be used for live trading without proper testing and validation.
Key Features
Trendline Calculation:
Uses the Geo library to compute support and resistance trendlines based on historical high and low prices. The midpoint of these trendlines forms an aggregated trendline.
Momentum Analysis:
Computes the Rate of Change (ROC) to determine momentum. Breakout conditions are met only if the price and momentum exceed a user-defined threshold.
Monte Carlo Simulation:
Simulates future price movements to estimate the probability of bullish or bearish breakouts over a specified horizon.
Signal Tracking:
A persistent variable ensures that once a buy (or sell) signal is triggered, it won’t repeat until the opposite signal occurs.
Geometric Enhancements:
Calculates an aggregated trend angle and channel width (distance between support and resistance), and draws a perpendicular “breakout zone” line.
Table Display:
A built-in table displays key metrics including:
Bullish probability
Bearish probability
Aggregated trend angle (in degrees)
Channel width
Alerts:
Configurable alerts notify when a new buy or sell breakout signal occurs.
Inputs
Resistance Lookback & Support Lookback:
Number of bars to look back for determining resistance and support points.
Momentum Length & Threshold:
Period for ROC calculation and the minimum percentage change required for a breakout confirmation.
Monte Carlo Simulation Parameters:
Simulation Horizon: Number of future bars to simulate.
Simulation Iterations: Number of simulation runs.
Table Position & Text Size:
Customize where the table is displayed on the chart and the size of the text.
How to Use
Add the Script to Your Chart:
Copy the code into the Pine Script editor on TradingView and add it to your chart.
Adjust Settings:
Customize the inputs (e.g., lookback periods, momentum threshold, simulation parameters) to fit your analysis or educational requirements.
Interpret Signals:
A buy signal is plotted as a green triangle below the bar when conditions are met and the state transitions from neutral or sell.
A sell signal is plotted as a red triangle above the bar when conditions are met and the state transitions from neutral or buy.
Alerts are triggered only on the bar where a new signal is generated.
Examine the Table:
The table displays key metrics (breakout probabilities, aggregated trend angle, and channel width) to help evaluate current market conditions.
Disclaimer
This indicator is experimental and provided for educational purposes only. It is not intended as a trading signal or financial advice. Use this script at your own risk, and always perform your own research and testing before using any experimental tools in live trading.
Credit
This indicator uses the Geo library by kaigouthro. Special thanks to Cryptonerds and @Hazzantazzan for their contributions and insights.

tabbys star [Algo Seeker]Tabbys Star Mission:
Identifying key supply and demand areas for entries, identifying trends for holding positions, and locating potential re-entry or exit points is incredibly useful for traders and investors. This algorithm is designed to simplify these critical processes by providing actionable and intuitive tools directly on the chart.
🟢 Supply & Demand Zones (S&D)
The algorithm identifies key entry points by creating supply and demand blocks that automatically expand across the chart. These blocks remain active until invalidated, helping traders maintain awareness of significant price levels. When a new pivot point is identified, the algorithm generates a new supply or demand block that starts expanding from that pivot. This functionality enables traders to monitor evolving zones while referencing older ones, which might still act as weaker pivot points. These areas are incredibly unique and useful for traders, as they dynamically adapt to price action and provide clear visual cues for decision-making.
🟢 Continuation and Exit Signals
The algorithm also highlights areas for potential re-entries or exits. When the price moves beyond a supply or demand block, arrows are displayed to signal that this area may now be optimal for re-entering a trade or exiting a position.
Separating this logic from supply and demand zones offers significant flexibility for traders. For example, those who wish to hold positions initiated at an order block can confidently wait for these signals before taking profits. Similarly, traders who missed the initial opportunity at an order block can use these signals to evaluate new trade opportunities. This feature is incredibly useful for adapting to evolving market conditions.
🟩 Important Note
Arrow/triangle signals are not definitive indicators of upward or downward movement; they serve as calls to attention. These signals should be analyzed in conjunction with supply and demand zones.
For example, if a signal suggests bullish movement but the price falls below the current supply or demand zone, the signal was merely a call to attention. In such cases, it may indicate the need to set a stop loss or even consider a bearish trade below the zone.
Signals should be viewed as one of several factors to consider and should never be traded on in isolation.
🟢 Trendlines for Additional Confluence
In addition to supply and demand zones, the algorithm generates trendlines to help traders better visualize market trends. These trend lines are drawn from pivot points within the supply and demand blocks, providing an additional layer of confluence. For traders who rely on trendline breaks to make decisions, this feature enhances the overall analysis and adds value to the trading strategy.
🟢 Candle Color Coding
To further enhance clarity, the algorithm color-codes candles based on their position relative to the most recent order block:
Bullish: When the price is above the most recent order block.
Neutral: When the price is within the order block.
Bearish: When the price is below the order block.
This color-coding offers a unique and useful visual representation of the current market sentiment, allowing traders to assess price action at a glance.
Settings Overview
🟢Calculation Strength
This setting allows the user to choose how strict the algorithm should be when calculating data. The Standard option generates more entry and exit signals because the calculations are more lenient.. The Restrictive option uses stricter calculations, resulting in fewer signals for entries and exits.
🟢Use Current Bar:
If checked, the conditions will act on the current bar (real-time updates). If unchecked, the conditions will act after the bar closes. For a non-repainting indicator, leave this unchecked.
🟢Session Type:
Both:
Includes market and after-market hours.
RTH:
Regular trading hours only.
🟢Max Trend Lines:
"1": No trend lines will be shown.
"2" or higher: Displays trend lines based on pivot points.
🟢Bar Color:
Allows selection of candle colors based on the parameters discussed above.
🟢Signal Colors:
As described earlier.
🟢Alerts
For when a signal is created.
Conclusion
This tool is designed to hopefully assist investors and traders by:
Identifying key supply and demand areas for entries.
Highlighting trends for holding positions.
Pinpointing potential re-entry or exit points.

Pattern Pro VPOCSummary:
This indicator combines multi-timeframe pattern detection (triangles and wedges), Volume Point of Control (VPOC) visualization, predictive volume modeling, and a swing-based VWAP. It provides traders with a detailed view of key trading patterns, high-volume levels, and entry/exit opportunities, all integrated into one powerful tool.
How This Script is Unique:
Multi-Timeframe Pattern Analysis:
Identifies chart patterns like triangles and wedges across multiple timeframes, enhancing the trader's ability to spot actionable opportunities.
Dynamically tracks pivot points and projected trendlines to visualize ongoing and potential patterns.
Volume Point of Control (VPOC):
Automatically calculates and plots the VPOC for detected patterns, highlighting the price level with the highest traded volume.
Helps identify strong support/resistance levels within patterns.
Predictive Volume Modeling:
Predicts high-volume trading times based on historical averages, allowing traders to anticipate periods of increased market activity.
Bars are color-coded to reflect projected volume activity.
Swing-Based VWAP:
Incorporates swing highs and lows into VWAP calculations, making it adaptive to current market conditions.
Offers a more dynamic view compared to traditional static VWAP indicators.
Trade Management Features:
Visualizes stop-loss (SL) and take-profit (TP) levels directly on the chart.
Tracks active trades and peak performance, enabling effective trade management.
Customizability:
Offers user-defined settings for timeframe selection, risk management, and volume modeling, making it adaptable to various trading strategies.
How to Use:
Pattern Detection:
The script automatically identifies triangle and wedge patterns. No manual input is needed for detection.
Patterns are displayed with top and bottom trendlines and the associated VPOC.
Volume Modeling:
Enable "Use Predictive Volume" under the Predictive Volume settings to highlight periods of projected high activity.
Customize the moving average period and date range for better precision.
Swing-Based VWAP:
Enable "Use VWAP" and configure the anchor period to suit your trading timeframe (e.g., Session, Week, Month).
The VWAP adapts dynamically to swings for precise insights.
Risk Management:
Adjust initial risk, multiplier, and drawdown limits under Risk Management settings.
Visual SL and TP boxes make it easy to monitor trade progress.
Alerts:
Enable "Pattern Alert" to receive notifications for detected patterns.
Use "Trade Alert" to get notified of potential entry opportunities.
Custom Inputs:
Customize "Lookback Bars for VPOC" to define how far back the indicator searches for volume data.
Modify "Row Size" and "POC Settings" for precise VPOC plotting.
Related Links:
Swing-Based VWAP
Intraday Predictive High-Volume Activity Sessions
Trade Settings:
Pattern Timeframe Input:
Select the timeframe used for detecting patterns (e.g., Chart, 15m, 1H).
Use: Helps identify patterns specific to the selected timeframe.
Bars to Entry:
Defines the number of bars within which a trade should be entered after a pattern is detected.
Use: Ensures timely entries based on identified patterns.
Plot Peak Profit:
Toggles the visualization of the peak profit level for trades.
Use: Helps monitor the maximum potential profit from a trade.
Use Close of Candle Above/Below Top/Bottom Line:
When enabled, the script uses the close of the candle instead of wicks to determine line breakouts.
Use: Ensures more precise break detection for pattern confirmation.
Pattern VPOC Settings:
Lookback Bars for VPOC:
Specifies the number of bars to analyze for calculating the Volume Point of Control (VPOC).
Use: Adjusts the depth of data analyzed for VPOC determination.
Row Size:
Determines the granularity of VPOC calculations. Higher values result in finer divisions.
Use: Fine-tune VPOC plotting for greater precision.
Pattern VPOC Color:
Sets the color of the VPOC line on the chart.
Use: Customize chart aesthetics for better visibility.
Width:
Adjusts the thickness of the VPOC line.
Use: Makes the line more prominent on the chart.
Risk Management:
Initial Risk:
Specifies the base risk amount for each trade.
Use: Helps determine the trade size based on risk tolerance.
Risk Increment Type:
Selects whether risk increments are linear or exponential after consecutive losses.
Use: Adjusts risk dynamically to manage losses effectively.
Multiplier:
Multiplies the risk in exponential mode to calculate the next risk value after a loss.
Use: Defines the growth factor for exponential risk.
Max Drawdown:
Sets the maximum drawdown value before halting trading.
Use: Protects against significant capital depletion.
Initial Capital:
Specifies the starting capital for performance calculations.
Use: Helps measure performance and calculate drawdown percentages.
Alert Settings:
Trade Alert:
Enables alerts for detected trade setups.
Use: Keeps the user notified about potential trade opportunities.
Pattern Alert:
Enables alerts for detected patterns.
Use: Provides immediate notification when a pattern is identified.
Predictive Volume:
Use Predictive Volume:
Toggles the predictive volume modeling feature.
Use: Highlights projected high-volume periods for better timing.
Select Timeframe for Predictive Volume:
Defines the timeframe for predictive volume analysis.
Use: Allows predictive modeling to align with the user's trading style.
MA Average Periods:
Sets the moving average length for volume prediction.
Use: Smoother or more responsive predictive models based on user preference.
Date Range:
Specifies the historical range used for volume analysis.
Use: Limits the scope of volume data for calculations.
VWAP Settings:
Use VWAP:
Toggles the VWAP calculation and plotting.
Use: Tracks the average price weighted by volume to find key price levels.
Hide VWAP on 1D or Above:
Hides VWAP plots on daily or higher timeframes.
Use: Avoids clutter on charts with higher timeframes.
Anchor Period:
Sets the anchor period for VWAP calculation (e.g., Session, Week, Month).
Use: Aligns VWAP with the selected timeframe.
Source:
Defines the price source for VWAP calculation (default: hlc3).
Use: Adjusts VWAP based on the preferred price type.
Offset:
Adjusts the VWAP line's placement by the specified number of bars.
Use: Moves the VWAP line forward or backward for better visual alignment.
Swing Size:
Defines the sensitivity for detecting swing highs and lows in VWAP calculations.
Use: Refines VWAP calculations to match market swings.

SUPER EMA SMA 16x [GUSLM]█ Author's Note:
After extensively reviewing the EMA and SMA consolidation tools in the TradingView library, I found that none fully met my expectations or those of friends and colleagues. Some tools were too specific or not configurable enough, with varying sensitivities. Others lacked options or produced many invalid and incorrect ranges when viewed across different timeframes. Some were fixed in their options, others did not allow visualization on different timeframes or lacked crossover signals and customization options for turning each option on or off. Additionally, there was no custom function to view one or more configurable moving averages from different timeframes in the current view, serving as a time-saving shortcut to avoid switching between timeframes to record values. Consequently, I decided to develop my own tool. I hope that you, fellow traders, find it valuable and enjoy using it.
█ Description:
The GUSLM SUPER EMA SMA 16x allows traders to configure and visualize multiple labeled trendlines for various periods on a single chart, all at once. highlighting how prices move over time. It enables simultaneous display of trendlines for different timeframes, with customizable colors and thicknesses. Designed for traders who use moving averages in their strategies, it simplifies the analysis of key moving averages like the 200-period, 100 50 12 26 and 20-period etc, offering a clear, configurable tool to try to identify reactions, trends, supports, and resistances.. This indicator employs algorithms to detect and show signals where price movements are confined, all that can be usefull for helping traders spot potential breakout zones and make informed trading decisions.
█ Key Features:
► Customizable Timeframes: Display in one, multiple moving averages and exponential moving averages across various timeframes (weekly, daily, hourly, and 4-hour) to tailor analysis to your trading strategy.
► Adjustable Display Settings: Choose which moving averages to display and customize their visual characteristics, including color and line width, to match your chart preferences.
► Dynamic Alerts: Activate signals for different timeframes with customizable visual cues, including background color changes and shape indicators to highlight key trading signals.
► Clear Visual Indicators: Enhance chart readability with distinct colors and shapes for different types of moving averages and also crossover events, providing immediate visual feedback for trading decisions.
█ User-Defined Inputs:
► Moving Averages Display Options:
Weekly: MA 200, EMA 200, EMA 100, EMA 50, EMA 20, EMA 12, EMA 26
Daily: MA 200, EMA 200, EMA 100, EMA 50, EMA 20, EMA 12, EMA 26
Hourly: MA 200, EMA 200, EMA 100, EMA 50, EMA 20, EMA 12, EMA 26
4-Hour: MA 200, EMA 200, EMA 100, EMA 50, EMA 20, EMA 12, EMA 26
► Line Width Adjustments:
Hourly, Daily, Weekly, 4-Hour
► Color Options for each range and or individually
► Options for type and Signal; Weekly: On/Off Daily: On/Off Hourly: On/Off 4-Hour: On/Off
► Background color change and arrow shapes for crossover and crossunder signals
█ How It Works:
► Range Detection: The indicator scans the charts in different timeframes of the same asset, based on options, and plot them on the actual view, even if they are from another timeframe. And label it based on configuration, telling wich one is from where as H 4h W etc, and its lenght and range. also for collors widths etc. It calculates the average or exponential average price from other timeframes, and plot it in the current view.
► Visualization: Validated ranges and lines are highlighted on the chart with colored optimized lines, providing a clear visual cue of potential zones.
█ Usage Examples:
► Example 1:
You can configure the ranges you want and timeframes you want and see how it interact with the prices. and can expect eventual future reactions.
█ Practical Applications:
► Identify and Confirm Breakout Zones: Use the lines to identify potential breakout zones and limits, Ex: if is there a key level above your breakout, you may expect a reaction, maybe changing your plan to make an entrance above the initial resistance, you can see eventual resistance and support zones. helping to anticipate significant price movements.
► Identify Key Price Levels: The tool helps in pointing key price levels where there is a high probability of significant price reactions, providing crucial insights for trading strategies.
► Enhance Technical Analysis: Integrate the SUPER EMA SMA 16x into your existing technical analysis toolkits to improve the accuracy of your trading decisions.
█ Conclusion:
The SUPER EMA SMA 16x is a powerful tool, for traders looking to identify periods of price consolidation, support and resistance levels and potential confirmation for breakout zones. Serving as a time-saving shortcut with its customizable settings and algorithms, it provides a reliable and visual method to enhance your trading strategy. Whether you're a beginner or an experienced trader, this indicator can add significant value to your technical analysis.
█ Cautionary Note:
While the SUPER EMA SMA 16x is a powerful tool to see many relevant SMAS and EMAS and signals, it's important to combine it with other indicators and analysis methods for comprehensive trading decisions. Always consider market context and external factors when interpreting detected consolidation ranges.
Bitcoin Destiny Line Model v1.1The Bitcoin Destiny Line Model
Table of Contents
1. Overview
2. Analytical and Technical Techniques Employed
3. Objectives of the Bitcoin Destiny Line Model
4. Key Technical Components and Functionalities
4.1. Bitcoin Destiny Line and Heatmap
4.2. Halving Cycles Markers
4.3. Dynamic Repricing Rails with Diminishing Volatility Adjustment
4.4. Seasonal Dynamics
4.5. Support and Resistance Zones
4.6. Market Action Indicators
4.7. Cycle Projections
4.8. Heatmap Only
5. Settings
6. Different Strategies to Utilize the Model
6.1. Value-Based Entry Strategy
6.2. Long-Term Position Strategy
6.3. Scaling Out Strategy
6.4. Portfolio Rebalancing Strategy
6.5. Bear Market Strategy
6.6. Short-Term Trading Strategy
7. Recommendations and Disclosures
1. Overview
The Bitcoin Destiny Line Model is a technical analysis toolset designed exclusively for Bitcoin. It integrates a comprehensive suite of analytical methodologies to provide deep insights into Bitcoin's market dynamics focusing on long-term investment strategies.
By analyzing historical data through various technical frameworks, the model helps investors gain insight into the current market structure, cycle dynamics, direction, and trend of Bitcoin, assisting investors and traders with data-driven decision-making.
2. Analytical and Technical Techniques Employed
The model integrates a range of analytical techniques:
Cycle Analysis - Centers on the Bitcoin halving event to anticipate phases within the Bitcoin cycle.
Logarithmic Regression Analysis - Calculates the logarithmic growth of Bitcoin over time.
Standard Deviation - Measures how significantly the price action differs from the long-term logarithmic trend.
Fibonacci Analysis - Identifies support and resistance levels.
Multi-Timeframe Momentum - Analyzes overbought or oversold conditions across multiple periods.
Trendlines - Draws trendlines from expected cycle lows to expected cycle highs extending logarithmic and deviation lines into the future as projection lines.
3. Objectives of the Bitcoin Destiny Line Model
The model is crafted to deliver an empirical framework for Bitcoin investing:
Bitcoin Market Structure - Offers insights into Bitcoin’s market structure.
Identify Value Opportunities and Risk Areas - Pinpoints potential value-entry opportunities and recognizes when the market is over-extended.
Leverage Market Cycles - Utilizes knowledge of Bitcoin’s seasonal dynamics and halving cycles to inform investment strategies.
Mitigate Downside Risk - Provides indicators for potential market corrections, aiding in risk management and avoidance of buying at peak prices.
4. Key Technical Components and Functionalities
4.1. Bitcoin Destiny Line and Heatmap
The cycle low to cycle high line with a risk-based color-coded heatmap serves as a central reference for Bitcoin’s price trajectory.
It emphasizes the long-term trend indicating areas of value in cool colors and areas of risk in warm colors.
4.2. Halving Cycles Markers
Bitcoin halving events are marked on the chart with vertical lines forming anchor points for cycle analysis.
4.3. Dynamic Repricing Rails with Diminishing Volatility Adjustment
Repricing rails based on the long-term logarithmic trend highlight the rails on which Bitcoin's price will reprice up or down.
Adjusts to the diminishing volatility of the asset over time as it matures.
4.4. Seasonal Dynamics
Integrates Bitcoin's inherent seasonal trends to provide additional context for market conditions aligning with broader market analysis.
Understanding Bitcoin’s seasons:
Spring Awakening - The initial recovery phase where the market begins to rebound from a bear market showing early signs of improvement. This is an ideal time for cautious optimism. Investors should consider gradually increasing their positions in Bitcoin, focusing on accumulation as confidence in market recovery grows.
Blossom Boom - A market bottom has been confirmed by now and market interest continues to pick up ahead of the Bitcoin halving. This typically presents a great opportunity for investors to position themselves advantageously ahead of expected price movements. It’s a good time to review and adjust portfolios to align with anticipated trends.
Midsummer Momentum - This phase follows the Bitcoin halving, characterized by a sideways to upward price trend often supported by heightened interest and media coverage. It represents potentially the last opportunity in the cycle for investors to purchase Bitcoin at lower price levels unlikely to be seen again. Investors should closely monitor the market for value buying opportunities to bolster their long-term investment strategies.
Rocket Rise - A phase where Bitcoin prices are likely to surge dramatically driven by a mix of Fear of Missing Out (FOMO) among new investors and widespread media hype. The strategy here is twofold: long-term holders should hold steady to reap maximum gains whereas more speculative investors might look to capitalize on the volatility by taking profits at optimal moments before a potential correction.
Winter Whispers - Following a bull run, the market begins to cool, marked by some investors taking profits and consequently increasing price fluctuations and volatility. During this time, investors should remain vigilant, tightening stop-loss orders to safeguard gains. This phase may be suitable for those looking to liquidate a portion of their long-term investments. However, for an investor to be selling the majority of their Bitcoin holdings is generally not advisable as it could preclude benefiting from potential future appreciations.
Deep Freeze - The market enters a bearish phase with significant price declines and market corrections. It's a period of consolidation and resetting of price levels. The end of this stage could typically be seen as a buying opportunity for the long-term investor. Accumulating Bitcoin during this phase can be advantageous as prices are lower and provide a foundation for significant growth in the next cycle.
4.5. Support and Resistance Zones
Calculates key levels that inform stop-loss placements and trading size decisions enhancing trading strategy around the Bitcoin Destiny Line.
4.6. Market Action Indicators
Suggests potential trading actions for different market phases aiding traders in identifying investment/trading opportunities.
Risk Indicator - Signals when prices are extremely over-extended helping to avoid entries during potential peak valuations.
4.7. Cycle Projections
Extends repricing levels into the future providing a visual forecast of expected price movements and enhancing strategic planning capabilities.
Cycle-High Price Projection Range - Provides a probabilistic range for upcoming cycle peaks based on historical trends and current market analysis.
4.8. Heatmap Only
It is also possible to plot the heatmap only as a background or as a bar in a second indicator.
4.9. Complete Visual View
A complete view of all key elements switched on the model.
5. Settings
Users can select to only show specific elements or all elements of the model.
They can set the sensitivity of some of the model elements and adjust certain view settings.
6. Different Strategies to Utilize the Model
The following strategies are enabled by the Bitcoin Destiny Line model:
6.1. Value-Based Entry Strategy
Investors can optimize their investment strategy by deploying investable cash either as a lump sum or on a dollar-cost averaging basis upon the display of a value indicator (Up-Triangles) which signals the highest probability for value entries.
6.2. Long-Term Position Strategy
As an alternative, investors may prefer to continue deploying investable funds while cooler colors (green or blue) are displayed on the value map, indicating favorable conditions for long-term positions.
6.3. Scaling Out Strategy
Investors may choose to scale out some of their investment upon the display of a risk indicator (circles) reducing exposure to potential downturns.
6.4. Portfolio Rebalancing Strategy
A sound strategy can also be to follow a portfolio rebalancing approach by deploying available investable cash upon the display of a value indicator. Rebalance the portfolio to maintain 25% in cash upon the display of a risk indicator. Adjust this ratio as subsequent risk indicators are triggered, deploying available cash upon future value signals.
6.5. Bear Market Strategy
In a bear market, traders may seek short positions upon the display of the Continued Downward Momentum indicator (Down Triangles) capitalizing on declining market trends.
6.6. Short-Term Trading Strategy
Traders can use hourly or 4-hourly data along with the daily Price Rails and Heatmap Bar for short-term positions. They may incorporate other preferred indicators such as RSI for entry/exit decisions.
7. Recommendations and Disclosures
Investors are recommended to take a prudent approach. It is not recommended for investors to scale out completely or significantly reduce the largest portion of their long-term Bitcoin positions in hopes of buying back at lower prices unless they have a compelling reason to do so. The future market conditions may not replicate past opportunities making this strategy uncertain. However, scaling out a smaller portion such as 25% can offer a high potential for an asymmetric risk-reward ratio. This approach is likely to provide a higher risk-adjusted return compared to traditional dollar-cost averaging or random lump sum adjustments.
The Bitcoin Destiny Line Model leverages 13.5 years of available price data across four complete Bitcoin market cycles.
While each additional cycle enriches the model's robustness and enhances the reliability of its forecasts, it is crucial for users to understand that historical trends are indicative of probable future directions and potential price ranges. Users should be cognizant that past performance is not a definitive predictor of future results and should not be the sole basis for investment decisions.

[Support and Resistance with Trend Lines] with Backtest (TSO) with Backtest (TSO)
===========================================================================
===========================================================================
This indicator serves as a comprehensive full-cycle trading system, providing alerts at each stage of the trade, from opening to closure. The algorithm uses most recent and historical S&R (Support and Resistance) levels with most recent and historical Trend Lines, generating signals for trades when Breaks/Bounces occur (Trade Open Signal triggers can be configured via very customizable indicator Input "Signal Trigger Matrix" settings). With signal for trade open, TP (Take Profit and SL (Stop Loss) levels are calculated as well and marked on the chart including alerts for each action of the trade. The indicator offers a variety of automated approaches for TP (Take-Profit) and SL (Stop-Loss) settings. These include static current/historical S&R (Support and Resistance) levels or S&R/Trend Lines dynamic breaks for TP (Take-Profit) and various SL (Stop-Loss) approaches, including ATR Trailing SL, opposite S&R (Support and Resistance) levels SL, opposite Trend Lines SL and more. This diverse set of tools ensure flexibility in tailoring TP (Take-Profit) and SL (Stop-Loss) parameters to different market conditions, contributing to a more adaptive and robust trading system. Additionally, a series of signal analysis tools, including market sentiment, candle bar analysis, divergence, and volume, enhance the precision of trading signals.
* Works with popular timeframes: 1M, 3M, 5M, 15M, 30M, 45M, 1H.
* Works well with Futures and Indices, can be used to trade Stocks, Crypto and FOREX.
* Includes LIVE alert/labels Breakouts and Bounces signal trigger feature, which can be used for scalping (NOTE: This approach cannot be backtested).
* Every action of the trade is calculated on a confirmed closed candle bar state (barstate.isconfirmed), so the indicator will never repaint.
==============================================================
Indicator examples:
---------------------------------------------------------------------------
Strategy Config: SRTL_MES_15M3Y_EODoff_ALL
Here is a nice example of MES (Micro E-Mini S&P 500 Index Futures) configuration, which uses S&R (Support and Resistance) breakouts as signal trigger with Elliot Wave confirmation and previous S&R historical levels for TP (Take-Profit).
---------------------------------------------------------------------------
An example of an intraday Tesla trade. Also the green arrows will be displayed IMMEDIATELY when Breakout/Reverse Bounce occurs (same an Alert will be triggered immediately).
===========================================================================
Trading open/close/TP/SL labels, plots and colors explanations:
---------------------------------------------------------------------------
>>> S&R (Support and Resistance) levels/lines: orange - support, blue - resistance (can be hidden).
>>> Trend Lines: yellow - support, green - resistance (can be hidden).
>>> Blue labels show resistance breakouts and bounces, light-blue - bullish, dark-blue - bearish
>>> Yellow labels show resistance breakouts and bounces, light-yellow - bullish, dark-yellow - bearish
>>> Green/Red arrows on top/bottom of candle bar will show LIVE breakouts (if turned on)
>>>>> LONG open: green "house" looking arrow below candle bar.
>>>>> SHORT open: red "house" looking arrow above candle bar.
>>>>> LONG/SHORT take-profit target: green/red circles (multi-profit > TP2/3/4/5 smaller circles).
>>>>> LONG/SHORT stop-loss target: green/red + crosses.
>>>>> LONG/SHORT take-profit hits: green/red diamonds.
>>>>> LONG/SHORT stop-loss hits: green/red X-crosses.
>>>>> LONG/SHORT EOD (End of Day | Intraday style) close (profitable trade): green/red squares.
>>>>> LONG/SHORT EOD (End of Day | Intraday style) close (loss trade): green/red PLUS(+)-crosses.
===========================================================================
STATS TABLE ///////////////////////////////////////////////////////////////
---------------------------------------------------------------------------
>>> Trading STATS table on the chart showing current trade direction, Last TP (Take-Profit) Taken, Current Trade PL (profit/loss in price difference from trade open to the very current state).
---------------------------------------------------------------------------
CUSTOM TRADING DATE RANGE /////////////////////////////////////////////////
---------------------------------------------------------------------------
>>>>> This feature can be used to manually set indicator trading range from and to a specific date and time. NOTE: This is not intended for a very long date range backtesting, utilize TradingView Strategy Tester for that.
* Use TradingView “Strategy Tester” to see Backtesting results
NOTE: If Strategy Tester does not show any results with Date Ranged fully unchecked, there may be an issue where a script opens a trade, but there is not enough TradingView power to set the Take-Profit and Stop-Loss and somehow an open trade gets stuck and never closes, so there are “no trades present”. In such case - manually check “Start”/“End” dates or use “Deep Backtesting” feature!
---------------------------------------------------------------------------
INTRADAY ACTIVE TRADING SESSION CONFIGURATION /////////////////////////////
---------------------------------------------------------------------------
>>> Regional Active Trading Session Hours Schedule: If selected - trades will only open during regional active trading session, if 'OFF', there will be no trading schedule and trades will open 24/7.
>>> EOD(End of Day) Close - On/Off: Close the trade if it's still open at the end of active trading session (on the very last candle bar). NOTE: If no region is selected at 'Regional Active Trading Session Schedule' - there will be no EOD(End of Day) Close and trades will run overnight until either SL(Stop-Loss) or TP(Take-Profit) is hit!
>>>>> EOD(End of Day) Close - 1 candle bar before last: This is specifically for stocks as while usually indices can be closed 15minutes after the market closes, for stocks - the last candle bar closes at the same time with the market active trading session, which if closed - trades can't be closed until next day/session! Enable this setting for the trade to close/alert 1 candle bar before the last one, so there is still time to close the trade at the Broker (NOTE: depending on the timeframe, 1 candle bar can be: 15sec, 30sec, 1min, 3min, 5min, 15min, 30min, 45min, 1h).
---------------------------------------------------------------------------
SIGNAL TRIGGER MATRIX ////////////////////////////////////////////////
---------------------------------------------------------------------------
>>> Trading Engine: This setting turns on TradingView Strategy trading engine for backtesting.
>>> Market Session Only: With this setting turned on, all signal trigger Breaks/Bounces will be hidden during Pre/Post market time.
>>> Plot S&R Levels/Lines: Plot S&R (Support and Resistance) on chart. Note: historical levels/lines will only be plotted if hit (Break/Bounce).
>>> Plot Trend Lines Levels/Lines: Plot Trend Lines levels/lines on chart. Note: historical levels/lines will only be plotted if hit (Break/Bounce).
>>> Use S&R Current Levels | Use S&R Historical Levels | Use Trend Lines Current Levels | Use Trend Lines Historical Levels |: Choose which levels should be used for Breaks/Bounces to be captured on. If all triggers are turned on/checked - whatever happens 1st wins the trigger.
>>> Breaks | Bounces: 'Breaks': Turn on Breaks through levels/lines signal trigger. | 'Bounces': Turn on Bounces off levels/lines signal trigger.
>>> Signal: Regular | Signal: S&R Combo | Signal: TL Combo | Signal: S&R + TL Combo | Signal: Repeat Action |: Trade open signal trigger execution approach MATRIX (If 1 or more turned on at the same time - whatever comes first will be the trade signal trigger). 'Regular': A single Break/Bounce must occur on a closed bar for signal trigger. 'S&R Combo': A combination of 2 Current + Historical S&R (Support and Resistance) Break/Bounce must happen in the same direction on same bar for signal trigger. 'TL Combo': A combination of 2 Current + Historical Trend Lines Break/Bounce must happen in the same direction on same bar for signal trigger. 'S&R + TL Combo': a combination of ANY S&R and Trend Line Break/Bounce must happen in the same direction on same bar for signal trigger. 'Repeat Action': Initial and then confirmation (2nd/3rd/etc. consecutive occurence) Break/Bounce must occur on same level/line for signal trigger.
>>> Historical - Look Back (# of days): How far back (in # of days) will historical S&R/Trend Lines will be used for Trade Open signals/TP/SL/etc.
>>> Historical - Look Back Invalidation (# of days): IF THERE IS TOO MUCH HISTORICAL LEVELS/LINES ON CHART - LOWER THIS SETTING + MAKE SURE IT'S SMALLER THAN 'Historical - Look Back (# of days)'. With big Look back period (5+ days) - it can become very messy with too many historical levels/lines. To clear oldest historical levels/lines - set Look Back Invalidation # of days to less than Historical Look Back # of days. (After X # of Look Back Invalidation days - older levels/lines will become invalidated and no longer used for opening trades/TP (Take-Profit)/SL (Stop-Loss), while newer levels/lines will still be discovered.
>>> S&R/Trend Lines - Support/Resistance combined into 1 entity: Every level or a line becomes simply a level or a line, regardless if it originally was a support or resistance. By default, depending on the level/line originally being support or resistance - the signal direction will be such as: Resistance is broken > LONG / bounced > SHORT; Support is broken > SHORT / bounced > LONG; with this setting on, either level or line can be both broken or bounced off in ANY direction, trade open direction will depend on current market sentiment only.
---------------------------------------------------------------------------
S&R CONFIGURATION ////////////////////////////////////////////////
---------------------------------------------------------------------------
>>> S&R Search - Left Bars (current): This setting is for calculating optimal S&R (Support and Resistance) levels (in combination with below - Right Bars).
>>> S&R Search - Right Bars (current): This setting is for calculating optimal S&R (Support and Resistance) levels (in combination with above - Left Bars).
>>> S&R Search - Custom Resolution (current): This is a custom timeframe setting specifically for S&R Search, it disregards current chart timeframe. This is great to use for scalping, for example: with main chart set to 1min and the custom timeframe set to 3min or 5min - there will be stronger support/resistance levels with more detailed price action.
>>> S&R Search - Left Bars (historical): This setting is for calculating optimal S&R (Support and Resistance) levels (in combination with below - Right Bars).
>>> S&R Search - Right Bars (historical): This setting is for calculating optimal S&R (Support and Resistance) levels (in combination with above - Left Bars).
>>> S&R Search - Custom Resolution (historical): This is a custom timeframe setting specifically for S&R Search, it disregards current chart timeframe. This is great to use for scalping, for example: with main chart set to 1min and the custom timeframe set to 3min or 5min - there will be stronger support/resistance levels with more detailed price action.
>>> S&R - Historical S&R Levels - Extend to the right: Extend all S&R lines to the right.
>>> S&R (Current/Historical) - Live Breakout/Bounce - ALERT/SHOW: NOTE: Alert wlil trigger immediately at price Breaking thru or Bouncing off level/line and an arrow above /below the bar will show the direction of breakout/bounce. If on that same live bar - price comes back causing the Breakout/Bounce become no longer valid - the arrow will disappear as the condition of the Break/Bounce will no longer be valid.
---------------------------------------------------------------------------
TREND LINES CONFIGURATION ////////////////////////////////////////////////
---------------------------------------------------------------------------
>>> Show: Trend Line development (where it 'did not exist' yet): It takes 2 pivots to develop a trend line, pivot is established at least 3 candle bars later from where the pivot is. With this setting turned on - it will plot dashed lines where trend lines originated connecting the 1st and 2nd pivot point up to where the trend line became established (where in reality you would now be able to draw a certain trend line). Established already generated trend line are plotted with a solid line.
>>> Trend Lines - Line Slope Confirmation: LONG breakout will only be shown if trend line is goind downslope \. SHORT breakout will only be shown if trend line is goind upslope /.
>>> Trend Lines - Search - Left Bars (current): This setting is for calculating optimal Trend Lines.
>>> Trend Lines - Search - Right Bars (current): This setting is for calculating optimal Trend Lines.
>>> Trend Lines - Custom Resolution (current): This is a custom timeframe setting specifically for S&R Search, it disregards current chart timeframe. This is great to use for scalping, for example: with main chart set to 1min and the custom timeframe set to 3min or 5min - there will be stronger support/resistance levels with more detailed price action.
>>> Trend Lines - Search - Left Bars (historical): This setting is for calculating optimal Trend Lines.
>>> Trend Lines - Search - Right Bars (historical): This setting is for calculating optimal Trend Lines.
>>> Trend Lines - Custom Resolution (historical): This is a custom timeframe setting specifically for S&R Search, it disregards current chart timeframe. This is great to use for scalping, for example: with main chart set to 1min and the custom timeframe set to 3min or 5min - there will be stronger support/resistance levels with more detailed price action.
>>> Trend Lines - Historical Trend Lines - Extend to the right: Extend all Trend Lines to the right.
>>> Trend Lines (Current/Historical) - Live Breakout/Bounce - ALERT/SHOW: NOTE: Alert will trigger immediately at price Breaking thru or Bouncing off level/line and an arrow above /below the bar will show the direction of breakout/bounce. If on that same live bar - price comes back causing the Breakout/Bounce become no longer valid - the arrow will disappear as the condition of the Break/Bounce will no longer be valid.
---------------------------------------------------------------------------
TAKE-PROFIT/STOP-LOSS CONFIGURATION ///////////////////////////////////////
---------------------------------------------------------------------------
>>> TP (Take-Profit) System: 'S&R Static Current/Historical': TP (Take-Profit) is calculated using current/historical S&R (Support & Resistance) levels at trade open and remains static. 'S&R/Trend Lines Dynamic Breaks': TP (Take-Profit) is fully dynamic and will be trigger at price above trade open price and with Breakout occurence (S&R or Trend Line current/historical breakout).
>>> TP (Take-Profit) # of targets: It is wise to divide the trade into several profit targets. With this setting - up to 5 TP (Take-Profit) targets can be approached. The trade will be equally divided up by the selected # of TP (Take-Profit) targets.
>>> SL (Stop-Loss) System: 'ATR-Trailing-SL': SL (Stop-Loss) is trail-following the ATR (Average True Range) line, NOTE: If at signal trigger, ATR will be against the trade direction - trade open signal will be skipped; 'S&R-Static-SL': SL (Stop-Loss) is set at trade open per optimal most recent S&R level and remains there until trade closes; 'TrendLines-Static-SL': SL (Stop-Loss) is set at trade open per optimal most recent trend line and remains there until trade closes; 'TrendLines-Dynamic-SL': SL (Stop-Loss) will be set per current opposite trend line and follow it until trade is open.; 'Oppos-Sig-Trd-in-Loss': SL (Stop-Loss) will trigger at opposite signal with trade currently at loss.
>>> SL (Stop-Loss) - On/Off: Without SL (Stop-Loss), unless EOD (End of Day) Close is turned on - there will be no SL (Stop-Loss) at all!
---------------------------------------------------------------------------
MARKET SENTIMENT CONFIRMATION ///////////////////////////////////////
---------------------------------------------------------------------------
>>> Market Sentiment: Signal is confirmed per Market Sentiment direction. If Market Sentiment is turned off - whatever signal comes 1st will be the trade open trigger.
---------------------------------------------------------------------------
SIGNAL ANALYSIS AND CLEANUP ///////////////////////////////////////////////
---------------------------------------------------------------------------
>>> Signal Cleanup - Bar Color: Include Bar Color (bullish/bearish) confirmation, LONG signal will only be opened if signal bar is green/bullish, SHORT if red/bearish.
>>> Signal Cleanup - Bar Directional Structure: Skip opposite bar structure types signals (For example: bearish green hammer).
>>> Signal Cleanup - Bar Doji Skip: Skip doji (indecisive) candles signals.
>>> Signal Cleanup - EWO (Elliott Wave Oscillator): Include EWO (Elliott Wave Oscillator), LONG will only be opened if EWO is bullish / SHORT if EWO is bearish.
>>> Signal Cleanup - VWAP (Volume-Weighted Average Price): Include VWAP (Volume-Weighted Average Price), LONG will only be opened if price is above VWAP / SHORT if price is below VWAP.
>>> Signal Cleanup - MA (Moving Average) Confirmation: Include MA (Moving Average), LONG will only be opened if MA is bullish / SHORT if MA is bearish.
>>> Signal Cleanup - ATR (Average True Range): Include ATR (Average True Range) confirmation, LONG will only be opened if ATR is bullish / SHORT if ATR is bearish.
>>> Signal Cleanup - Divergence(RSI + MACD): Include Divergence (RSI + MACD ) confirmation, LONG will only be opened if Divergence is bullish / SHORT if Divergence is bearish.
>>> Signal Cleanup - Volume % Strength: Include Volume strength/percentage confirmation, LONG/SHORT will only be opened with strong Volume matching the signal direction | By default, strong Volume percentage is set to 150% and weak to 50%.
>>> Signal Cleanup - Volume Above Average: Include Volume Above Moving Average (Volume closing bar closes above volume moving average) confirmation, LONG/SHORT will only be opened with Volume above average - Volume closed bar color must match the closed price color (bullish/bearish direction) + Volume bar must be closed above volume MA line).
---------------------------------------------------------------------------
===========================================================================
||||||||||||||||||||||||||||||||||| *** ||||||||||||||||||||||||||||||||||| *** |||||||||||||||||||||||||||||||||||
||||||||||||||||||||||||||||||||||| *** ||||||||||||||||||||||||||||||||||| *** |||||||||||||||||||||||||||||||||||
TP System - VERY IMPORTANT INFO!
-------------------------------------------------------------------------------------------------------------------
"TP PERCENTAGE" - amount by which current trade/position needs to be reduced/partially closed/sold.
-------------------------------------------------------------------------------------------------------------------
TP System: Dynamic
"TP PERCENTAGE" - will always be the same amount (trade/position size divided by the # of take-profit(TP) targets) and percentage to be closed will always be of the ORIGINAL trade/position.
-------------------------------------------------------------------------------------------------------------------
TP System: Static
"TP PERCENTAGE" - will always be the same amount IF take-profit(TP) targets are hit 1-by-1 (TP1 > TP2 > TP3 > TP4 > TP5), otherwise it will vary and unless it is a 1st take-profit(TP1), the REMAINING trade/position size will always be smaller than original and therefore the percentage to be closed will always be of the REMAINING trade/position and NOT the original one!
-------------------------------------------------------------------------------------------------------------------
"TP PERCENTAGE" CheatSheet (these are the only percentages you may see)
-----------------------------------------------------------------------
TP PERCENTAGE---Close/Sell Amount-------------Example (trade size: 50 stocks)
20%-------------trade size * 0.2--------------50 * 0.2 = 10 stocks
25%-------------trade size * 0.25-------------50 * 0.25 = 12.5(~13) stocks
34%-------------trade size * 0.34-------------50 * 0.34 = 17 stocks
40%-------------trade size * 0.4--------------50 * 0.4 = 20 stocks
50%-------------trade size * 0.5--------------50 * 0.5 = 25 stocks
60%-------------trade size * 0.6--------------50 * 0.6 = 30 stocks
66%-------------trade size * 0.66-------------50 * 0.66 = 33 stocks
75%-------------trade size * 0.75-------------50 * 0.75 = 37.5(~38) stocks
80%-------------trade size * 0.8--------------50 * 0.8 = 40 stocks
100%------------trade size--------------------50 = 50 stocks
-----------------------------------------------------------------------
If for any reason a portion of the current/remaining trade closed at such occurrence was slightly wrong, it is not an issue. Such occurrences are rare and with slight difference in partial TP closed is not significant to overall performance of our algorithms.
||||||||||||||||||||||||||||||||||| *** ||||||||||||||||||||||||||||||||||| *** |||||||||||||||||||||||||||||||||||
||||||||||||||||||||||||||||||||||| *** ||||||||||||||||||||||||||||||||||| *** |||||||||||||||||||||||||||||||||||
===========================================================================
Alert Settings (you don’t have to touch this section unless you will be using TradingView alerts through a Webhook to use with trading bot)
---------------------------------------------------------------------------
Here is how a LONG OPEN alert looks like.
NOTE: Each label , , etc. is customizable, you can change the text of it within indicator Input settings.
ALERT >>>>>>>>>>>>>>>>>>>>>>>>>>>>>>>>>>>>>>>>>>>>>>>
COIN: BTCUSD
TIMEFRAME: 15M
LONG: OPEN
ENTRY: 20000
TP1: 20500
TP2: 21000
TP3: 21500
TP4: 22500
TP5: 23500
SL: 19000
Leverage: 0
---------------------------------------------------------------------------
Here is how a TP1 alert will look with 5 TPs breakdown of the trade.
NOTE1: Next to TP1 taken it will show at which price it was triggered.
NOTE2: Next to "TP Percentage" it shows how much of the CURRENT/ACTIVE/REMAINING trade needs to be closed.
NOTE2: If TP2/3/4/5 comes before TP1 - the alert will tell you exactly how many percent of the trade needs to be closed!
ALERT >>>>>>>>>>>>>>>>>>>>>>>>>>>>>>>>>>>>>>>>>>>>>>>
COIN: BTCUSD
TIMEFRAME: 15M
LONG: TP1
TP1: 20500
TP Percentage: 20%
---------------------------------------------------------------------------
Here is how an alert will look for LONG - STOP-LOSS.
ALERT >>>>>>>>>>>>>>>>>>>>>>>>>>>>>>>>>>>>>>>>>>>>>>>
COIN: BTCUSD
TIMEFRAME: 15M
ENTRY: 20000
LONG: SL
SL: 19000
---------------------------------------------------------------------------
Here is how an alert will look for LONG - EOD (End of Day) In Profit close.
ALERT >>>>>>>>>>>>>>>>>>>>>>>>>>>>>>>>>>>>>>>>>>>>>>>
COIN: BTCUSD
TIMEFRAME: 15M
LONG: EOD-Close (profit)
ENTRY: 20000
EOD-Close: 21900
===========================================================================
Adding Alerts in TradngView
---------------------------------------------------------------------------
-Add indicator to chart and make sure the correct strategy is configured (check Backtesting results)
-Right-click anywhere on the TradingView chart
-Click on Add alert
-Condition: Select this indicator by it’s name
-Immediately below, change it to "alert() function calls only", as other wise there will be 2 alerts for every alert!
-Expiration: Open-ended (that may require higher tier TradingView account, otherwise the alert will need to be occasionally re-triggered)
-Alert name: Whatever you desire
-Hit “Create”
-Note: If you change ANY Settings within the indicator – you must DELETE the current alert and create a new one per steps above, otherwise it will continue triggering alerts per old Settings!
===========================================================================
Good Luck! (NOTE: Trading is very risky, past performance is not necessarily indicative of future results, so please trade responsibly!)
---------------------------------------------------------------------------
NOTE: There seems to be a strange glitch when strategy is running live, it will show "double-take" take-profits labels on the chart. This is not affecting the script logic and backtesting results, if you simply change the timeframe real quick to something else then back - it will no longer show the duplicate orders... this must be some sort of a glitch as every alert was thoroughly tested to make sure everything is working!

Heikin Ashi and Optimized Trend Tracker and PVSRA [Erebor]Heikin Ashi Candles
Let's consider a modification to the traditional “Heikin Ashi Candles” where we introduce a new parameter: the period of calculation. The traditional HA candles are derived from the open , high low , and close prices of the underlying asset.
Now, let's introduce a new parameter, period, which will determine how many periods are considered in the calculation of the HA candles. This period parameter will affect the smoothing and responsiveness of the resulting candles.
In this modification, instead of considering just the current period, we're averaging or aggregating the prices over a specified number of periods . This will result in candles that reflect a longer-term trend or sentiment, depending on the chosen period value.
For example, if period is set to 1, it would essentially be the same as traditional Heikin Ashi candles. However, if period is set to a higher value, say 5, each candle will represent the average price movement over the last 5 periods, providing a smoother representation of the trend but potentially with delayed signals compared to lower period values.
Traders can adjust the period parameter based on their trading style, the timeframe they're analyzing, and the level of smoothing or responsiveness they prefer in their candlestick patterns.
Optimized Trend Tracker
The "Optimized Trend Tracker" is a proprietary trading indicator developed by TradingView user ANIL ÖZEKŞİ. It is designed to identify and track trends in financial markets efficiently. The indicator attempts to smooth out price fluctuations and provide clear signals for trend direction.
The Optimized Trend Tracker uses a combination of moving averages and adaptive filters to detect trends. It aims to reduce lag and noise typically associated with traditional moving averages, thereby providing more timely and accurate signals.
Some of the key features and applications of the OTT include:
• Trend Identification: The indicator helps traders identify the direction of the prevailing trend in a market. It distinguishes between uptrends, downtrends, and sideways consolidations.
• Entry and Exit Signals: The OTT generates buy and sell signals based on crossovers and direction changes of the trend. Traders can use these signals to time their entries and exits in the market.
• Trend Strength: It also provides insights into the strength of the trend by analyzing the slope and momentum of price movements. This information can help traders assess the conviction behind the trend and adjust their trading strategies accordingly.
• Filter Noise: By employing adaptive filters, the indicator aims to filter out market noise and false signals, thereby enhancing the reliability of trend identification.
• Customization: Traders can customize the parameters of the OTT to suit their specific trading preferences and market conditions. This flexibility allows for adaptation to different timeframes and asset classes.
Overall, the OTT can be a valuable tool for traders seeking to capitalize on trending market conditions while minimizing false signals and noise. However, like any trading indicator, it is essential to combine its signals with other forms of analysis and risk management strategies for optimal results. Additionally, traders should thoroughly back-test the indicator and practice using it in a demo environment before applying it to live trading.
PVSRA (Price, Volume, S&R Analysis)
“PVSRA” (Price, Volume, S&R Analysis) is a trading methodology and indicator that combines the analysis of price action, volume, and support/resistance levels to identify potential trading opportunities in financial markets. It is based on the idea that price movements are influenced by the interplay between supply and demand, and analyzing these factors together can provide valuable insights into market dynamics.
Here's a breakdown of the components of PVSRA:
• Price Action Analysis: PVSRA focuses on analyzing price movements and patterns on price charts, such as candlestick patterns, trendlines, chart patterns (like head and shoulders, triangles, etc.), and other price-based indicators. Traders using PVSRA pay close attention to how price behaves at key support and resistance levels and look for patterns that indicate potential shifts in market sentiment.
• Volume Analysis: Volume is an essential component of PVSRA. Traders monitor changes in trading volume to gauge the strength or weakness of price movements. An increase in volume during a price move suggests strong participation and conviction from market participants, reinforcing the validity of the price action. Conversely, low volume during price moves may indicate lack of conviction and potential reversals.
• Support and Resistance (S&R) Analysis: PVSRA incorporates the identification and analysis of support and resistance levels on price charts. Support levels represent areas where buying interest is expected to be strong enough to prevent further price declines, while resistance levels represent areas where selling interest may prevent further price advances. These levels are often identified using historical price data, trendlines, moving averages, pivot points, and other technical analysis tools.
The PVSRA methodology combines these three elements to generate trading signals and make trading decisions. Traders using PVSRA typically look for confluence between price action, volume, and support/resistance levels to confirm trade entries and exits. For example, a bullish reversal signal may be considered stronger if it occurs at a significant support level with increasing volume.
It's important to note that PVSRA is more of a trading approach or methodology rather than a specific indicator with predefined rules. Traders may customize their analysis based on their preferences and trading style, incorporating additional technical indicators or filters as needed. As with any trading strategy, risk management and proper trade execution are essential components of successful trading with PVSRA.
The following types of moving average have been included: "SMA", "EMA", "SMMA (RMA)", "WMA", "VWMA", "HMA", "KAMA", "LSMA", "TRAMA", "VAR", "DEMA", "ZLEMA", "TSF", "WWMA". Thanks to the authors.
Thank you for your indicator “Optimized Trend Tracker”. © kivancozbilgic
Thank you for your indicator “PVSRA Volume Suite”. © creengrack
Thank you for your programming language, indicators and strategies. © TradingView
Kind regards.
© Erebor_GIT

Dynamic Auto Trendline and S/R BlocksAuto TL & S/R Blocks by Nostalgic_92
This powerful TradingView indicator automatically identifies trendlines and support/resistance levels with dynamic transparency blocks, helping traders make informed decisions. Easily customizable, it offers adjustable parameters for lookback periods and transparency, allowing you to adapt it to your trading style.
Key Features:
Lookback Period for Extremes: The lookback period for identifying highs and lows is adjustable, allowing you to fine-tune the indicator to suit your trading strategy.
Maximum Transparency: Set the maximum transparency level to control the visibility of dynamic blocks, ensuring they adapt to market volatility.
Trend Block Color: Choose your preferred color for trendline blocks to visually highlight trend direction.
Support/Resistance Block Color: Customize the color for support and resistance blocks, making them easily distinguishable on your chart.
How it Works:
This indicator calculates the highest high and lowest low over the specified lookback period. It then draws dynamic blocks on your chart with changing transparency levels, depending on the proximity of the current price to these extremes. This visual representation helps you identify trend changes and key support/resistance levels at a glance.
Usage:
Use it in conjunction with your existing trading strategy to confirm trends and support/resistance levels.
Adjust the input parameters to match your preferred trading style and time frame.
Enhance your trading experience with the Auto Trendlines and Support/Resistance with Dynamic Blocks indicator. It's a valuable tool for traders seeking an edge in the market.
Disclaimer: This indicator is intended for educational and informational purposes only. Always conduct your own research and analysis before making trading decisions.
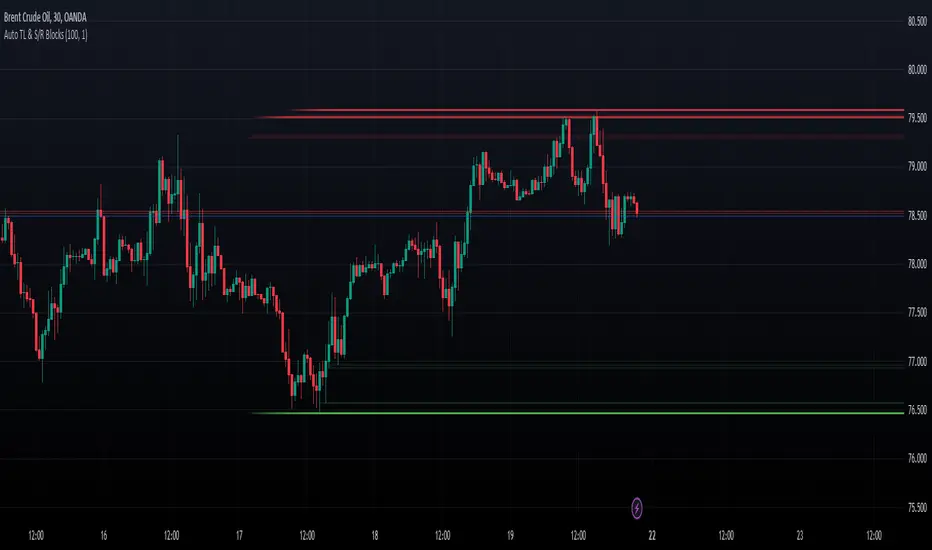
RSI Candle (Tommy)This indicator is the open(free) version of TTT_Crack_RSI_Ver_2.1.0 we have published a while ago.
Hello dear traders from all over the world!
It has been a while since our team started concentrating on the technical indicators that apply sources not only on the closed price but also on the high/low prices of the candlestick to overcome the limitations of existing indicators. As mentioned repeatedly before, most of widely adapted indicators in technical chart these days are generated only with the closed prices, not taking in consideration of the wicks or tails of the candlesticks. This crucially leads to a rapid decrease in the reliability especially in current financial market, where ignoring other portions within a candlestick structure and putting weights just on candle body often causes fatal trading outcome. Since phenomenons such as wide price fluctuation and non-ideal price momentum occur more frequently compared to the old days when TA used to perfectly work just as the images in a textbook, sourcing OHLC (Open, High, Low, Closed) prices from a candle structure is becoming more essential and practical.
Such revolutionary perceptions and insights could be easily acquired: by just adding high/low prices of the candlesticks when computing technical indicators, many more meaningful signals were observed. One of the popular indicators we have recently attempted to reflect this very idea was RSI (Relative Strength Index) that was published by the name of “RSI Cloud” months ago. As shown below, this groundbreaking index was to be comprehended as a band or a cloud rather than a single line. In fact, many unexpected methodologies, techniques, and insights were discovered through countless applications as our team went through series of experiments and back/forward tests. The results were quite shocking: Little did we know that drawing trendlines, parallel channels, and previous highs/lows etc. just like we do on the regular candlestick chart would also work decisively. Not only divergences were efficiently captured, but ‘SR Flip’ techniques also functioned as well.
Anyway, validation and verification process has been successful, ensuring that taking all of the candlestick into an account within the indicators provides much more meaningful signals than the indicators with ‘closed source’, the default setting. During thousands of our trials, we questioned to ourselves: If we are going to transform candlestick structure into an equation utilizing all of the prices, why don’t we just express the index with the same format, as another candlestick? The initial intention of the clouds or bands were to adapt the tails of the candle and to smooth them out. And this radical idea changed the whole game. By applying this candlestick format insights, even more significant signals were brought up on to the surface that surprised all of us.
Without a doubt, just like the cloud version, the candlestick version even works better when applying trendlines, pivots, channels, divergences and SR Flips, etc. As we were studying behaviors of the RSI candlestick indicator, a determinant and significant signal was detected that can be usefully referred to traders and this core element is why this update extremely so innovative. We spotted that the emergence of consecutive tails could be a valuable signal that could be weighted. Especially when the tails appeared in sequence in overbought and oversold zone, a strong preference of trend reversal was observed. It was only matter of time to search for the proper parameters and values that fits the market!
And here we are, presenting our newest indicator, “TTT_Crack_RSI_2.1.0” Just like the previous version, it catches regular and hidden divergences automatically and furthermore, we made it to detect appearance of sequential candle wicks in overbought/sold zone (70 and 30 as default) signaling some possibility of trend reversal. The default setting for the consecutive wick counting (Wick Count) is 4, meaning if candle wicks are formed (Top tail in the overbought zone and bottom tail in the oversold zone) four times in a row, a triangle will appear signaling potential trend reversal. As traders’ preferences, the settings can be customized. “Wick Length” setting let users to decide the minimum size of the wick that are to be considered as the proper criteria of candlestick wick. If one wishes to only imply candle wick that are longer than certain length, he or she can increase the “Wick Length” value. We recommend 30~40 for this parameter value. Moreover, if one wants the minimum number of consecutive wicks to that are to be counted to be greater or less, he or she can put in the minimum counting number value at “Wick Count”. For example, if more conservative trader wishes to consider minimum number of consecutive wicks as 6, then the logic will signal only if the wicks appear 6 times in a row in overbought/sold zone. Overbought and oversold zone can also be modified in the settings just like the regular RSI indicator.
How to effectively use this indicator to search for a decent entry point? First of all, do not just enter position only because a single signal has been appeared. The most reliable and strong entry sign would be when the trendline/channel breaks below/above at the overbought/sold zone and at the same time, consecutive wicks and divergence signals appear as well. If all of those signals have been observed, aim for the spot when RSI escape the overbought/sold zone. That would be a proper time to enter a position. As we emphasized many times, it is very reckless to make trading decisions only with technical indicator. It might defer a little bit depending on traders’ tendency, but indicators are to be considered as a side tool to identify macro level trends and signals of possible trend reversal. Always remember, traders that rely on TA must look for the confluent zone and thus the more technical factors that overlap price-wise and time-wise, the more reliability can be given.
If you wish to try our work, please comment below or send message to this account.
Thank you very much.
본 지표는 예전 업로딩했던 TTT_Crack_RSI_Ver_2.1.0의 무료 버전입니다.
안녕하세요 트레이더 여러분. 토미 트레이딩 팀의 토미입니다.
최근 저희 개발팀은 캔들차트의 종가만으로 산출되는 기술적 지표들의 한계점을 극복하고자 캔들 고/저가까지 적용을 시켜 ‘요즘 장에 더 맞는’ 지표들을 만들기 위해 많은 노력을 해왔습니다. 저희 시장 분석/시황, 강의자료, 그리고 지표 개발 문서에서 누누이 언급 드렸듯, 근래 많은 트레이더 분들에게 널리 사용되고 있는 대부분의 지표들은 캔들의 종가만 고려하는 경우가 많습니다. 비상식적이고 두 눈으로 보고도 믿기지 않을 가격 모멘텀 및 변동성이 난무하는 요즘 21세기 금융시장에서는 예전처럼 교과서에나 볼 법한 뻔하고 예측 가능한 패턴 및 형국들을 찾아보기 힘들어졌습니다. 이렇게 급변하는 최근 시장 성향 상 기술적 분석에 캔들 꼬리를 배제하고 몸통만 고려하기에는 너무 치명적인 리스크가 뒤따라오기 마련입니다.
이런 궁극적인 목표로 개발에 착수한 저희 팀은 캔들의 OHLC(시, 고, 저, 종가)를 지표에 내포시켜 더 유의미한 신호들을 도출할 수 있다는 이론을 검증하였고 이를 반영해 몇 달 전 "RSI 클라우드"를 트레이딩뷰에 출시한 바 있습니다. 아래의 링크(이미지)에서 시사하는 바와 같이 RSI 역시 주가를 하나의 라인이 아닌 구조로 해석하여 밴드나 클라우드 형태로 표현해보니 실제로 더 높은 실용성과 활용성을 입증할 수 있었습니다. 또한 수많은 실험과 백/포워드 테스팅을 거치면서 사전에 전혀 예상치 못한 방법론 및 기법들을 응용시킬 수 있다는 사실까지 밝혀냈습니다. 일반 캔들 차트처럼 추세선, 평행채널, 피봇, 그리고 전 매물대 등의 작도법을 적용시킬 수 있을뿐더러 캔들의 종가가 아닌 고/저가를 활용해보니 더 효과적인 일반/히든 다이버전스 시그널을 찾아낼 수 있었습니다. 게다가 SR Flip (지지와 저항이 뚫리면 바뀌는 현상) 이론마저 잘 먹히는 현상을 인지한 저희는 개발 방향을 이쪽으로 더 깊고 세밀하게 발전시키는 쪽으로 잡았습니다.
여러 시행착오를 통해 이것저것 될 만한 건 다 시도해보던 와중, 저희는 어느 날 문득 이런 질문을 던지게 됩니다. ‘어차피 이왕 캔들의 OHLC 값을 지표화 시키는 거 차라리 지표마저 동일하게 캔들화시키는 게 낫지 않을까?’ 결과는 매우 충격적이면서도 동시에 저희에게 허탈감을 안겨줬습니다. 곰곰이 생각해보니 클라우드/밴드 형태의 지표는 적용시킨 캔들의 고/저가를 일련의 Smoothing out 프로세싱 작업을 입힌 거고 그럴 바엔 오히려 동일한 캔들 형태로 표현해버리면 더 직관적인 경향성과 규칙성을 파악할 수 있을 거란 저희의 예상은 적중했습니다. 클라우드/밴드 지표 형식의 모든 차별성과 장점은 그대로 유지하고 심지어 더 유의미한 신호들을 포착할 수 있었습니다.
해당 산출물에 추세선, 평행채널, 피봇, 전 매물대, 그리고 SR FLIP과 같은 작도법과 다이버전스 시그널 등을 더 세밀하고 효율적으로 적용시킬 수 있는 건 물론이고, 그 외 저희는 또 한가지 결정적이고 획기적인 시그널을 탐지했습니다. 사실 이 부분이 이번 업데이트의 가장 핵심 요소라고 볼 수 있습니다. 캔들스틱화된 RSI 지표의 경향성 및 규칙성 고찰 과정 중 캔들 꼬리가 연속적으로 출현하는 현상에 심상치 않은 기운을 감지한 저희 팀은 정말 소름이 돋을 정도로 용이한 추세 전환 시그널을 발견했습니다. 바로 과매도 구간에서는 아래꼬리, 과매수 구간에서는 위꼬리가 연달아 나올 경우 상당히 높은 확률로 변곡점이 출현하고 추세가 전환되는 경향성에 가중치를 부여해 이에 최적화된 파라미터 및 설정 값들을 찾아 로직화 시켜봤습니다. 결과는 아주 만족스러웠습니다.
이름하여 저희의 최신 지표인 "TTT_Crack_RSI_2.1.0"를 여러분께 소개 드립니다. 이전 버전인 “RSI Cloud”와 마찬가지로, 종가가 아닌 고/저가의 일반/히든 다이버전스 시그널을 알아서 포착해주고, 더 나아가 과매매 구간(기본 값은 30/70이며 설정 변경 가능)에서 RSI 캔들 꼬리의 연속성을 자동으로 감지해 표시(삼각형)를 해주게 끔 만들었습니다. 과매매 구간에서 연이어 출현하는 캔들 꼬리 카운팅의 최소 값은 4으로 디폴트 값 설정을 해 놨습니다. 더 보수적/공격적으로 접근하고 싶으신 분들은, 즉 최소 카운팅 값을 4이 아닌 다른 값으로 변경하고 싶으신 분들은 설정에 들어가셔서 “Wick Count” 항목에 원하는 값을 기재하시면 됩니다.
캔들 꼬리라는 게 어떻게 보면 상대적이고 주관적인 개념일 수 있습니다. 캔들꼬리가 조금만 나와도 의미 부여를 할 수 있는가 하면 특정 이상 길이 아니면 의미 부여를 하지 않을 수 있습니다. 저희는 유저들에게 최대한 높은 유동성을 제공하고자 본 메커니즘이 정의하는 캔들 꼬리 길이를 변경할 수 있도록 만들어 놨습니다. ‘Wick Length” 설정 값을 통해 해당 로직이 간주하는 최소 캔들꼬리 길이를 정할 수 있습니다. 기본 설정 값은 30으로 되어 있고, 경험상 30~40 정도가 적당하다고 보고 있습니다.
마지막으로 해당 지표로 효과적인 진입 타점을 찾는 법을 간략히 알려드리겠습니다. 우선 절대로 아무 시그널 하나 툭 떴다고 무조건 바로 진입하는 건 절대 삼가해주세요. 가급적이면 과매매 구간에서 추세선/채널 이탈, 연속 캔들 꼬리 신호, 그리고 다이버전스가 동시에 떴을 상황을 예의주시하시면 됩니다. 이렇게 비교적 비슷한 시간에 유의미한 신호들이 포착되었다면 또 바로 진입하지 마시고 조금 더 기다리셨다가 과매매 구간을 벗어나는 타이밍을 노리시면 됩니다. 항상 강조드리지만 기술적 지표 하나만 가지고 트레이딩 의사결정을 하는 건 정말 무모한 행위입니다. 개인의 매매성향 마다 다르겠지만 기술적 지표는 항상 큰 추세와 변곡 출현 가능성을 파악하는데 참고하는 용도로 사용 하셔야지 그렇지 않으면 캔들차트는 아예 꺼버리고 지표만 보고 매매하는 꼴이 됩니다.
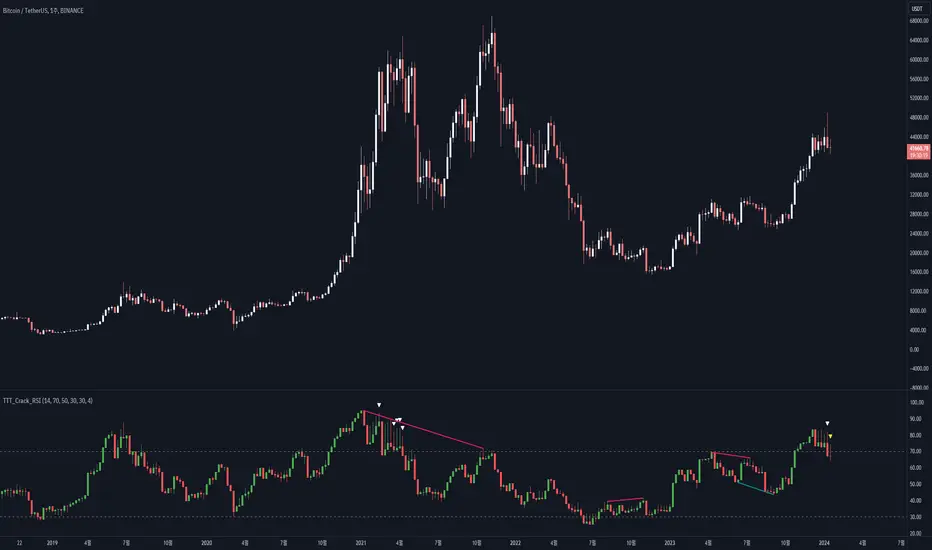
Bull Bear Indicator (BBI)/Introduction
The Bull Bear Indicator (BBI) identifies bull market conditions and bear market conditions for equity investors so they can avoid missing a bull market or getting caught in a bear market.
/Signals
There are two signals:
1. Bull Market Alert - This indicates prices of stocks in the broader market are rising.
2. Bear market Alert - This indicates prices of stocks in the broader market are falling.
Both signals are indicated by a background colour and an upward/downward triangle. A green background and an upward green triangle below the bar signifies an environment of rising prices. A red background and a downward red triangle above the bar indicates an environment of falling prices.
Lack of a coloured background indicates a transition period from Bull to Bear or Bear to Bull conditions. The transitions may be rapid during periods of high volatility.
/Construction
The indicator is constructed using market breadth, price action and moving averages.
1.Market Breadth:
Definition: Market breadth refers to the number of stocks advancing versus the number declining in the stock market. It provides insight into the overall health and strength of a market move.
Use in Identifying Bull/Bear Markets:
Bull Market Indicators: In a bull market, market breadth is typically strong, with a large number of stocks advancing. This indicates widespread participation in the market rally, confirming the strength and sustainability of the upward trend.
Bear Market Indicators: Conversely, in a bear market, market breadth weakens, with more stocks declining than advancing. This suggests that the downward movement is broad-based across the market, reinforcing the bearish sentiment.
How the indicator does this: The number of stocks in a bullish/bearish trend is counted and normalised to a percentage to determine what percentage of stocks in the overall market are bullish/bearish.
2. Price Action:
Definition: Price action involves the study of historical price movements to predict future price direction. It includes analyzing patterns, trends, and the reactions of prices to certain levels (like support and resistance).
Use in Identifying Bull/Bear Markets:
Bull Market Indicators: In a bull market, price action typically shows higher highs and higher lows, indicating an ongoing upward trend. The reaction to support levels is often strong, with prices bouncing off these levels.
Bear Market Indicators: In a bear market, the price action is characterized by lower highs and lower lows. Prices tend to break through support levels and bounce off resistance levels, reflecting the dominant downward trend.
3. Trend Analysis:
Definition: Trend analysis involves identifying the direction and strength of market movements. This was done using moving averages.
Use in Identifying Bull/Bear Markets:
Bull Market Indicators: A bull market is often identified by upward-sloping trendlines and prices consistently staying above key moving averages.
Bear Market Indicators: In a bear market, the trendlines slope downwards, and prices remain below key moving averages.
How the indicator does this: The average closing prices of the largest capitalised stocks and their intermediate trend is assessed relative to their moving averages, the moving average combines price action and trend because it is simply the average closing price over time.
/Originality
This indicator is simple and effective in that it uses multiple factors to assess the market environment. Market breadth gives an overview of the participation level in the market trend, price action helps identify specific patterns and reactions to key levels indicating a bull or bear market, and trend analysis provides a macro view of the market direction and its strength. Combining these tools can gives a comprehensive picture of the market environment and help in distinguishing between bull and bear markets. The market environments are boldly marked out through background colours and triangle markers. The indicator performance is only valid from 2002 to date because the market breadth data used is not available before this date.
Why market Market breadth: Because it takes into account all the stocks in the market, this is essential in identifying the level of participation in a trend.
Why moving averages: Because it ensures that the price action and overall trend of the stocks can be monitored over a given lookback period
So together, moving average/price action + market breadth = trend + participation
Note:
The indicator has no predictive power, performance described here does not guarantee future results. Equity markets are particularly volatile and prone to cycles, and individual psychology can significantly affect indicator interpretation. Price data may also vary across exchanges.
/Settings
The parameters are fixed and there is no room for optimisation however, style settings can be modified by the user.
/Tickers
The BBI indicator is ticker agnostic but best viewed on a 1 day chart of the SPY.

Technical Analysis Notes👉 Hello trader.
- In the process of monitoring the list of trading pairs such as stocks, cryptocurrencies... I often mark signals such as: RSI divergence, MACD, Stochatic, RSI trendline, Trendline..."by hand" , like recording on a drawing board, or excell, notepad... Therefore, taking notes is very limited. In addition, each time frame gives different, inconsistent signals and it is difficult to analyze the trend of a trading pair. somehow.
- After a period of careful research, I created the "Technical Analysis notes" indicator to solve the problems mentioned above, and after using it, I personally found it very effective to mark it. Trading signals as well as trend analysis across time frames from small to large.
- For example: On weekends, I often use automatic scanning indicators (about 200 codes) RSI divergence, RSI trendline, Trendlines, MACD-histogram .. within a week, then mark trading pairs when there are signals. Signals such as RSI cutting its trend line, price breaking through the trend line, Histogram MACD divergence... in the weekly frame, from there look to the D1, H4 frames to see the next signals in those frames to find the direction of intersection. Move in the same direction as the weekly frame signal to trade in the same trend. From that analysis, I limit my ability to go against the trend, and wait patiently for the signals that have been noted before.
- On this board you can monitor 10 transaction codes (in real time)
- On this table I have given 4 different time frames (can be customized in settings)
- I add Kumo Cloud (ichimoku) signals on 4 time frames so that people can easily recognize the trend when the price is above the cloud (green circle), in the cloud (white circle), below the cloud (green circle). red circle)
- I add fast typing mode, shortcut typing depending on each person's description including 16 fast typing modes (for example: "ru:RSI br up" in my understanding means the RSI line has broken above the trend line direction)
- From the above example "ru:RSI br up" the sign ' : ' is the separator that must be present to interpret the word 'ru' as being typed quickly, and 'RSI br up' is the part that explains the content of that word typed quickly.
- In those 16 quick typing boxes (divided into 4 rows), the first 3 rows are colored with custom boxes for each person. The last remaining row is not filled.
- The content of note boxes can be hidden in the settings using the check box.
- In particular, the private notes column cannot be hidden, because it is the column for recording, synthesizing, analyzing, identifying main trends, or waiting points to place orders... (This box is the most important in my opinion. ..)
- Has a super smart warning mode (customizable) when Kumo cloud signals are in the same color on 4 time frames for the most certain trend (green - bullish, red - bearish)
- In the warning section, you can adjust from 4 time frames to 3 time frames, 2 time frames, 1 time frame.
- Alert mode lists exact code names when one or more codes qualify. (eg BTC, ADA, BNB...)
--------------------------------------------------------------------------------------------------------------------
👉 Vietnamess
- Trong quá trình theo dõi danh sách các cặp giao dịch như cổ phiếu, tiền điện tử...tôi thường đánh dấu các tín hiệu như : phân kì RSI, MACD, Stochatic, trendline RSI, Trendline ..."bằng tay", như ghi trên bảng vẽ, hoặc excell, notepad...Vì vậy ghi chép rất hạn chế ngoài ra mỗi khung thời gian cho các tín hiệu khác nhau, không đồng nhất và rất khó để phân tích xu hướng của một cặp giao dịch nào đó.
- Sau một thời gian nghiên cứu kĩ lưỡng tôi có lập lên được chỉ báo "ghi chép Phân tích kĩ thuật " nhằm giải quyết các vấn đề nêu như trên, và sau quá trình dùng, cá nhân tôi thấy rất hiệu quả khi đánh dấu các tín hiệu giao dịch cũng như phân tích xu hướng qua các khung thời gian từ nhỏ đến lớn.
- Ví dụ: Cuối tuần tôi thường dùng chỉ báo quét tự động(khoảng 200 mã) RSI phân kì, RSI trendline, Trendlines , MACD-histogram .. trong khung 1 tuần, sau đó đánh dấu những cặp giao dịch khi có những tín hiệu như RSI cắt đường xu hướng của nó, giá đột phá đường xu hướng, phân kì Histogram MACD.. trong khung tuần, từ đó tìm đến những khung D1,H4 xem các tín hiệu tiếp theo trong các khung đó để tìm hướng giao dịch cùng hướng với tín hiệu khung tuần để giao dịch cùng xu hướng. Từ những phân tích đó tôi hạn chế được đi ngược xu hướng, và kiên nhẫn chờ đợi khi có tín hiệu được đã ghi chú từ trước.
- Trên bảng này có thể theo õi được 10 mã giao dịch(theo thời gian thực)
- Trên bảng này tôi có đưa ra 4 khung thời gian khác nhau(có thể tùy chỉnh trong thiết lập)
- Tôi đưa thêm tín hiệu Mây Kumo( ichimoku) trên 4 khung thời gian để mọi người từ đó dễ dàng nhận biết xu hướng khi giá trên mây(dấu tròn xanh lá) , trong mây(dấu tròn trắng) , dưới mây(dấu tròn đỏ)
- Tôi đưa thêm chế độ gõ nhanh, gõ tắt tùy theo diễn tả của mỗi người gồm 16 chế độ gõ nhanh (ví dụ: "ru:RSI br up" theo ý hiểu của tôi là đường RSI đã phá vỡ lên trên đường xu hướng)
- Từ ví dụ trên "ru:RSI br up" dấu ' : ' là ngăn cách phải có để diễn giải từ 'ru' là gõ nhanh, còn 'RSI br up' là phần diễn giải nội dung của từ gõ nhanh đó
- Trong 16 ô gõ nhanh đó(được chia làm 4 hàng) có 3 hàng đầu được tô màu ô tùy chỉnh cầu mỗi người. hàng cuối cùng còn lại không được tô.
- Nội dung các ô ghi chú có thể được ẩn hiện trong mục cài đặt bằng ô dấu tích.
- Đặc biệt cột ghi chú riêng tư không ẩn được, vì đó là cột ghi chép, tổng hợp , phân tích , nhận định xu hướng chính, hay điểm chờ để đặt lệnh...(ô này theo tôi là quan trọng nhất...)
- Có chế độ cảnh báo siêu thông minh(có thể tùy chỉnh) khi tín hiệu mây Kumo cùng trên 4 khung thời gian cùng màu cho xu hướng chắc chắn nhất(xanh- tăng giá, đỏ- giảm giá)
- Trong mục cảnh báo có thể điều chỉnh từ 4 khung thời gian xuống còn 3 khung thời gian, 2 khung thời gian, 1 khung thời gian.
- Chế độ cảnh báo được liệt kê tên mã chính xác khi một hay nhiều mã đủ điều kiện .(ví dụ BTC , ADA , BNB...)
Trendline_Pro[vn]👉Hello Trader :
- This is an indicator for trendline traders of Price
- Pine Script strategy draws pivot points and trendlines on the chart.
- This strategy allows the user to specify the interval to calculate the pivot points and the number of pivot points used to generate the trend lines.
- When an up (or down) trendline is drawn according to the settings in the indicator's settings, that line is support and resistance so we can proceed to make BUY or SELL points according to the support strategy. and resistance
- When the price line breaks above or below the trendline, the price has reversed to the nearest trendline (like the examples in the pictures below.)
- The horizontal lines of the trend line, after being broken, it will form a support or resistance area, and it is likely that the price will retest that area to continue following the broken trend.
• Up trendline, down trendline(Đường xu hướng tăng - xanh, đường xu hướng giảm - đỏ)
• Horizontal support and resistance lines (đường hỗ trợ và kháng cự ngang)
snapshot
• Price in the wedge model (giá trong mô hình cái nêm)
snapshot
• When the price breaks the trend line, we can consider entering an order (khi giá phá vỡ đường xu hướng ta có thể cân nhắc vào lệnh)
snapshot
• Maybe when the price breaks the trend line on one side, consider waiting for the price to return to the horizontal support and resistance line to place an order. (có thể khi giá phá vỡ đường xu hướng về một phía , cân nhắc chờ giá hồi về đường hỗ trợ , kháng cự ngang để đặt lệnh)
snapshot
• Create an alert when the price breaks the trend line (there are 3 alert functions: breaking the upper trend line, breaking the lower trend line, or both) - Tạo cảnh báo khi giá phá vỡ đường xu hướng(có 3 chức năng cảnh báo: phá vỡ đường xu hướng bên trên,phá vỡ đường xu hướng bên dưới, hoặc cả hai)
----------------------------------------------------------------------------------------------------------------------
👉Xin chào các Trader Vietnam
- Đây là chỉ báo dành cho các trader thuộc trường phái phân tích đường xu hướng của giá
- Chiến lược Pine Script vẽ các điểm trục và đường xu hướng trên biểu đồ.
- Chiến lược này cho phép người dùng chỉ định khoảng thời gian tính toán các điểm xoay và số điểm xoay được sử dụng để tạo các đường xu hướng .
- Khi đường xu hướng tăng(hoặc giảm) được vẽ ra theo các thiết lập trong cài đặt của chỉ báo,thì đường đó là hỗ trợ,kháng cự để ta có thể tiến hành thực hiện điểm BUY hoặc SELL theo chiến lược hỗ trợ và kháng cự
- Khi đường giá mà phá vỡ lên trên hoặc xuống dưới đường xu hướng thì giá đã đảo chiều ngược với đường xu hướng gần nhất (như các ví dụ trong các hình .)
- Những đường nằm ngang của đường xu hướng sau khi bị phá vỡ nó sẽ hình thành cho ta là vùng hỗ trợ hoặc kháng cự mà rất có thể giá sẽ kiểm tra lại vùng đó để tiếp tục theo xu hướng bị phá vỡ.
----------------------------------------------------------------------------------------------------------------------
⌛Adjust in settings(Điều chỉnh trong mục cài đặt)
• Change the color of the trendline as you like(đổi màu đường trendline tùy ý theo sở thích)
• Change the way the trendline is drawn(thay đổi cách vẽ đường trendline)
• Warning option and number of warnings(tùy chọn cảnh báo và số lần cảnh báo)
• Clearly show the value of support and resistance lines after the trendline is broken(hiện rõ ràng giá trị của đường kháng cự,hỗ trợ sau khi trendline bị phá qua)
• In the process of monitoring the price chart I found giving trendline parameters like this is the best.These are:
• Small timeframes such as m1, m3, m5 or D1 I leave the default (cannot be changed) in the 'Length' setting = 50, timeframe is H6, H8, H12 'Length' = 30, the rest of the time can be changed, the default is 20 ...
----------------------------------------------------------------------------------------------------------------------
💥From this trend line indicator, I have created an indicator: "automatic trend line scanner" for 20 trading pairs (up to 200 trading codes) and has a super smart warning when a pair's price breaks. trend line break, from which traders do not have to monitor each code but can still know its current status to be able to place orders.
{20}Dashboard Trendlines & Wedge_Pro
💥Từ chỉ báo đường xu hướng này tôi có lập chỉ báo : "máy Quét tự động đường xu hướng " của 20 cặp giao dịch (có thể lên tới 200 mã giao dịch) và có cảnh báo siêu thông minh khi cặp nào đó giá phá vỡ đường xu hướng(Link trên), từ đó trader không phải theo dõi từng mã mà vẫn có thể biết được hiện trạng của nó để có thể đặt lệnh .

BRAHMA_ALARMThe indicator is an update to the "HMA-Kahlman Trend & Trendlines" script by capissimo, which is available at the following link: The update includes the integration of an alarm function to provide additional functionality.
The indicator continues to be based on the combination of the HMA (Hull Moving Average)-SMA (Simple Moving Average) method and the Kalman filter to generate precise trading signals. The original script by capissimo serves as the foundation for the SIMSOIL indicator, which has been enhanced by the addition of the alarm function to keep traders informed of potential trading opportunities.
It is important to emphasize that indicator is developed as an update to the original script by capissimo. I would like to thank capissimo for their original work on the script, and I have added the alarm function as an extension.

TRENDCATOR - Trend Of IndicatorsHello Traders :)
I am Only Fibonacci.
I would like to give you detailed information about this indicator that I have prepared.
With this tool you add to your chart, you can automatically draw the falling trend and rising trend lines of many indicators.
I've prepared a few extra nice things for you. With this indicator, you can see the instantaneous values of active trend lines and their distance from the indicator value.
We are now ready to introduce.
You can use this indicator in two languages. English and Turkish. The choice is yours.
When we enter the indicator settings, there is a group under the TREND heading. With the settings in this group, you can determine the sensitivity of the trends to be plotted. The lower the sensitivity, the less reliable the plotted trends will be. I am sure you will find the middle ground.
Trends are calculated by relationships between all detected peaks.
If you check the Show Data box, you can see the value of the active (unbroken) trends in the current candle. Sometimes it can create visual pollution. So you can remove it. Below will be a version view where the values of the trendlines are visible.
With this tool, you can add any indicator you choose from the settings section to the chart and draw the trend lines automatically.
You can add RSI, ATR, CCI, MFI, MOM and various moving averages to your chart and draw a trend line. Below will be an image of the Momentum indicator.
You can edit the following from the settings section of this tool:
The language you will use, EN-TR
Colors of trend texts
Trend sensitivity
Thickness and colors of downtrend and rising trendlines
Hide and show trends
Hide and show trend values
Changing the background and text color of the box where the indicator name appears
Determining the source of the selected indicator
Determining the period of the selected indicator
Determine the color of the line of the selected indicator
Note: If the period value is not used in the calculation formula of the indicator you selected, the period selected in the settings will not be included in the calculations.
Note 2: If the source value is not used in the calculation formula of the indicator you have chosen, the source value selected in the settings will not be used.
Broken, inactive trend lines disappear.

Time Anchored Intraday High/Low TrendlineOftentimes, intraday trendlines that are started at specific times, e.g. 8:00am or market open 9:30am, are well respected throughout the trading day.
This indicator draws up tp 3 intraday trendlines that are anchored at user defined times, respectively at the corresponding candle's high and low points.
From there, the line*s xy2 are connected in a way that all following candles are enclosed.