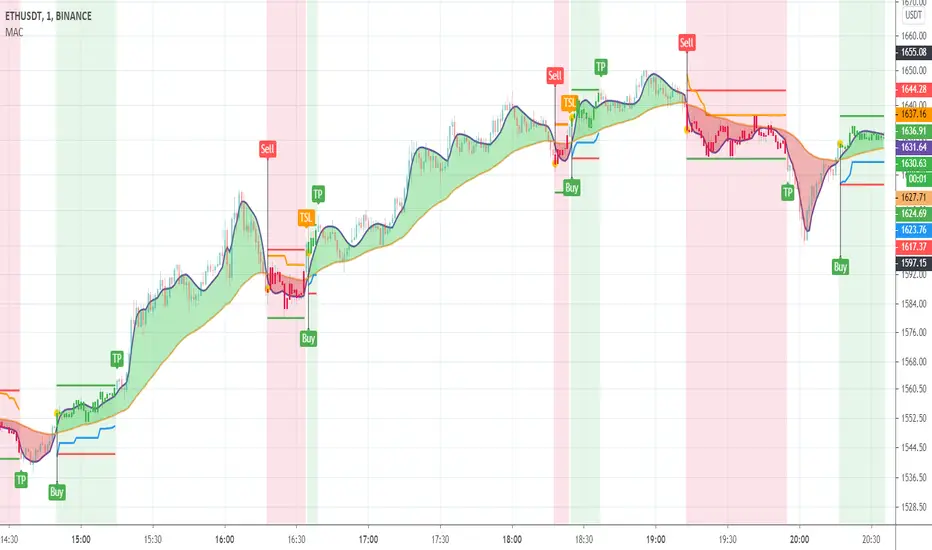
Moving

EMA 21,13,8 - scalping3 EMAs will help identify and predict uptrends and downtrends
-If EMAs are all above the candles it a sign to sell & if the EMAs are below its a sign to buy
- If the Green-8 EMA crosses or touches red candle then flips under the other EMAs & candles then it's time to sell
-If the Green-8 EMA crosses or touches green candle then flips above the other EMAs & candles then it's time to buy
- how far is the EMAs from the candle it'll show how strong the trend. combine this strategy with the stochastic oscillator & RSI to get the maximum benefit


Multiple Moving AveragesThis is an indicator with 4 moving average slots and 6 exponential moving average slots
It also has bollinger bands and a volume weighted moving average slot
Feel free to edit this and add/remove some and publish your own
Smooth Moving Average Zones @PuppyTherapyThis script is basically a showcase of what you can graphically do to a moving average.
You have access to
2 sets of 4 moving averages each of those can use HA Candles as a source ( calculated in the script will not repaint if you are concerned with that )
additional smoothing to each set
a multitude of moving average types I am too lazy to type out ( please give me a thumbs up for honesty )
each moving average has a shade + zone
If you happen to like it and use just a few of those I would suggest you remove smoothing as it eats a lot of performance of making your own script of what you actually use to really bost with the performance. I am fully okay with you copying and sharing this idea. Just remember to share the colors!
PS: I would like to thank pinescripters RicardoSantos / LucF / everget !

AntiRekt RibbonThis script is a fork of the Madrid Ribbon, the only difference is that you can color your bars depending on the trend.

Krowns 10 PACK Combo (5 EMAs, 5 SMAs) - v2Version 2 - Krowns Crypto 10 pack moving average set - written by "Kick Back Time" also known as Mr.Scrogers Neighborhood
...after receiving a lot of likes from the first version I thought I would go ahead and put out the updated version that I've been using
There's a few things I've changed to make it easier to adapt to.
This set is very similar to what Krown uses - I rarely look at the 100 SMA, but I do like the 128 SMA, so I made it default over the 100...
It's all adjustable in values, colors, line thicknesses, etc... it's all good
Tweeks/Improvements:
1) now has a shorter overlay title so it takes up less space on the chart and is less distractive
2) the 30, 50 and 128 SMA's are now default pink which stand out well and are easier to associate as SMA's
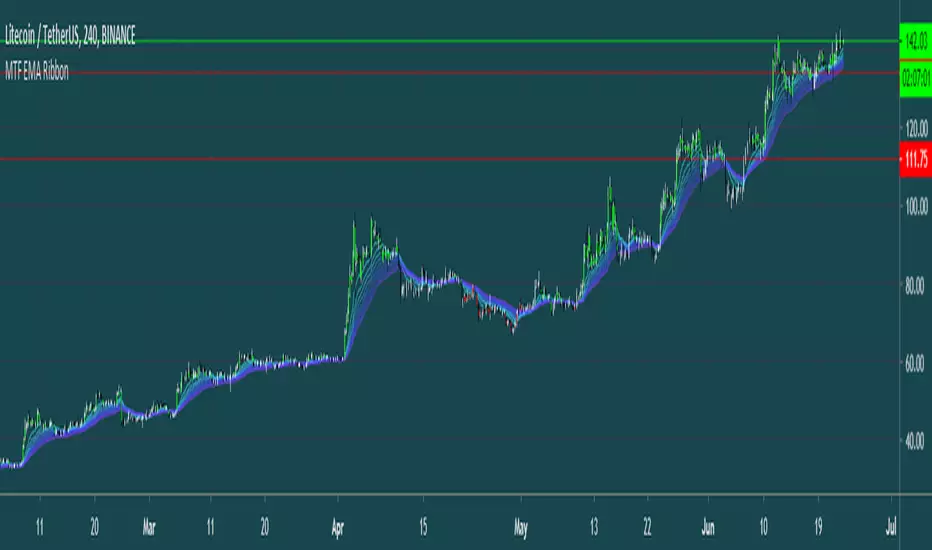
MTF EMA RibbonThis Script analyses trends using an EMA Ribbon (Can be adjusted to any timeframe).
tips are always welcome at: 38uGQJDDZDL6wX48x4gYTccPeQ3ZHVYmY4 (btc)
I hope you enjoy the script :)
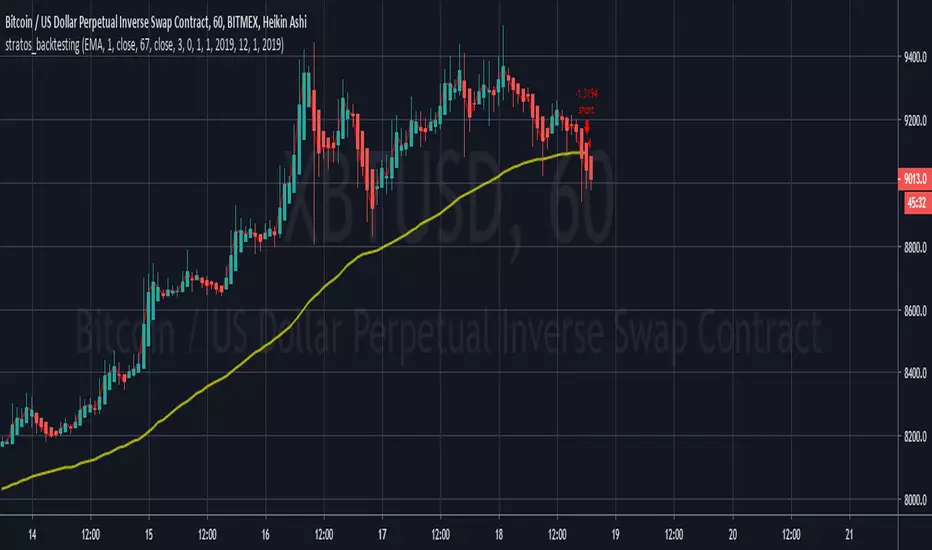
Stratos - Backtesting - Final Version - CryptoFoudid.comHi all,
Here you have the backtesting script based on Moving Average.
We trade automatically for our customers on the bitmex platform. For more information, contact me directly.
Cheers
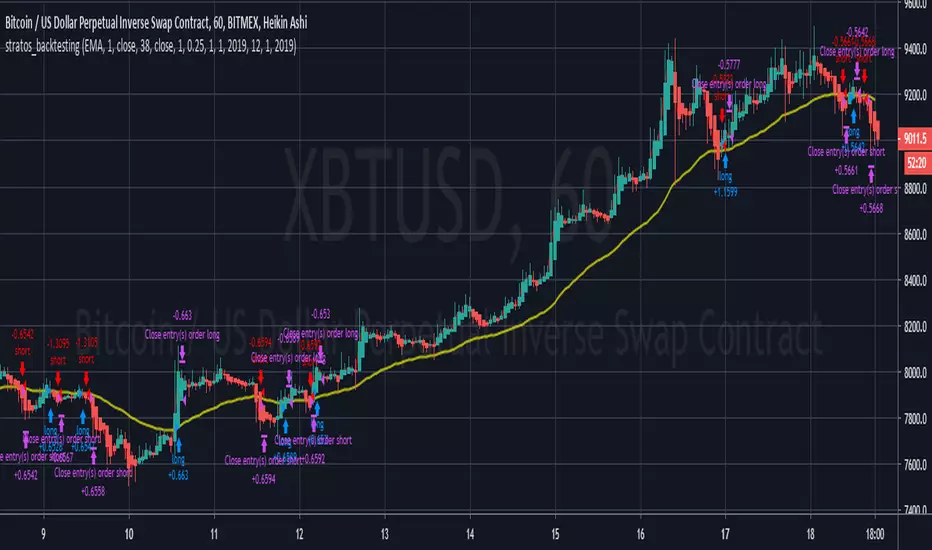
Stratos - Backtesting - Final Version - CryptoFoudid.comHi all !
Here a script based on moving averages with take profit and Stop loss configuration.
You can backtest on every timeframe and choose from when you want to backtest.
We work with our customers with automatic trading on bitmex platfform.
If you want to subscribe, you can dm me directly or on comments below

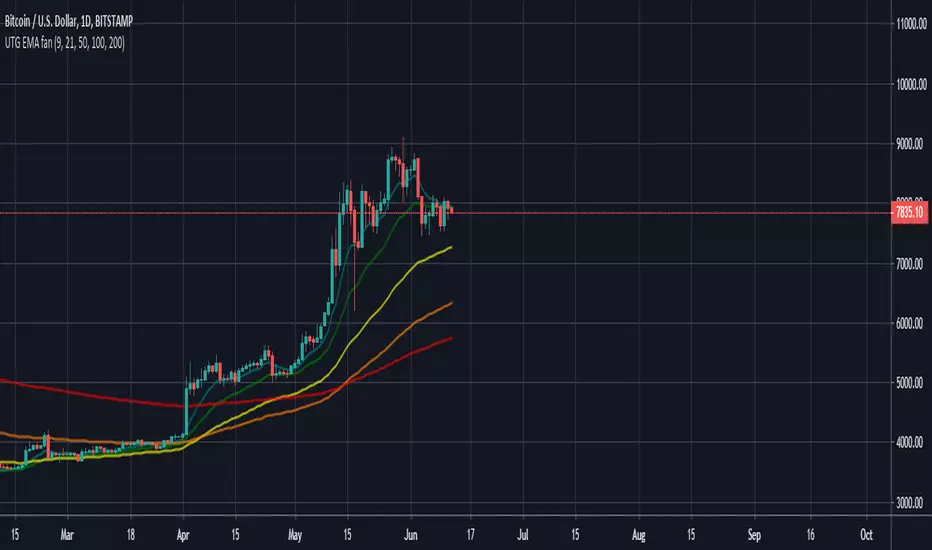
UTG EMA fanA basic EMA fan using the 9,21,50,100 and 200 period EMA.
Great for finding overall trend direction, major levels of support or resistance or early triggers to a potential trend reversal.
Values colors and sizes all customizable to suit your needs.
Moving Average CrossoverIt was planned as an addition to Moving Average Smoothness Benchmark and Profitable Moving Average Crossover , but can be used standalone.
Supports 62 types of well-known moving averages and allows full-featured customization.
Supported types of averages and filters:
AEMA , Adaptive Exponential MA (by Vitali Apirine)
AHMA , Ahrens MA (by Richard D. Ahrens)
ALMA , Arnaud Legoux MA (by Arnaud Legoux and Dimitris Kouzis-Loukas)
ALF , Adaptive Laguerre Filter (by John F. Ehlers)
AMA , Adaptive MA (by Vitali Apirine)
ARSI , Adaptive RSI
BAMA , Bryant Adaptive MA (by Michael R. Bryant)
BF2 , Butterworth Filter with 2 poles
BF3 , Butterworth Filter with 3 poles
DEMA , Double Exponential MA (by Patrick G. Mulloy)
DWMA , Double Weighted (Linear) MA
EDCF , Ehlers Distance Coefficient Filter (by John F. Ehlers)
EDSMA , Ehlers Deviation-Scaled MA (by John F. Ehlers)
EHMA , Exponential Hull MA
EMA , Exponential MA
EVWMA , Elastic Volume Weighted MA (by Christian P. Fries)
FRAMA , Fractal Adaptive MA (by John F. Ehlers)
GF1 , Gaussian Filter with 1 pole
GF2 , Gaussian Filter with 2 poles
GF3 , Gaussian Filter with 3 poles
GF4 , Gaussian Filter with 4 poles
HFSMA , Hampel Filter on Simple Moving Average
HFEMA , Hampel Filter on Exponential Moving Average
HMA , Hull MA (by Alan Hull)
HWMA , Henderson Weighted MA (by Robert Henderson)
IDWMA , Inverse Distance Weighted MA
IIRF , Infinite Impulse Response Filter (by John F. Ehlers)
JAMA , Jurik Adaptive MA (by Mark Jurik)
JMA , Jurik MA (by Mark Jurik, )
KAMA , Kaufman Adaptive MA (by Perry J. Kaufman)
LF , Laguerre Filter (by John F. Ehlers)
LMA , Leo MA (by ProRealCode' user Leo)
LSMA , Least Squares MA (Moving Linear Regression)
MAMA (by John F. Ehlers)
FAMA , Following Adaptive MA (by John F. Ehlers)
MD , McGinley Dynamic (by John R. McGinley)
MHLMA , Middle-High-Low MA (by Vitali Apirine)
MNMA , McNicholl MA (by Dennis McNicholl)
NSMA , Moving Average 3.0 on SMA (by Manfred G. Dürschner)
NEMA , Moving Average 3.0 on EMA (by Manfred G. Dürschner)
NWMA , Moving Average 3.0 on WMA (by Manfred G. Dürschner)
NVWMA , Moving Average 3.0 on VWMA (by Manfred G. Dürschner)
PEMA , Pentuple Exponential MA (by Bruno Pio)
PWMA , Parabolic Weighted MA
QMA , Quick MA (by John McCormick)
QEMA , Quadruple Exponential MA (by Bruno Pio)
REMA , Regularized Exponential MA (by Chris Satchwell)
RMA , Running MA (by J. Welles Wilder)
RMF , Recursive Median Filter (by John F. Ehlers )
RMTA , Recursive Moving Trend Average (by Dennis Meyers)
SHMMA , Sharp Modified MA (by Joe Sharp)
SMA , Simple MA
SSF2 , Super Smoother Filter with 2 poles (by John F. Ehlers)
SSF3 , Super Smoother Filter with 3 poles (by John F. Ehlers)
SWMA , Sine Weighted MA
TEMA , Triple Exponential MA (by Patrick G. Mulloy)
TMA , Triangular MA (generalized by John F. Ehlers)
T3 , (by Tim Tillson)
VIDYA , Variable Index Dynamic Average (by Tushar S. Chande)
VWMA , Volume Weighted MA (by Buff P. Dormeier)
WMA , Weighted (Linear) MA
ZLEMA , Zero Lag Exponential MA (by John F. Ehlers and Ric Way)
Quick Moving AverageThis moving average was originally developed by John McCormick in 2008 as NinjaTrader indicator. The purpose was to find a cheap replacement for JMA ( ).
Well, not impressive concerning the response.
Source code on request .
10/20 MA Cross-Over with Heikin-Ashi Signals by SchobbejakThe 10/20 MA Heikin-Ashi Strategy is the best I know. It's easy, it's elegant, it's effective.
It's particularly effective in markets that trend on the daily. You may lose some money when markets are choppy, but your loss will be more than compensated when you're aboard during the big moves at the beginning of a trend or after retraces. There's that, and you nearly eliminate the risk of losing your profit in the long run.
The results are good throughout most assets, and at their best when an asset is making new all-time highs.
It uses two simple moving averages: the 10 MA (blue), and the 20 MA (red), together with heikin-ashi candles. Now here's the great thing. This script does not change your regular candles into heikin-ashi ones, which would have been annoying; instead, it subtly prints either a blue dot or a red square around your normal candles, indicating a heikin-ashi change from red to green, or from green to red, respectively. This way, you get both regular and heikin ashi "candles" on your chart.
Here's how to use it.
Go LONG in case of ALL of the below:
1) A blue dot appeared under the last daily candle (meaning the heikin-ashi is now "green").
2) The blue MA-line is above the red MA-line.
3) Price has recently breached the blue MA-line upwards, and is now above.
COVER when one or more of the above is no longer the case. This is very important. You want to keep your profit.
Go SHORT in case of ALL of the below:
1) A red square appeared above the last daily candle (meaning the heikin-ashi is now "red").
2) The red MA-line is above the blue MA-line.
3) Price has recently breached the blue MA-line downwards, and is now below.
Again, COVER when one or more of the above is no longer the case. This is what gives you your edge.
It's that easy.
Now, why did I make the signal blue, and not green? Because blue looks much better with red than green does. It's my firm believe one does not become rich using ugly charts.
Good luck trading.
--You may tip me using bitcoin: bc1q9pc95v4kxh6rdxl737jg0j02dcxu23n5z78hq9 . Much appreciated!--

10/20 MA Cross-Over with Heikin-Ashi Signals by SchobbejakThe 10/20 MA Heikin-Ashi Strategy is the best I know. It's easy, it's elegant, it's effective.
It's particularly effective in markets that trend on the daily. You may lose some money when markets are choppy, but your loss will be more than compensated when you're aboard during the big moves at the beginning of a trend or after retraces. There's that, and you nearly eliminate the chances of losing your profit.
The results are good throughout most assets, and at their best when an asset is making new all-time highs.
It uses two simple moving averages: the 10 MA (blue), and the 20 MA (red), together with heikin-ashi candles. Now here's the great thing. This script does not change your regular candles into heikin-ashi ones, which would have been annoying; instead, it subtly prints either a blue dot or a red square around your normal candles, indicating a heikin-ashi change from red to green, or from green to red, respectively. This way, you get both regular and heikin ashi "candles" on your chart.
Here's how to use it.
Go LONG in case of ALL of the below:
1) A blue dot appeared under the last daily candle (meaning the heikin-ashi is now "green").
2) The blue MA-line is above the red MA-line.
3) Price has recently breached the blue MA-line upwards, and is now above.
COVER when one or more of the above is no longer the case. This is very important. You want to keep your profit.
Go SHORT in case of ALL of the below:
1) A red square appeared above the last daily candle (meaning the heikin-ashi is now "red").
2) The red MA-line is above the blue MA-line.
3) Price has recently breached the blue MA-line downwards, and is now below.
Again, COVER when one or more of the above is no longer the case. This is what gives you your edge.
It's that easy.
Now, why did I make the signal blue, and not green? Because blue looks much better with red than green does. It's my firm believe one does not become rich using ugly charts.
Good luck trading.
--You may tip me using bitcoin: bc1q9pc95v4kxh6rdxl737jg0j02dcxu23n5z78hq9 . Much appreciated!--


AVERAGE MULTI_SMAIndicator returns an average of 5 SMAs. an interesting point that I have noticed that the price has several times reacted on it.
Note 1: Do not just use this as a criterion for buying and selling, use as one more aid.
Note 2: It is possible to leave in the chart all the averages, if you feel it necessary.
------------------------------------//--------------------------------------------------
Indicador retorna uma média de 5 SMAs. um ponto interessante que tenho notado que o preço tem diversas vezes reagido nele.
Observação 1: Não use apenas isso como critério para compra e venda, use como mais um auxilio.
Observação 2: É possivel deixar no grafico todas as médias, caso você ache necessário.

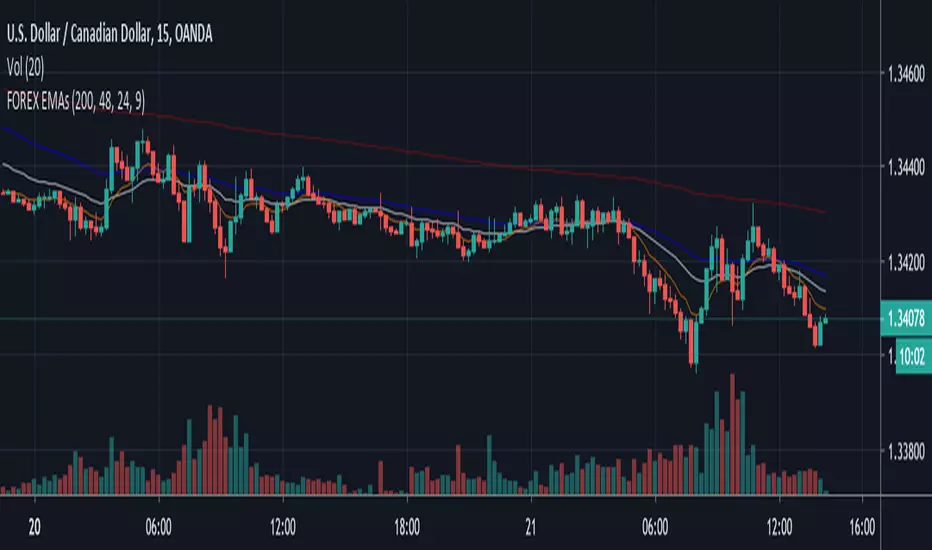
FOREX EMAsPretty simple here - this is the base EMAs I suggest most traders use in the FOREX market for swings and scalp trading. Works well on 5m, 15m, 1H, 4H, and daily trading if you design an edge to interpret the relationship these averages of price are telling you.
The 9EMA is not as valuable on the 1HR timeframe.
Moving Average Trend IndicatorThis Indicator shows you the major moving averages, both in simple and exponential.
